Download to read offline


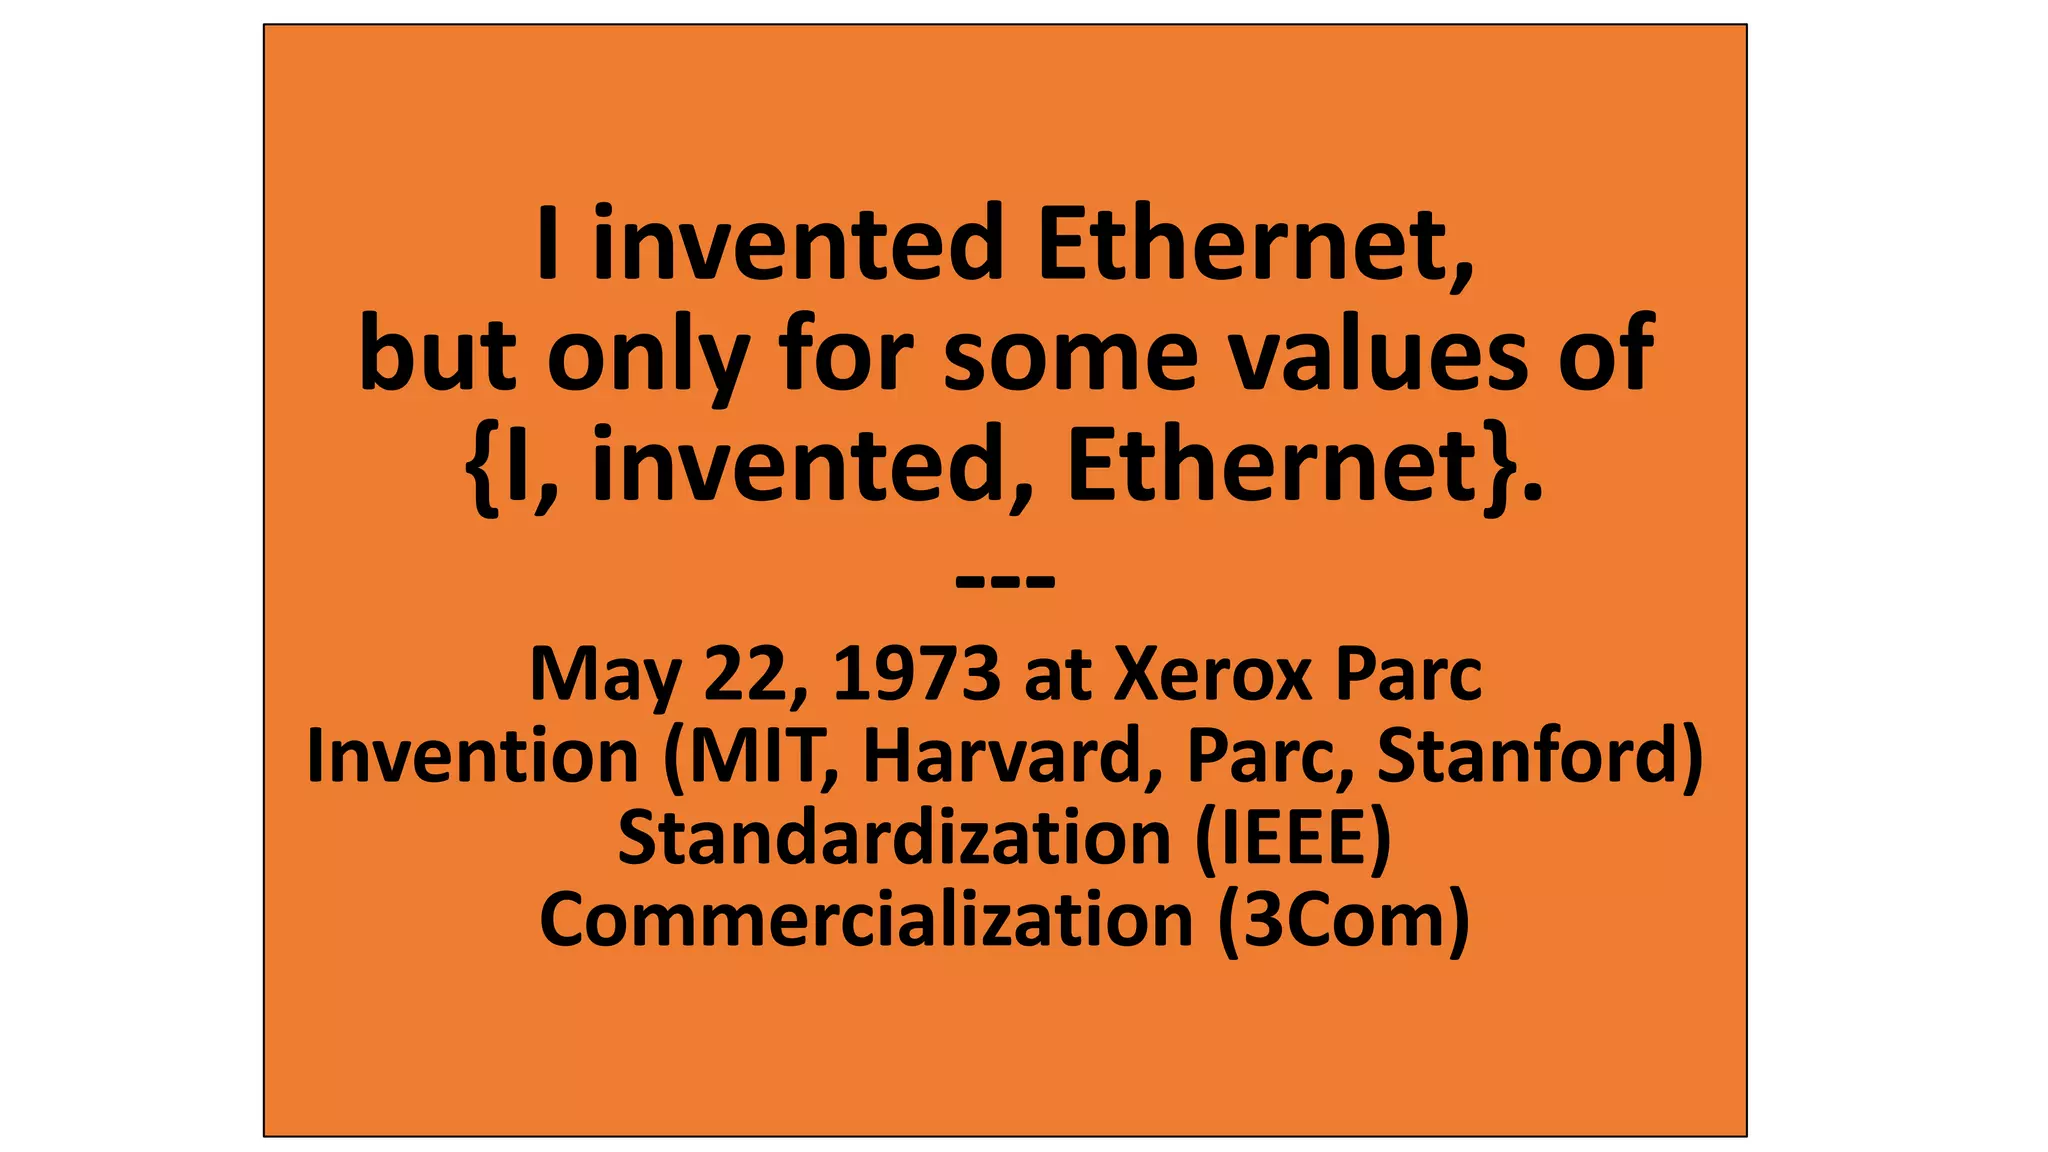
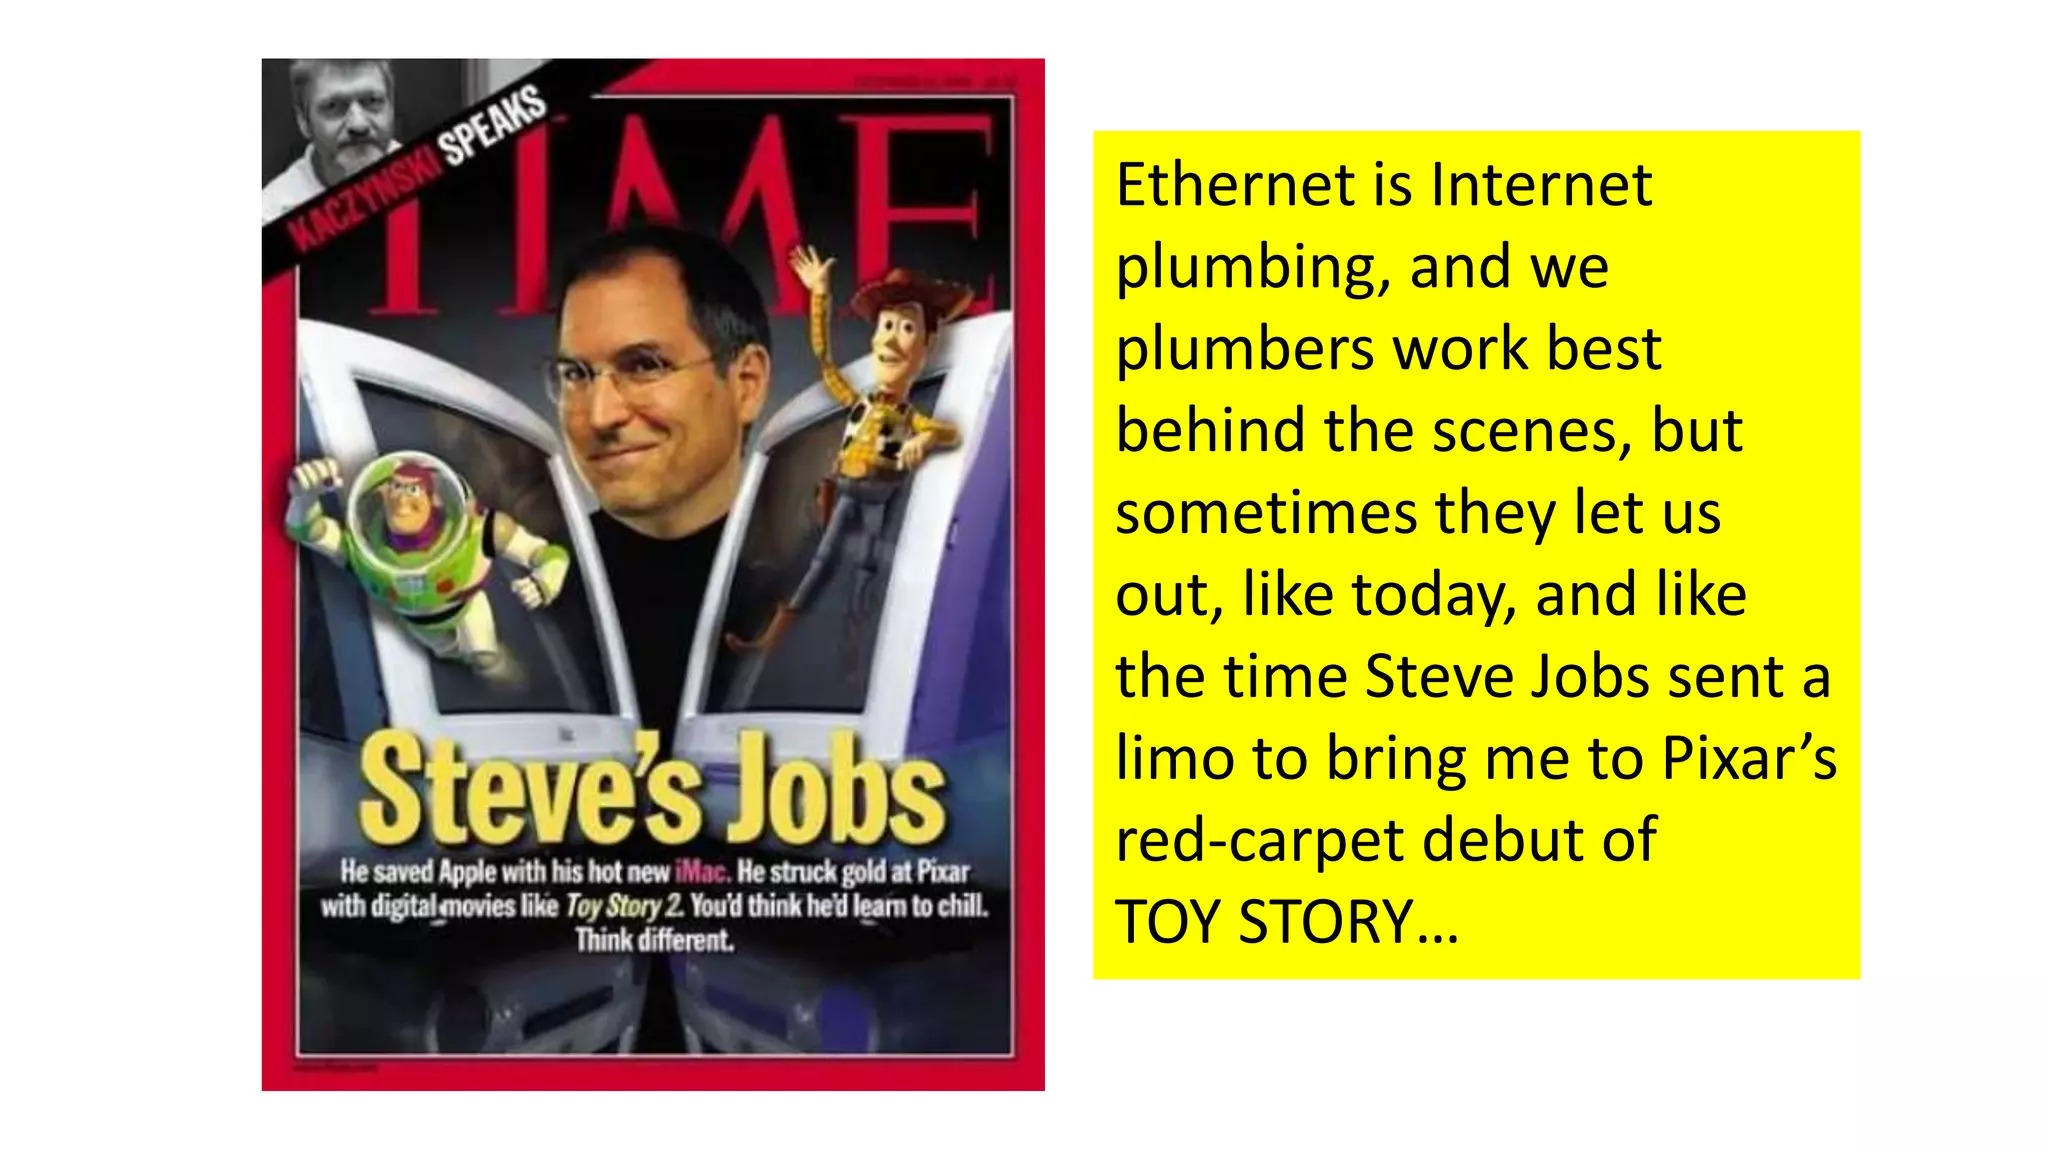


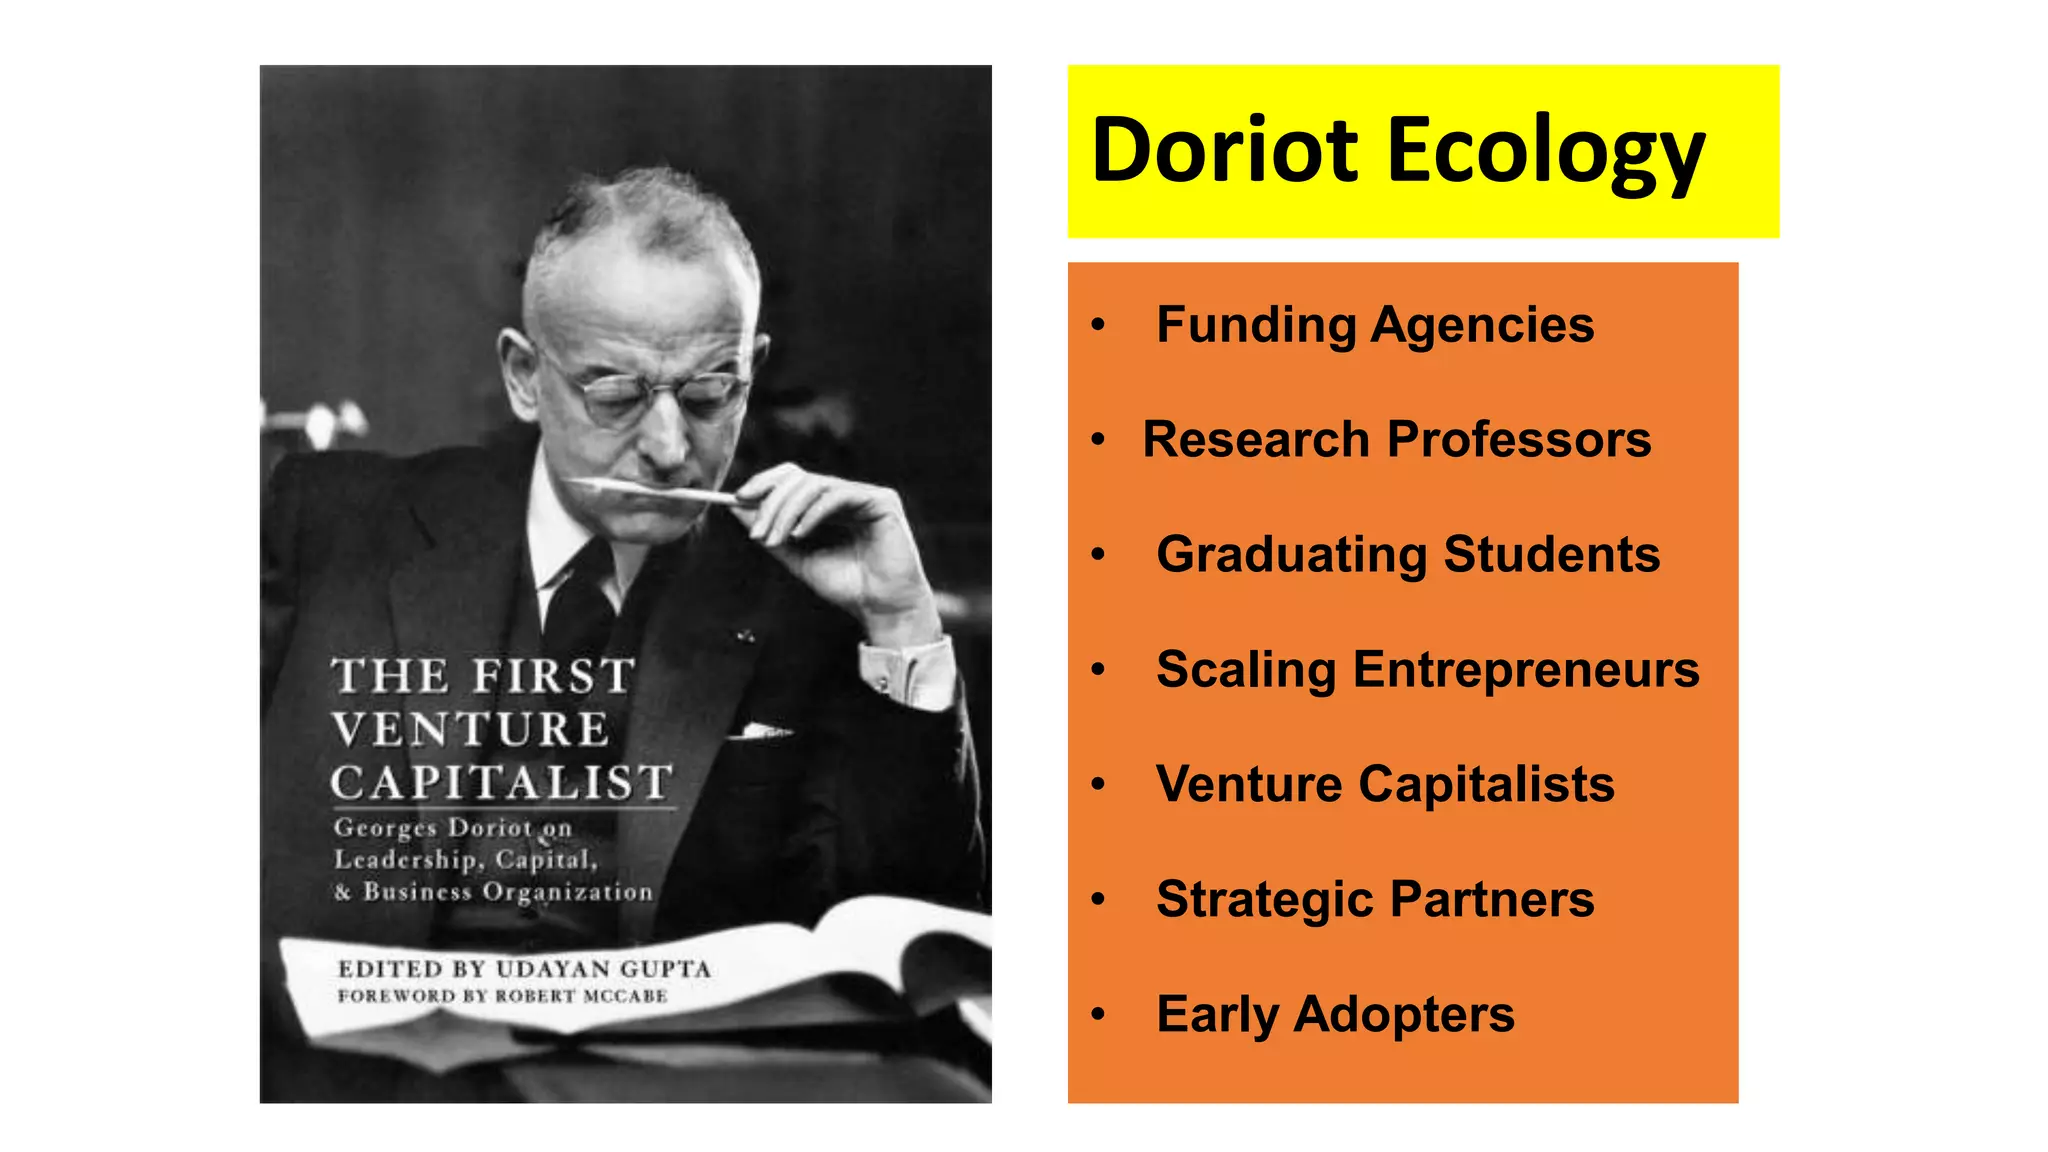

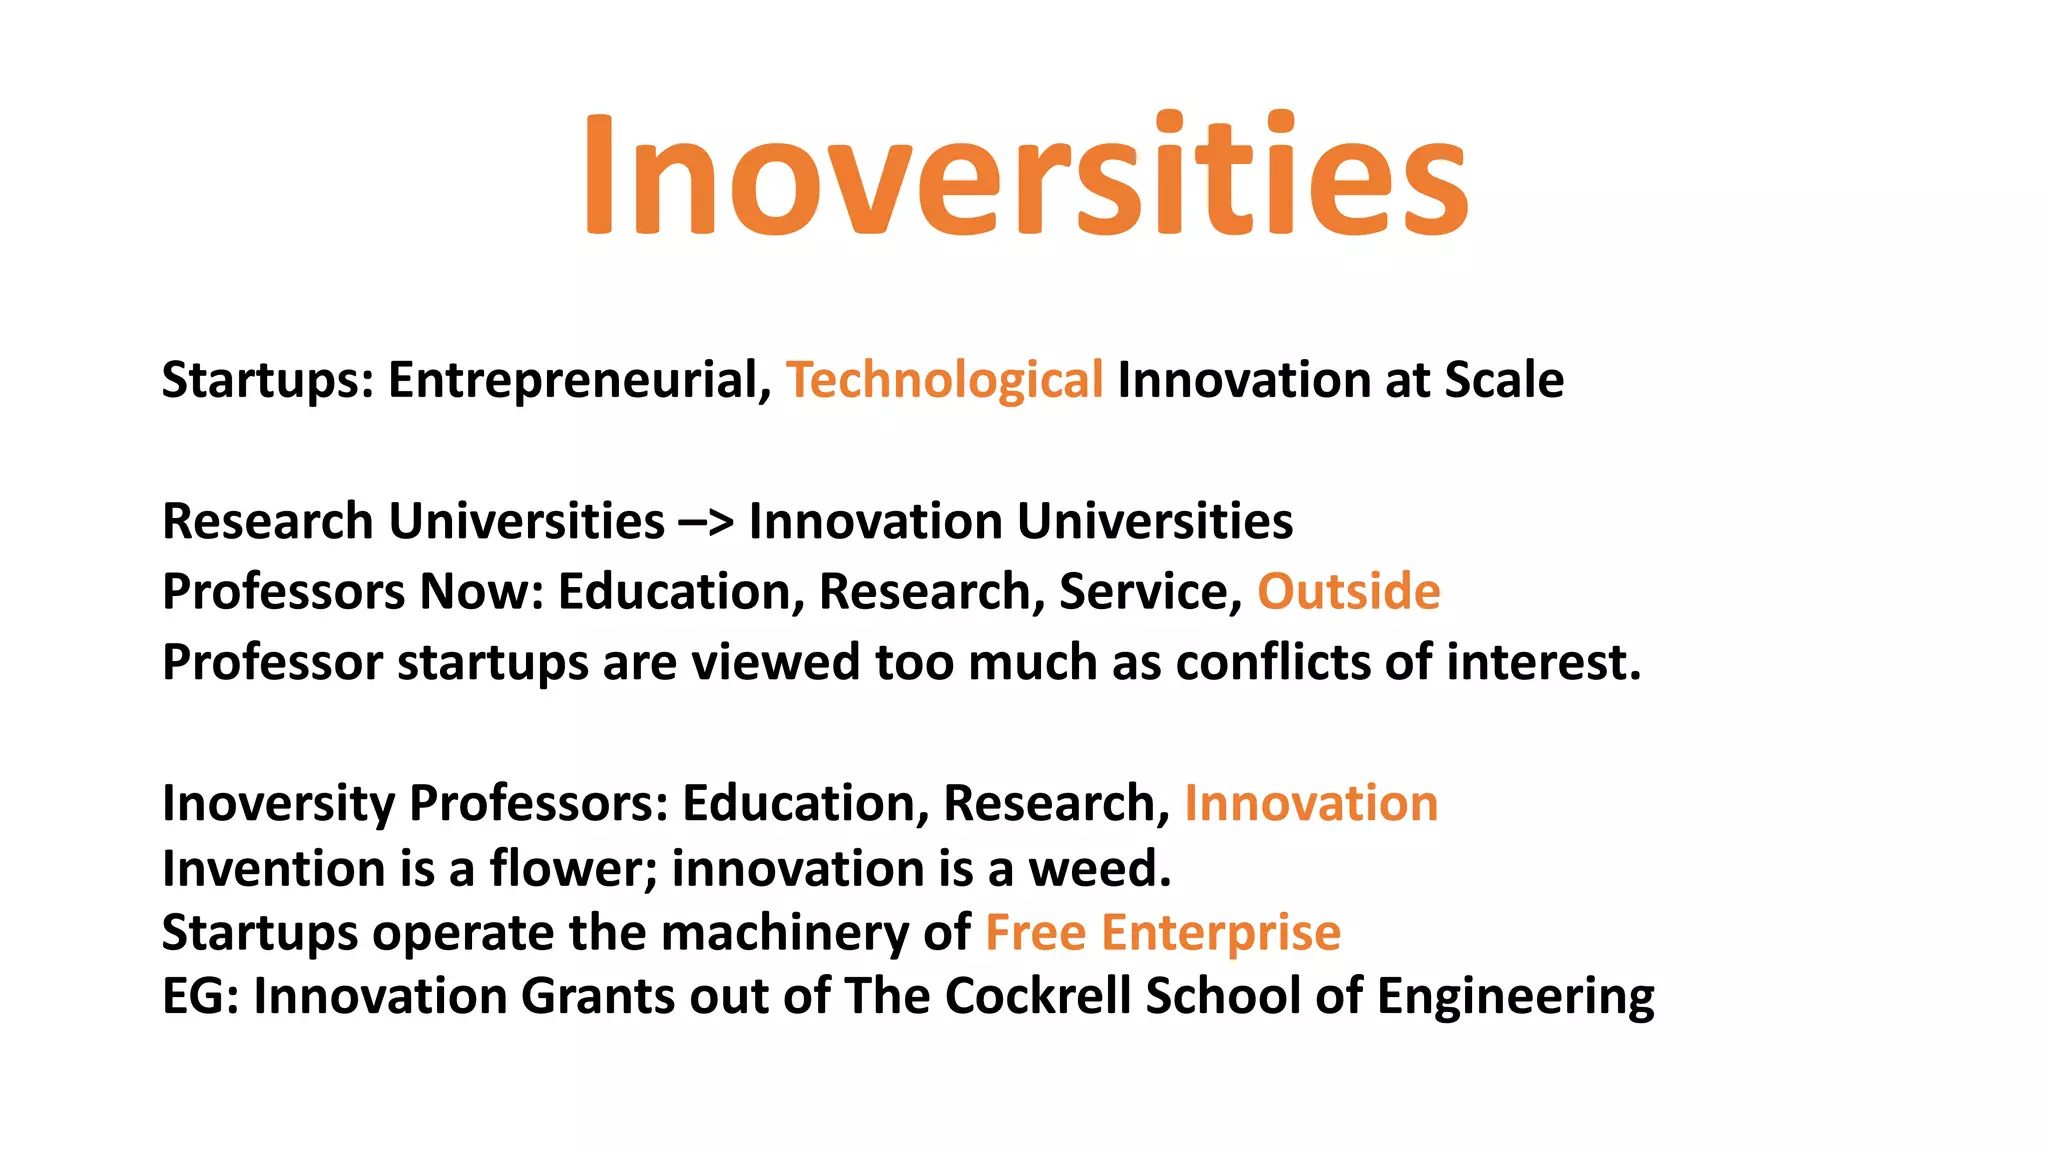
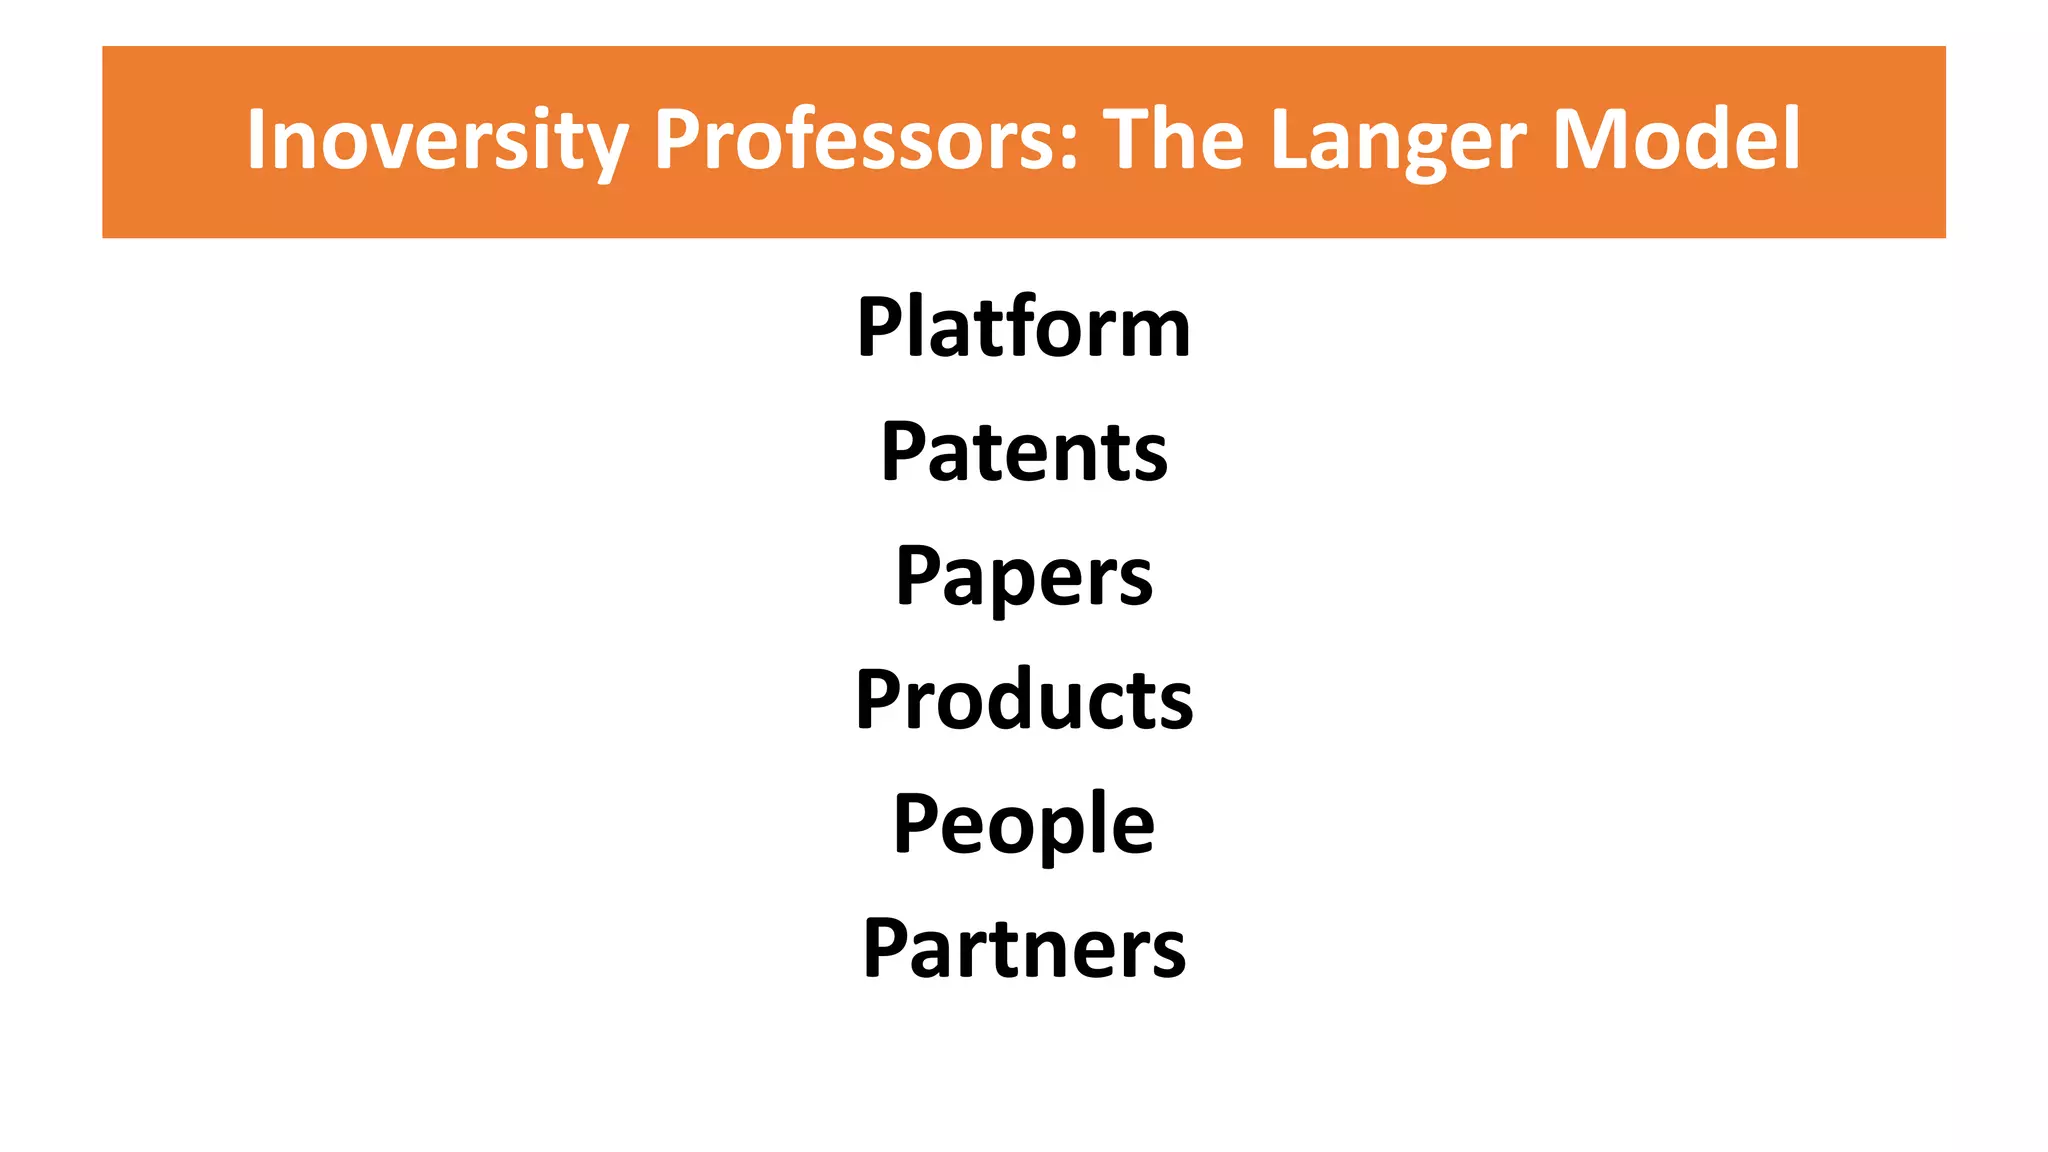
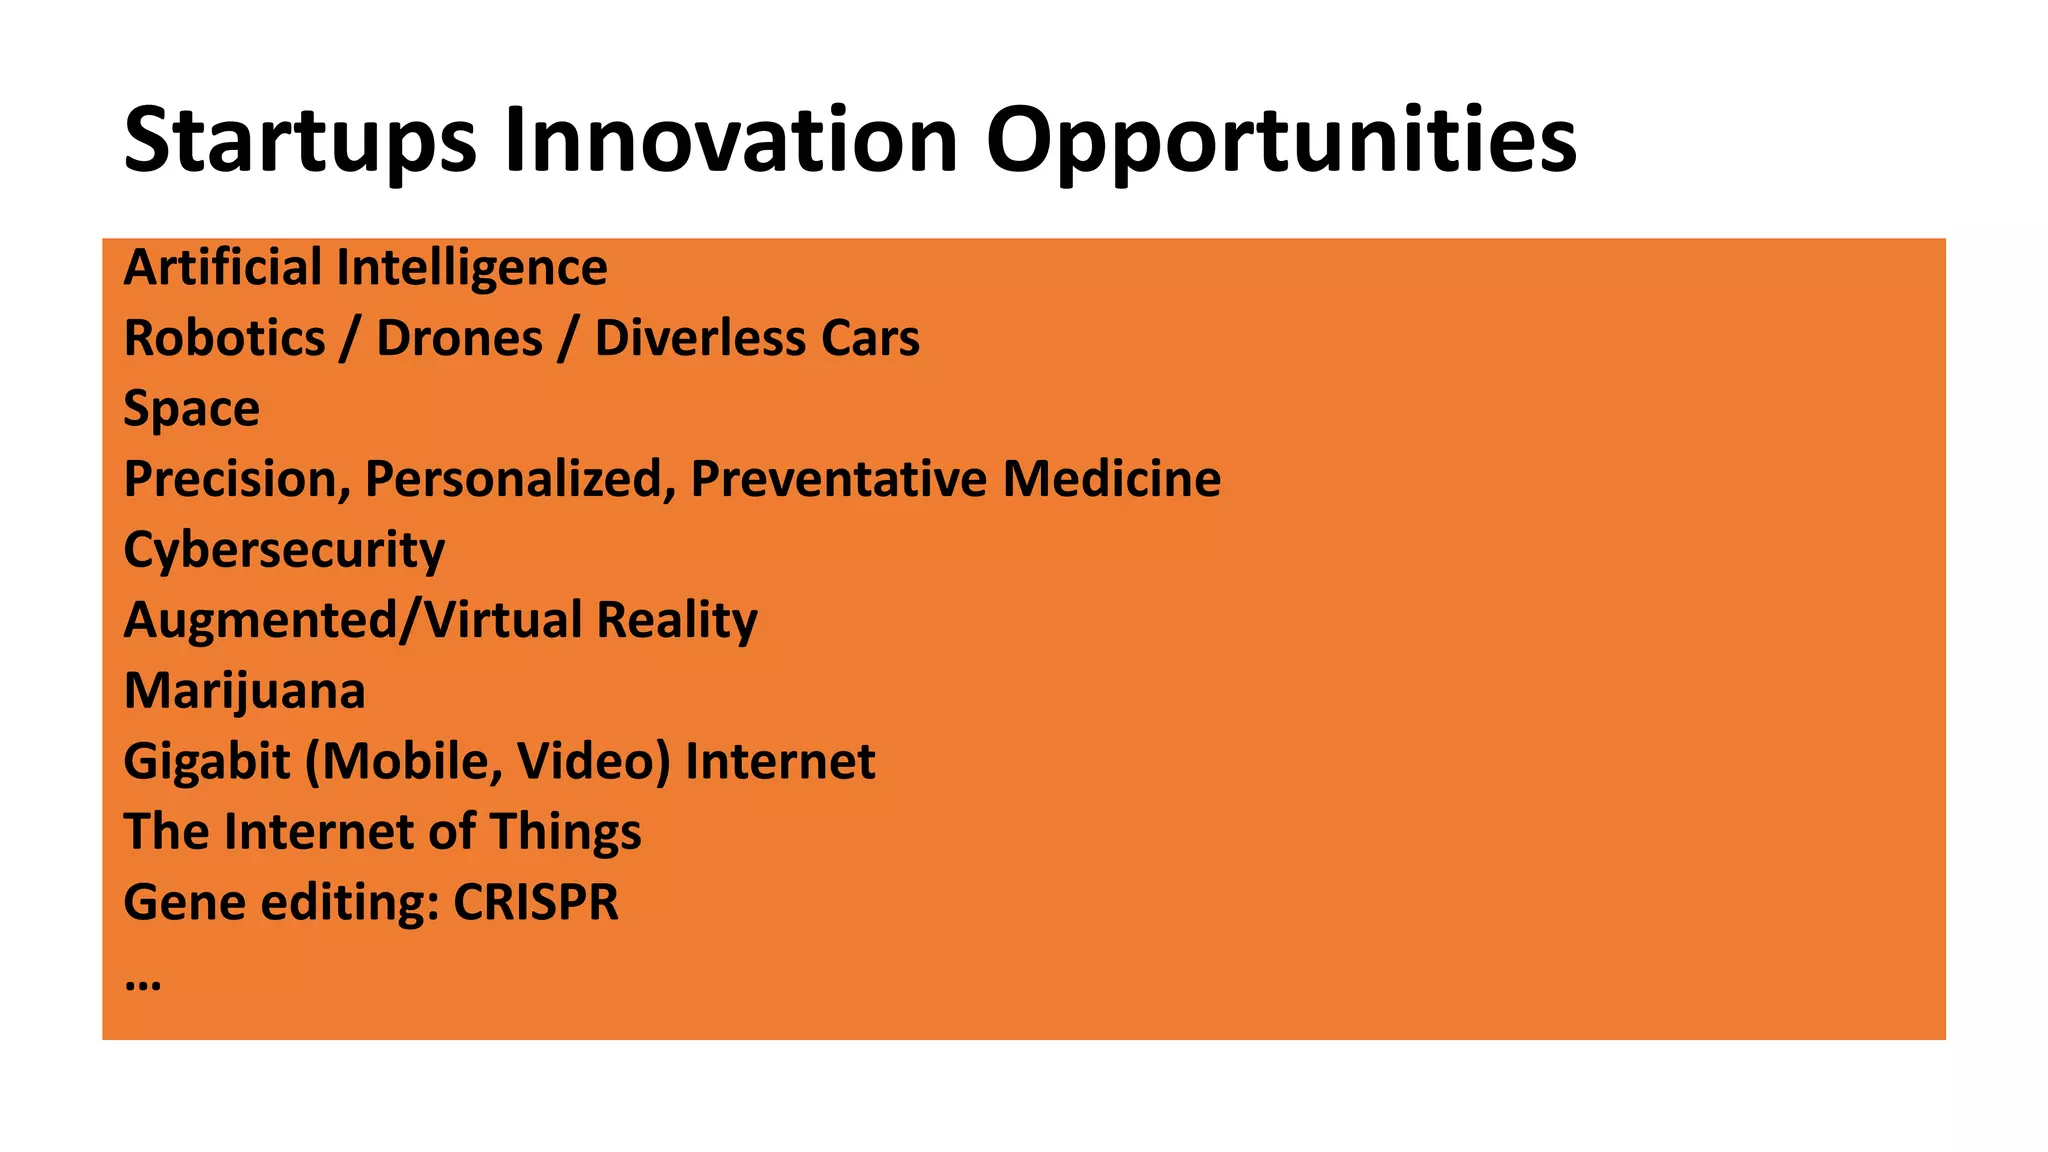


The document summarizes a presentation given by Bob Metcalfe on startup ecosystems. Some key points: - Metcalfe discussed his role in inventing Ethernet and how innovations are commercialized. - He outlined the "Doriot ecology" of factors that support startup innovation, including funding agencies, researchers, entrepreneurs, investors, and customers. - The concept of "Inoversities" was introduced, where universities focus more on innovation and allow professors to start companies based on their research. - Many opportunities for startup innovation were listed, such as artificial intelligence, robotics, healthcare technologies, and the internet of things.


