The document is a research report that compares insurance protection for tangible versus intangible assets. Some key findings:
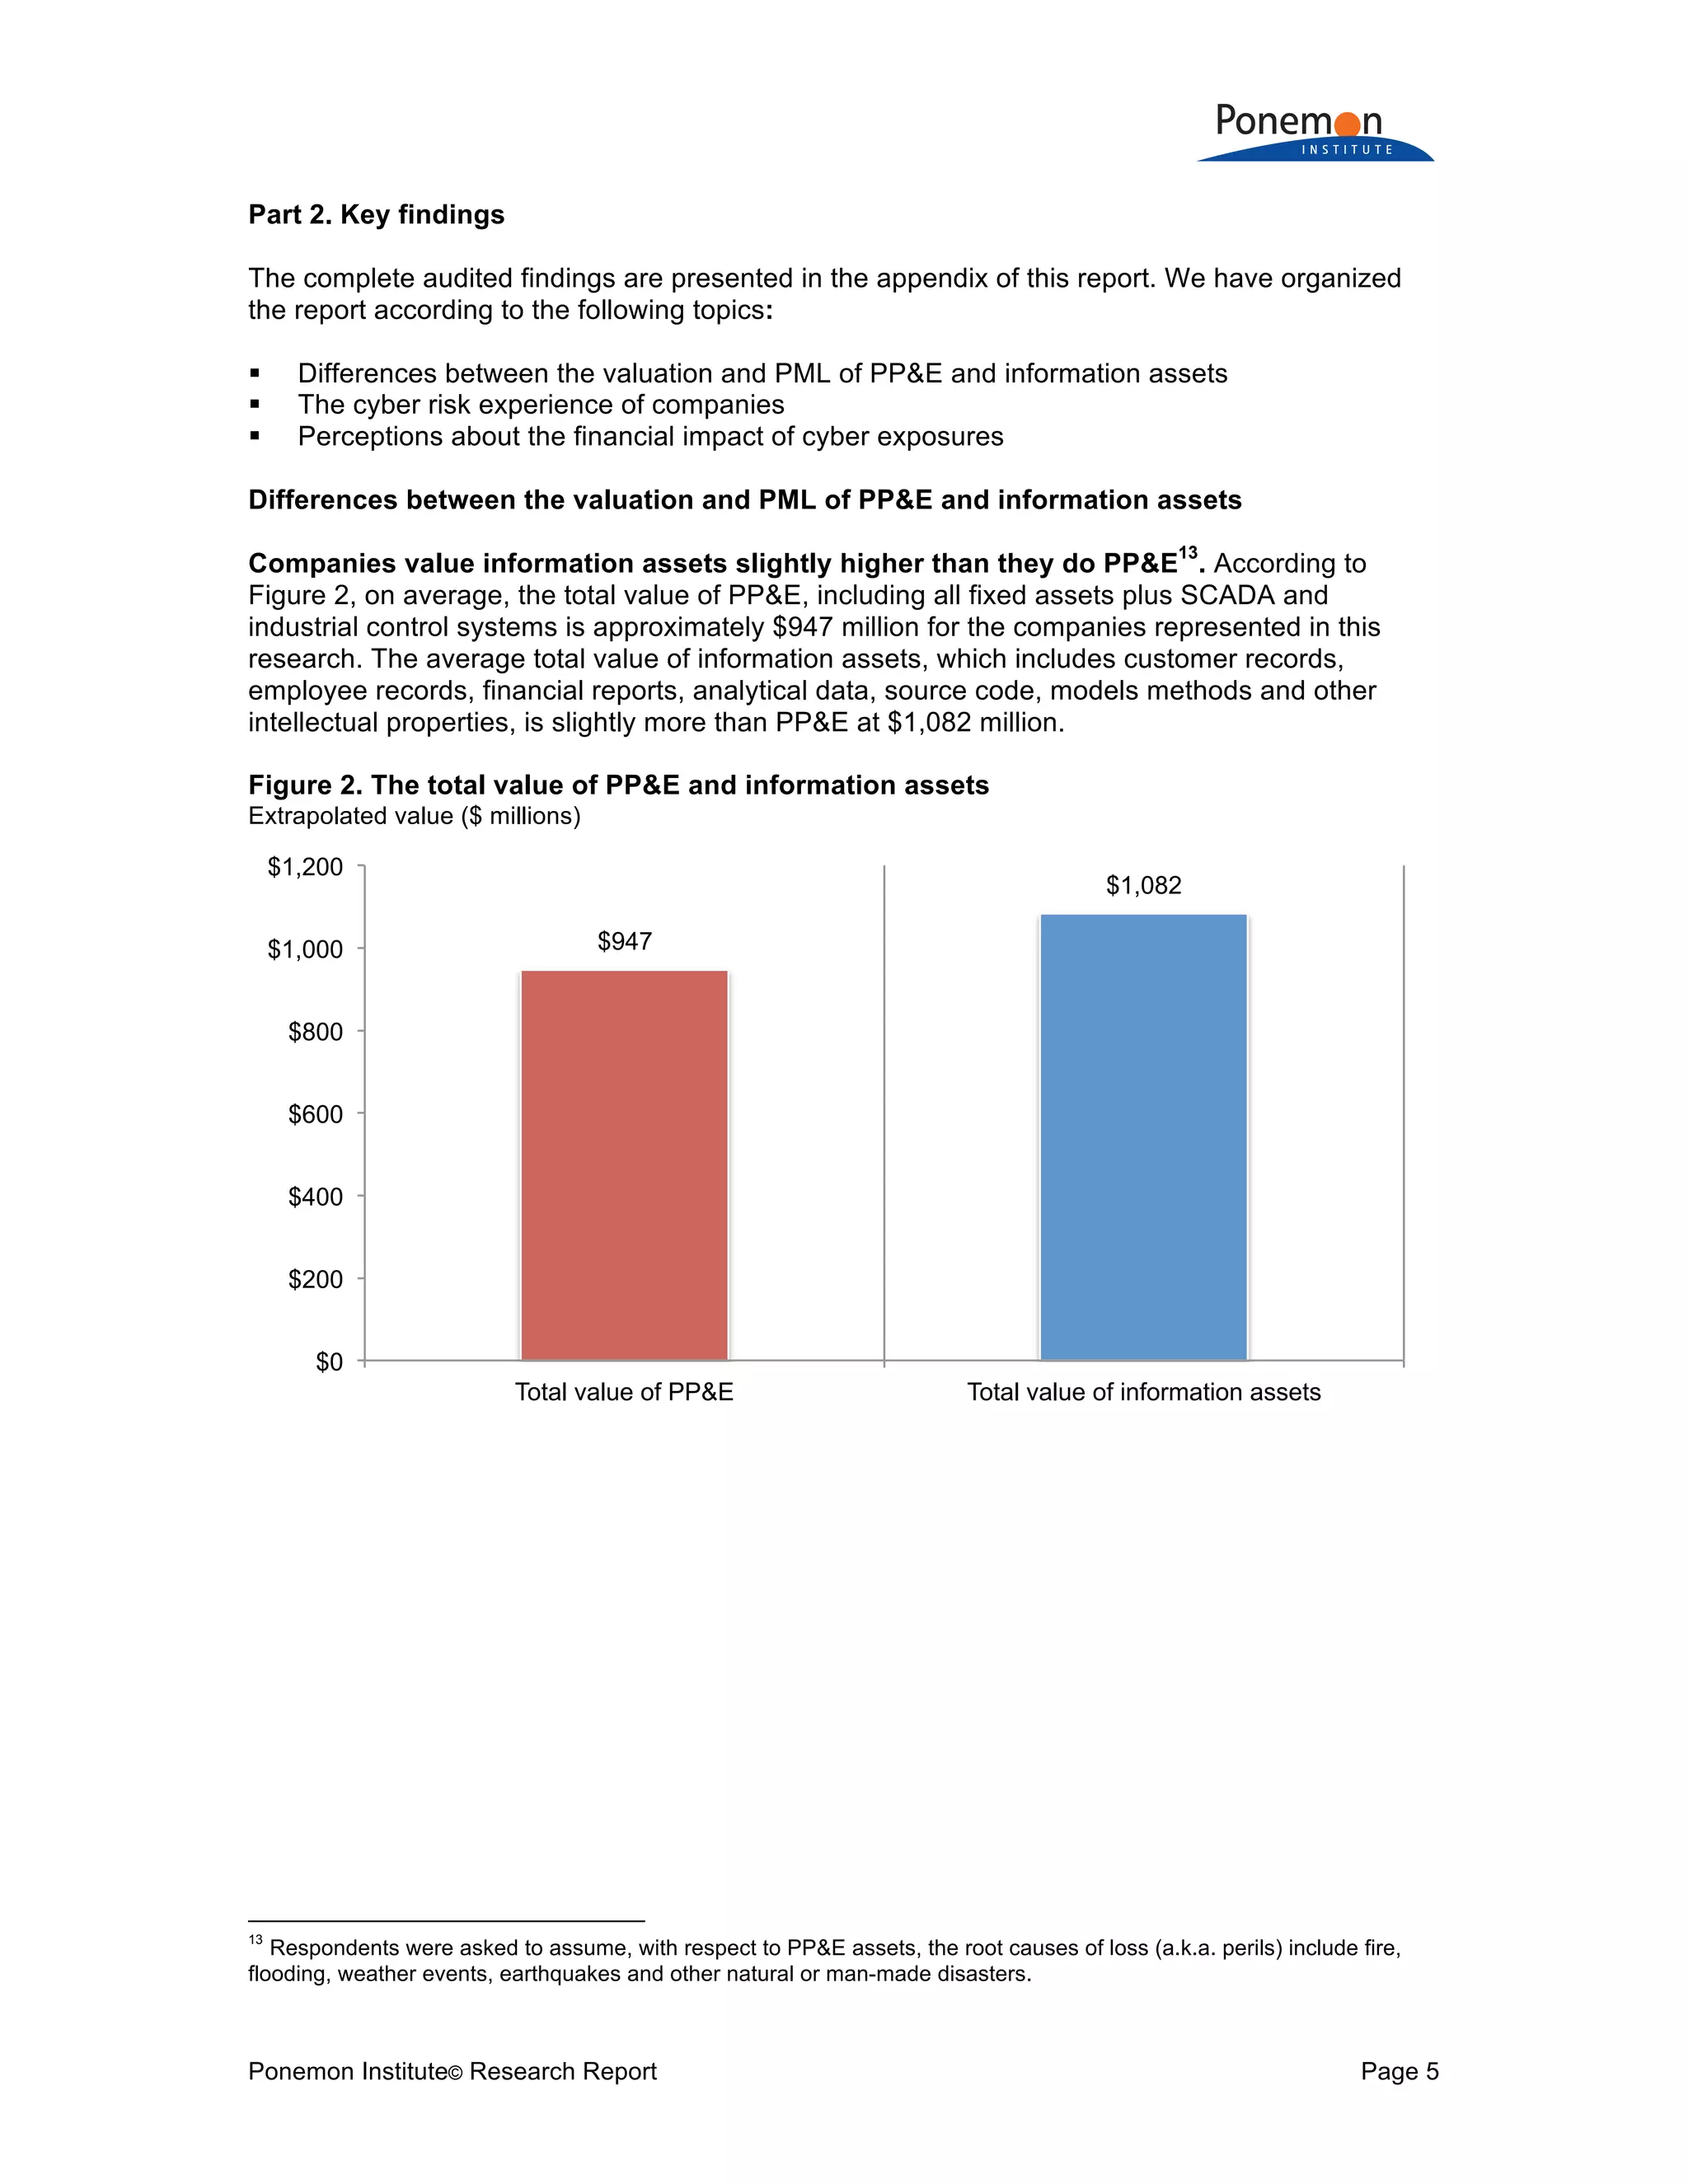
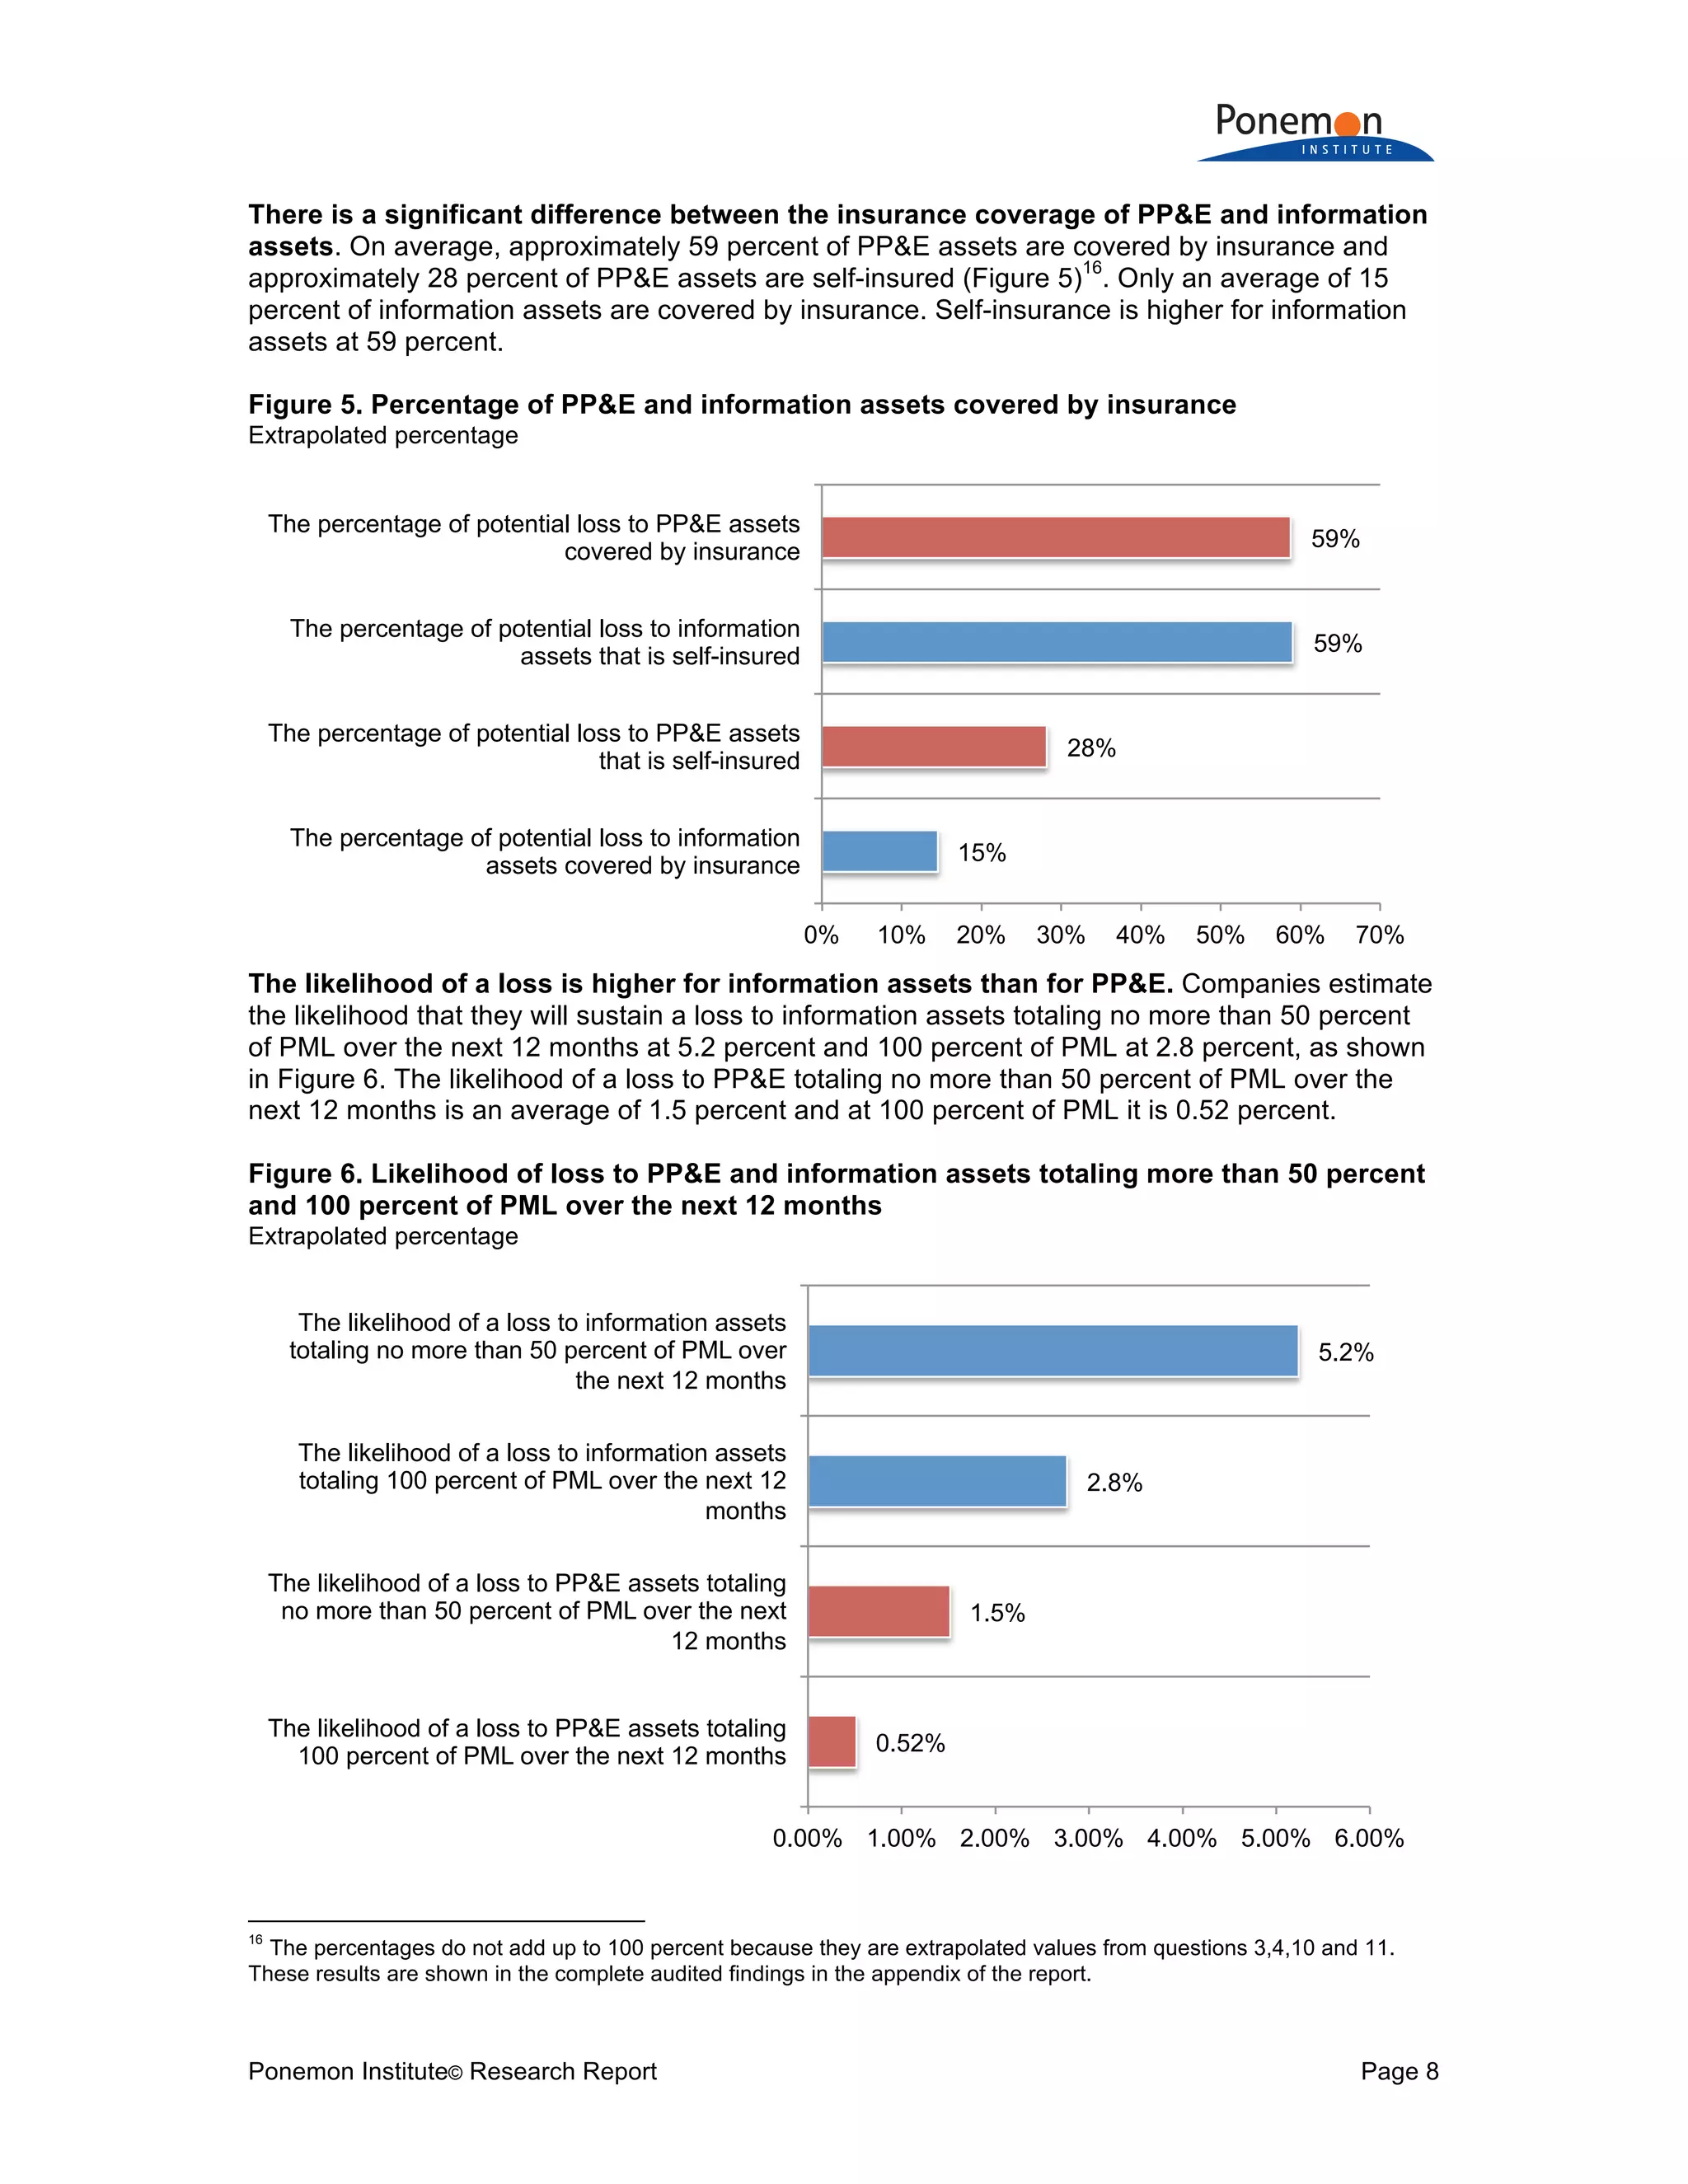
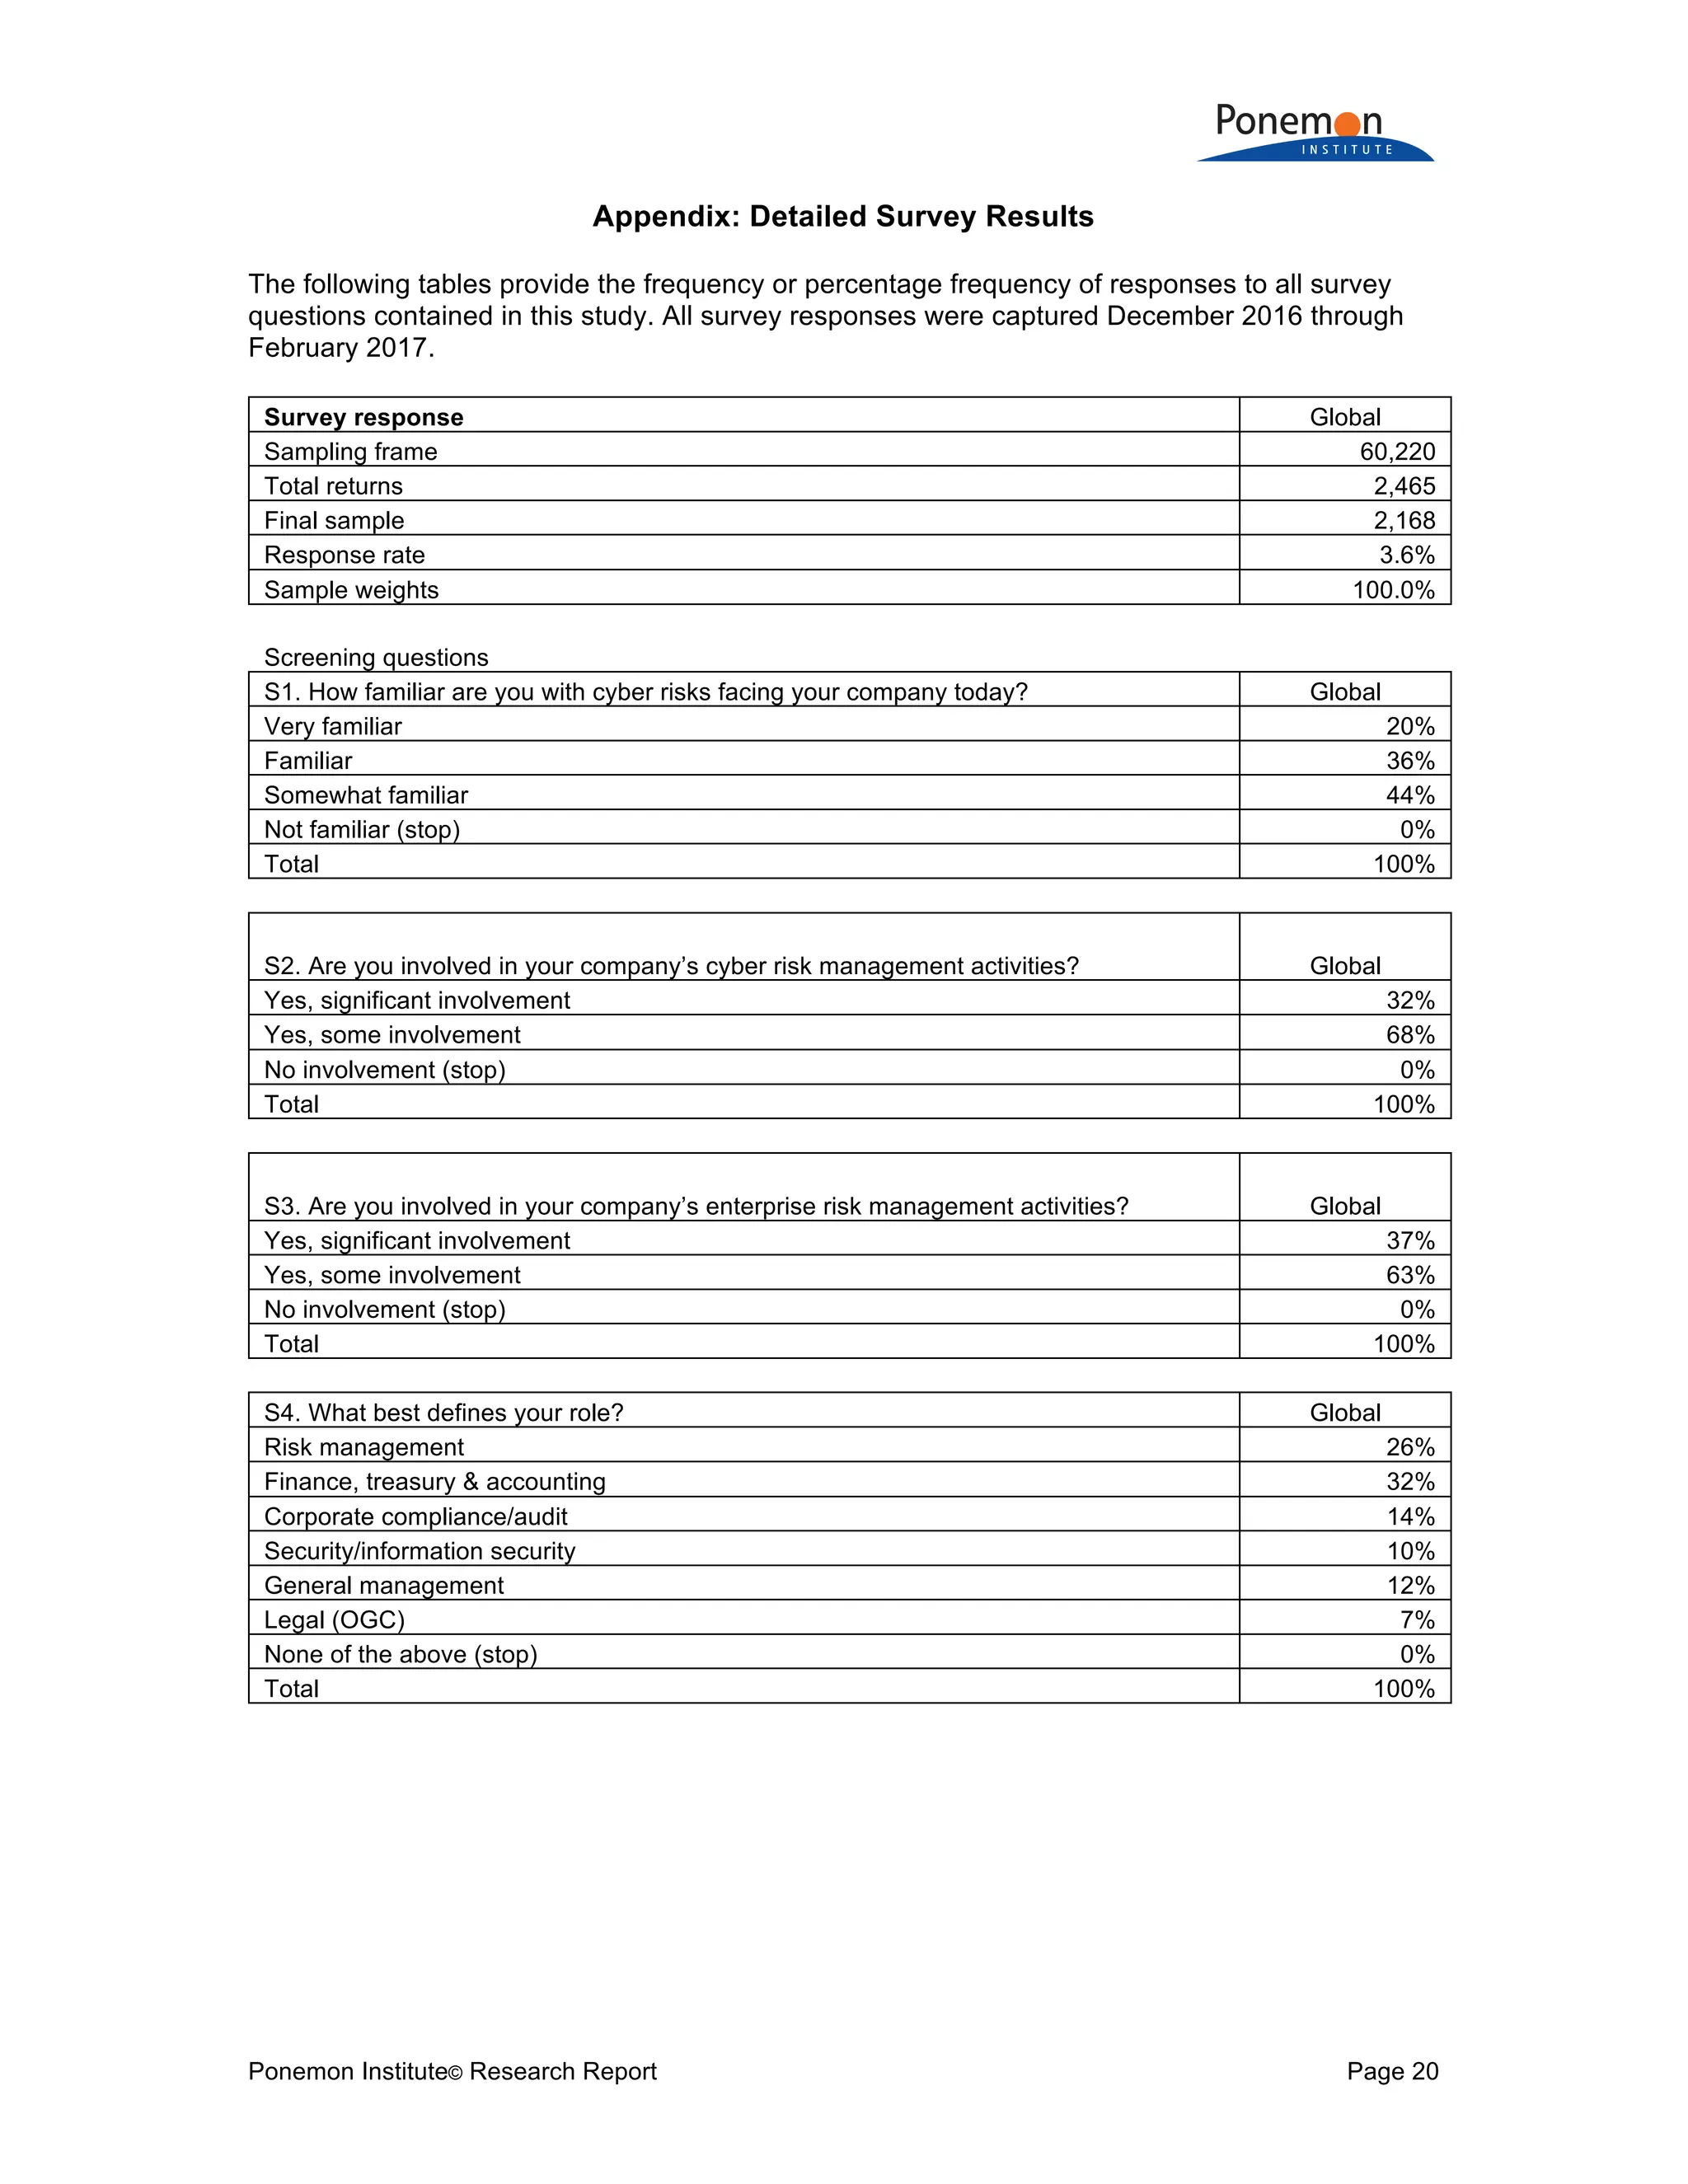
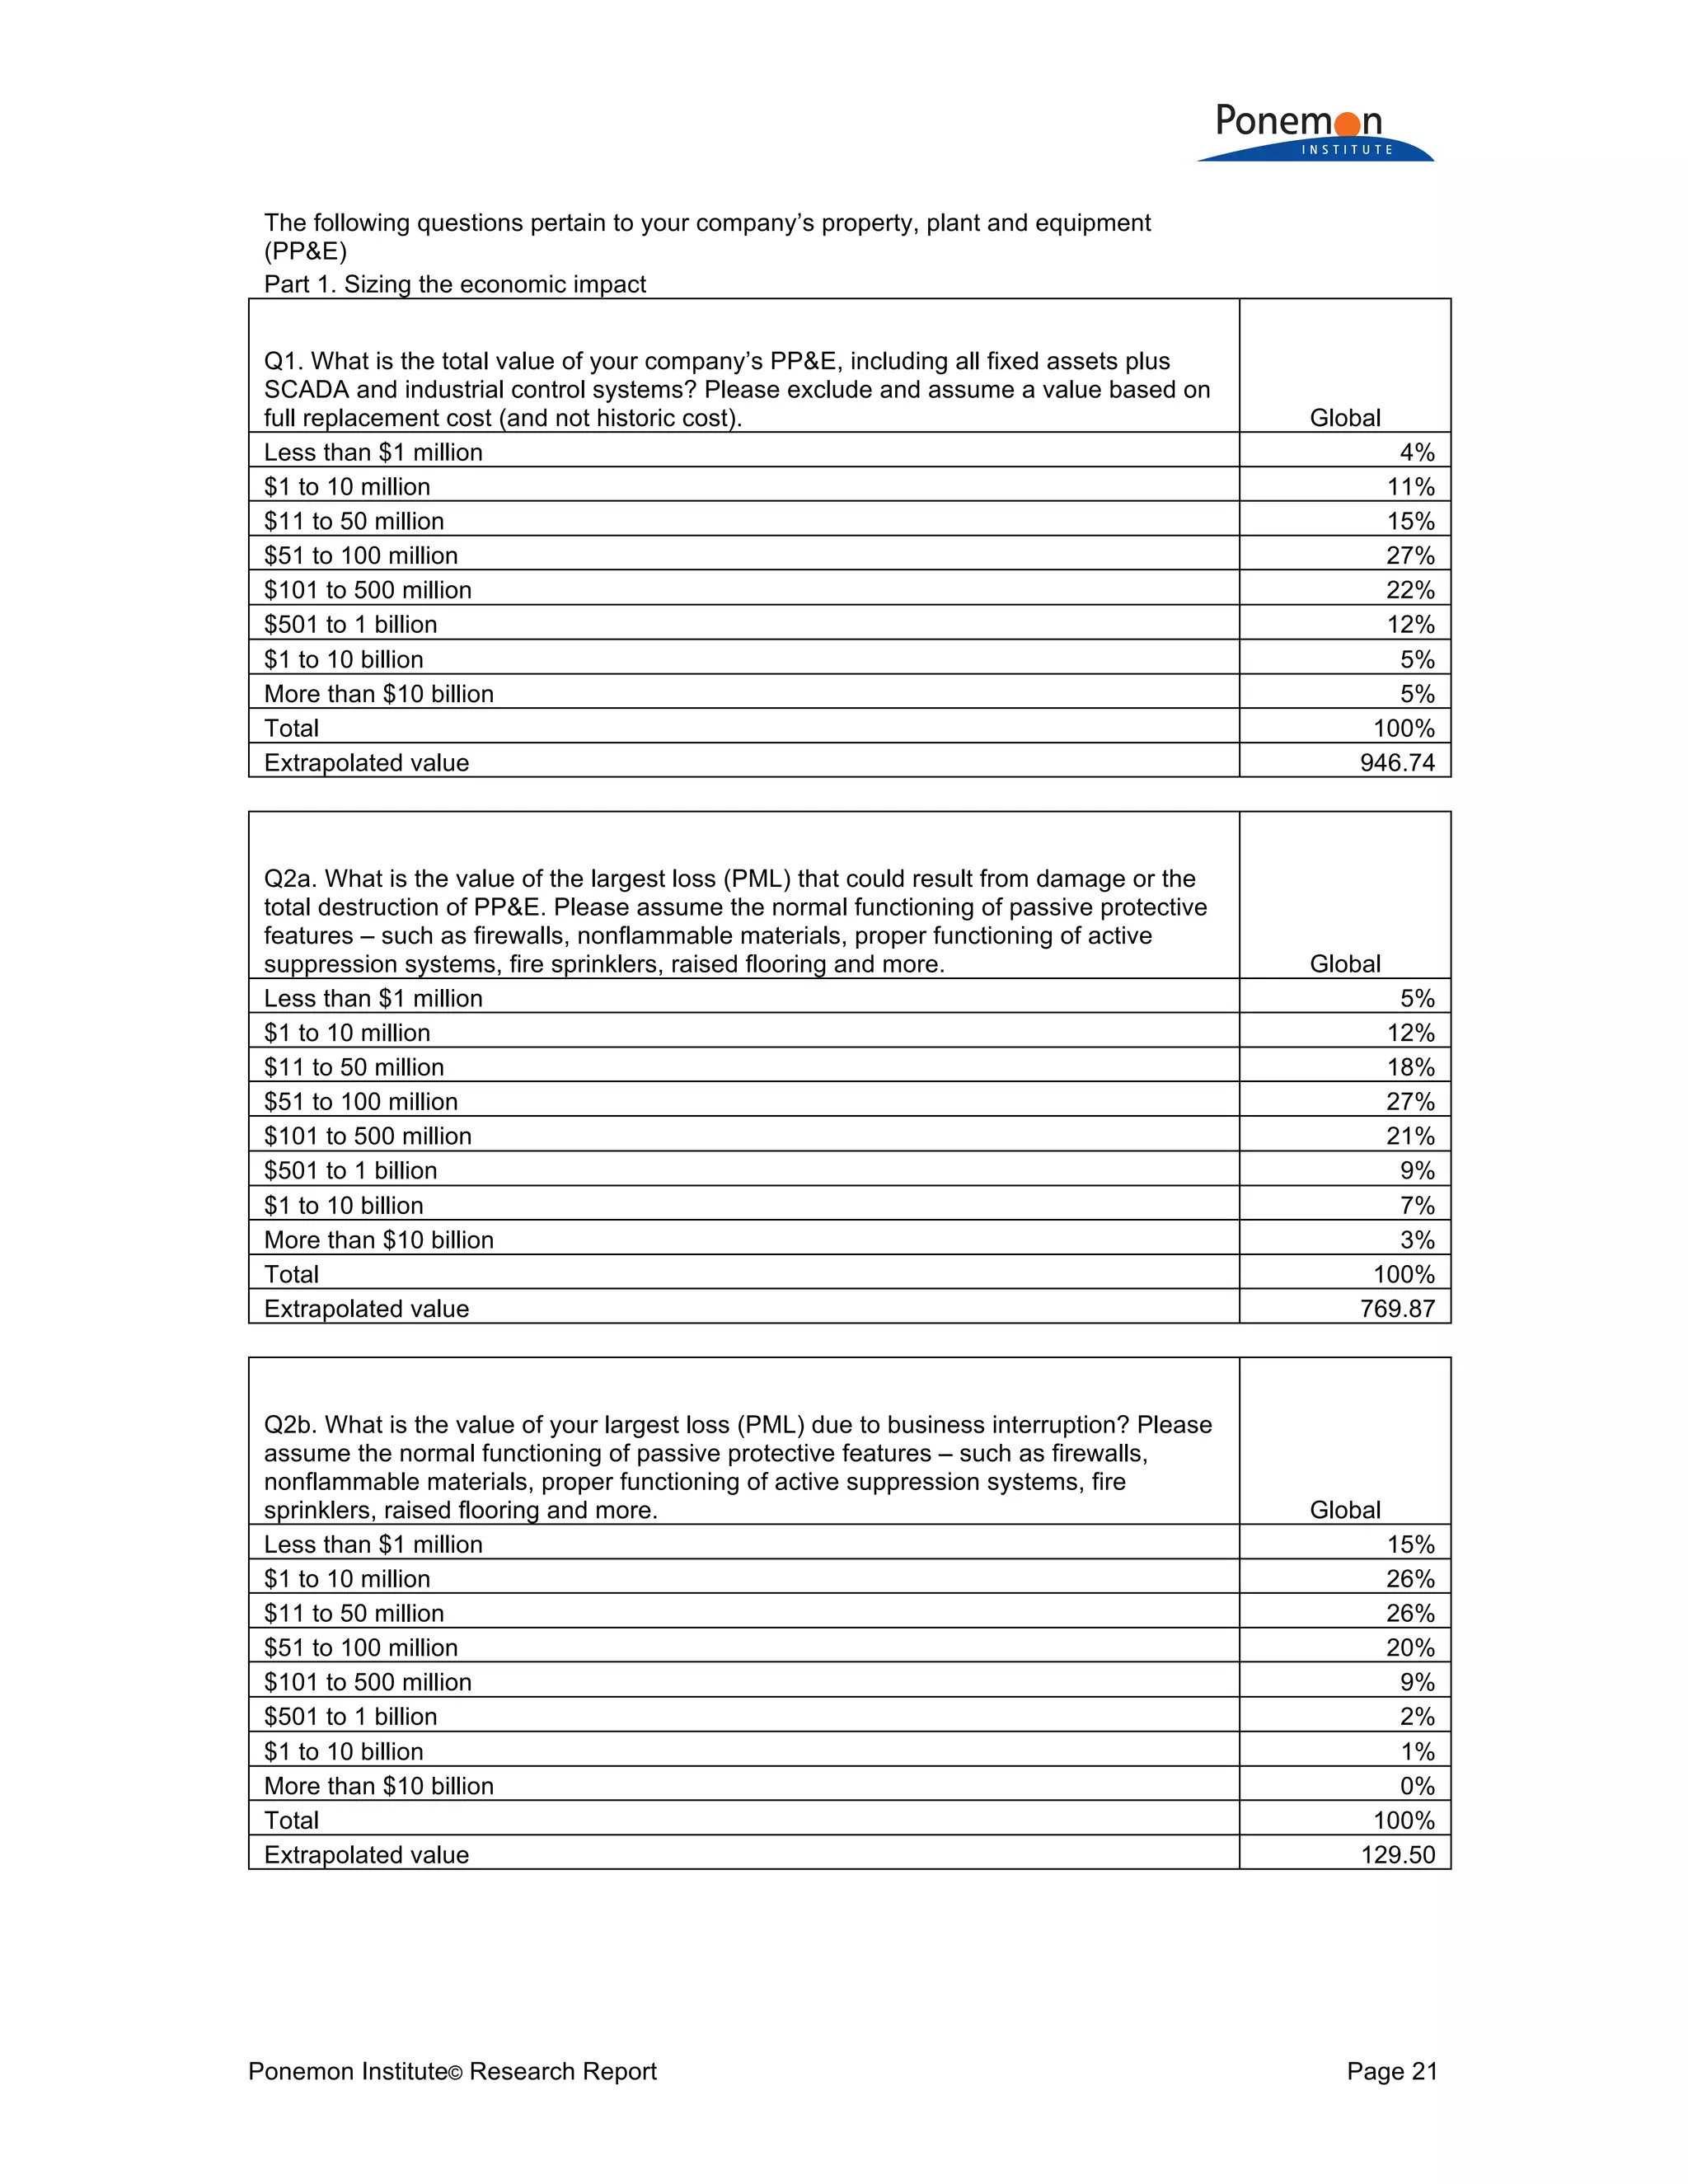
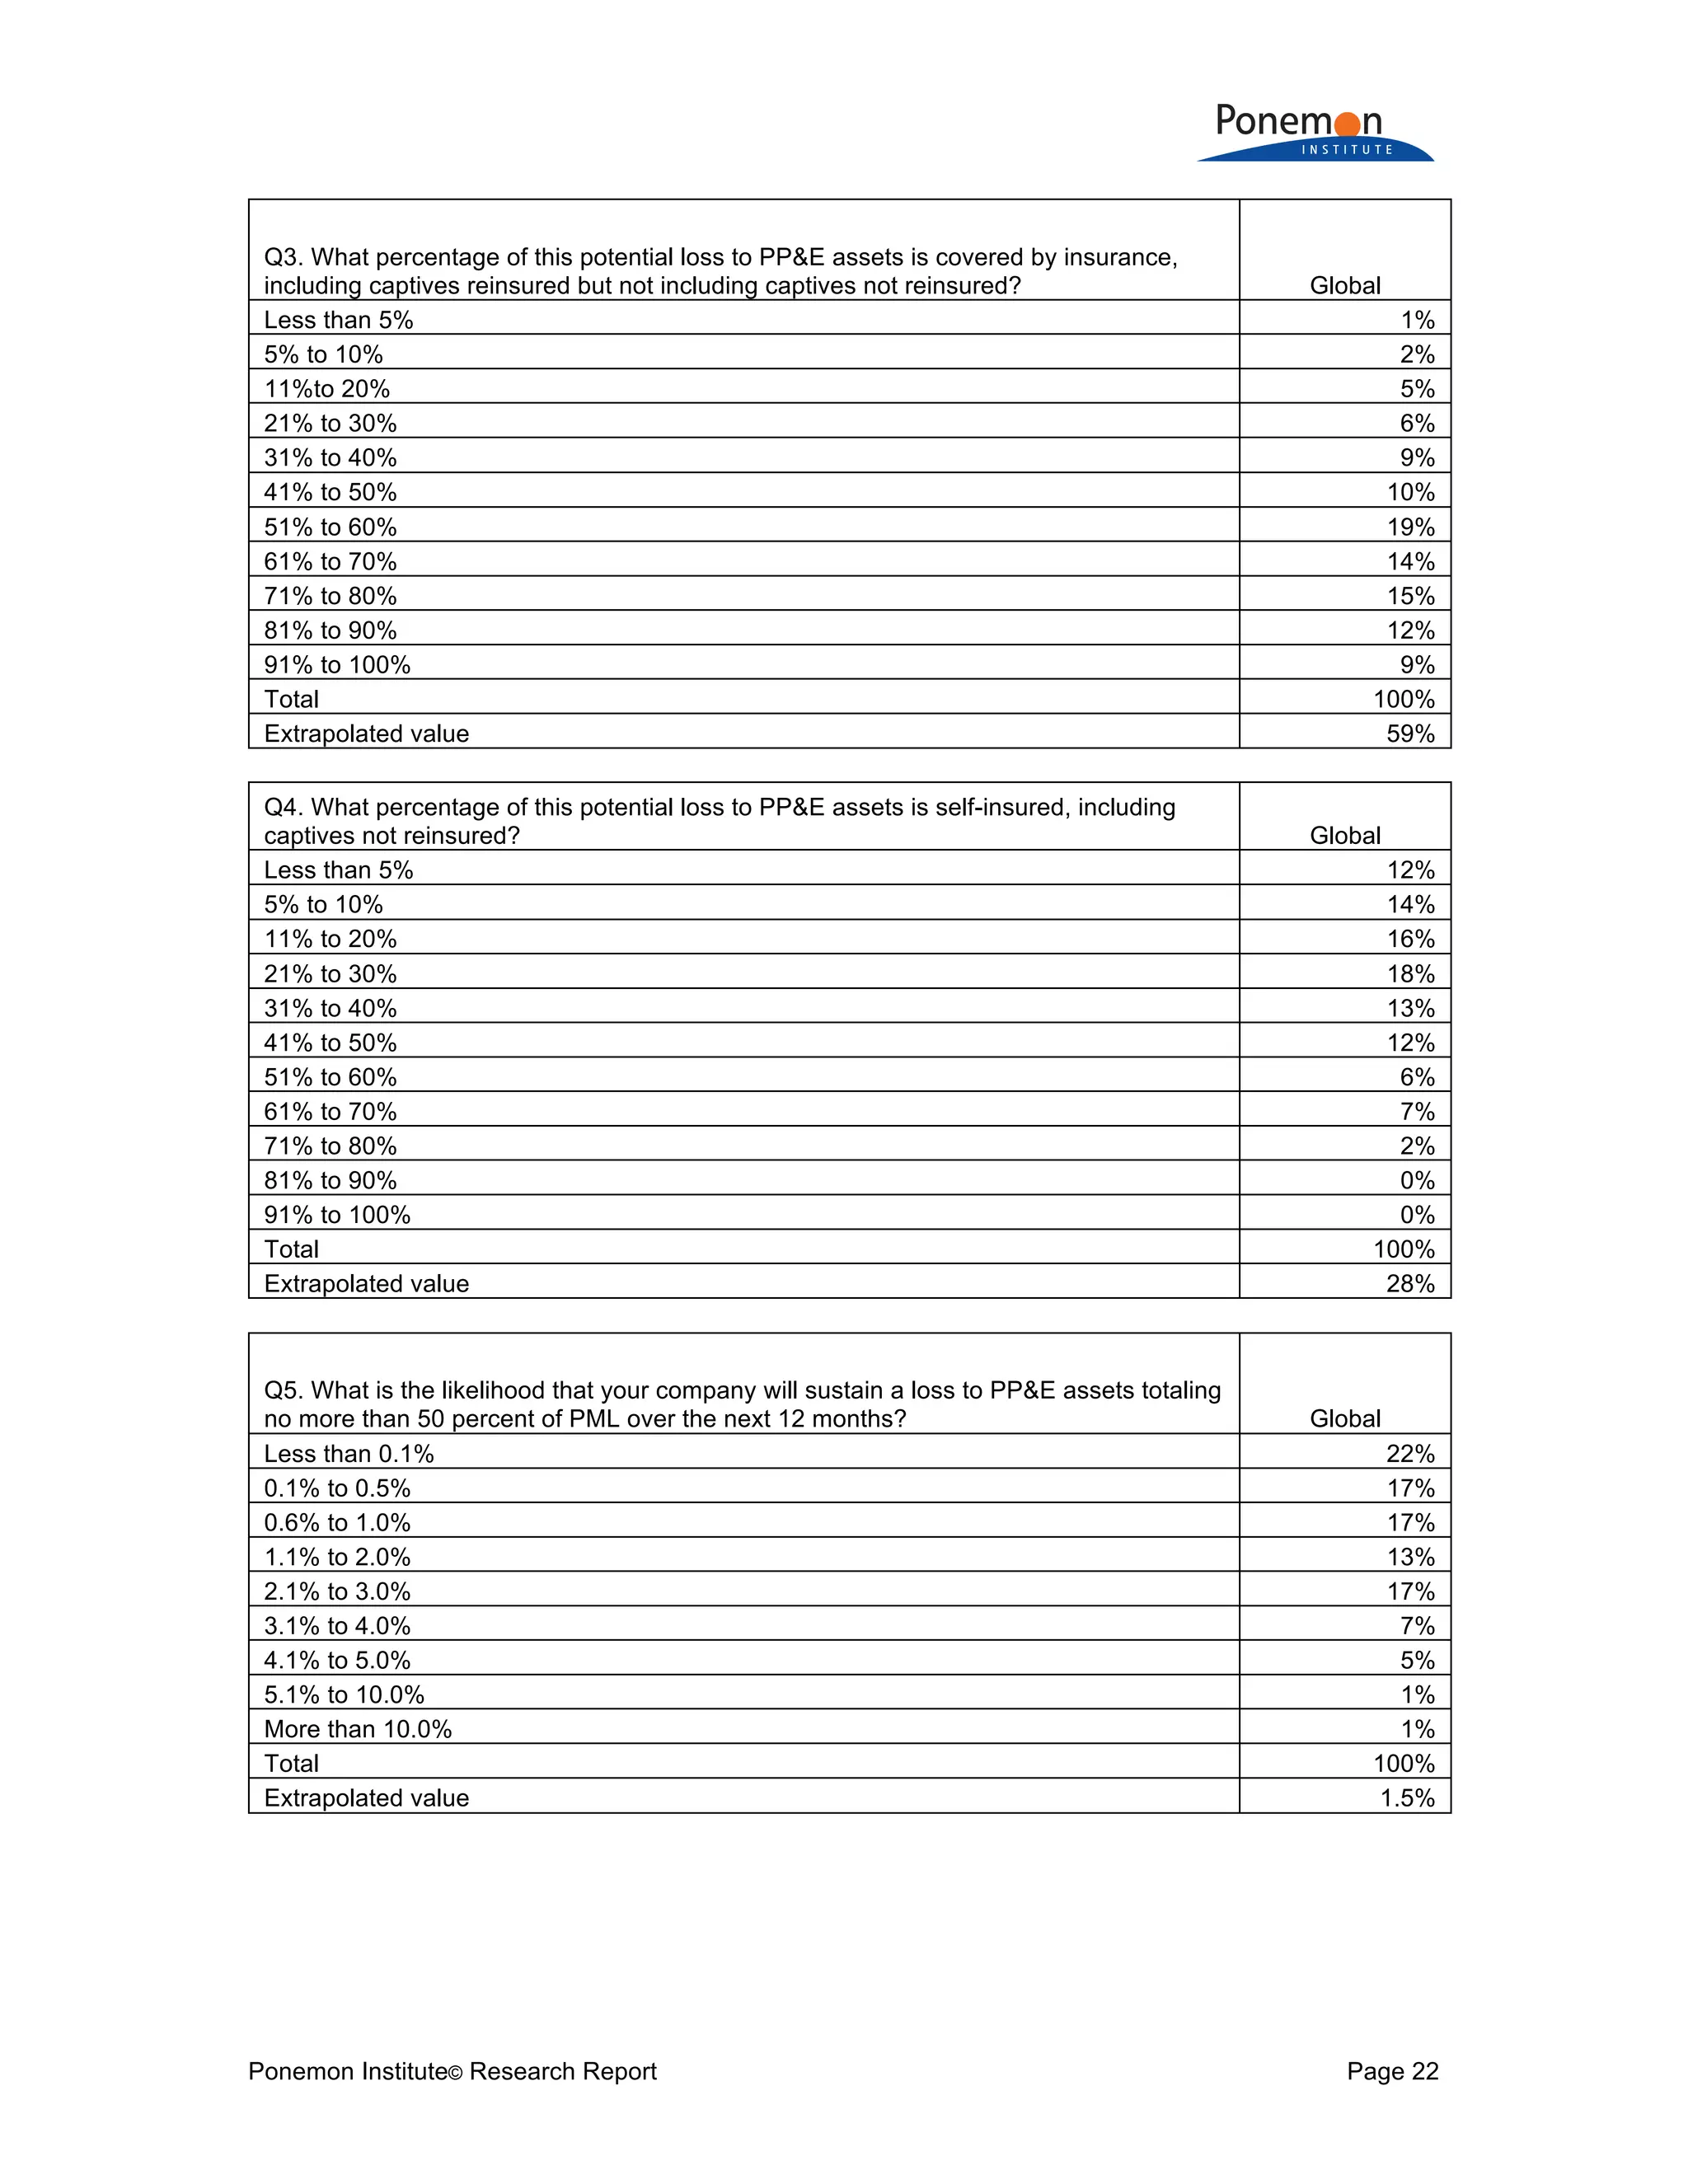
1) Information assets are valued slightly higher on average ($1.082 billion) than tangible property, plant, and equipment ($947 million) but have much lower insurance coverage (15% vs 59%).
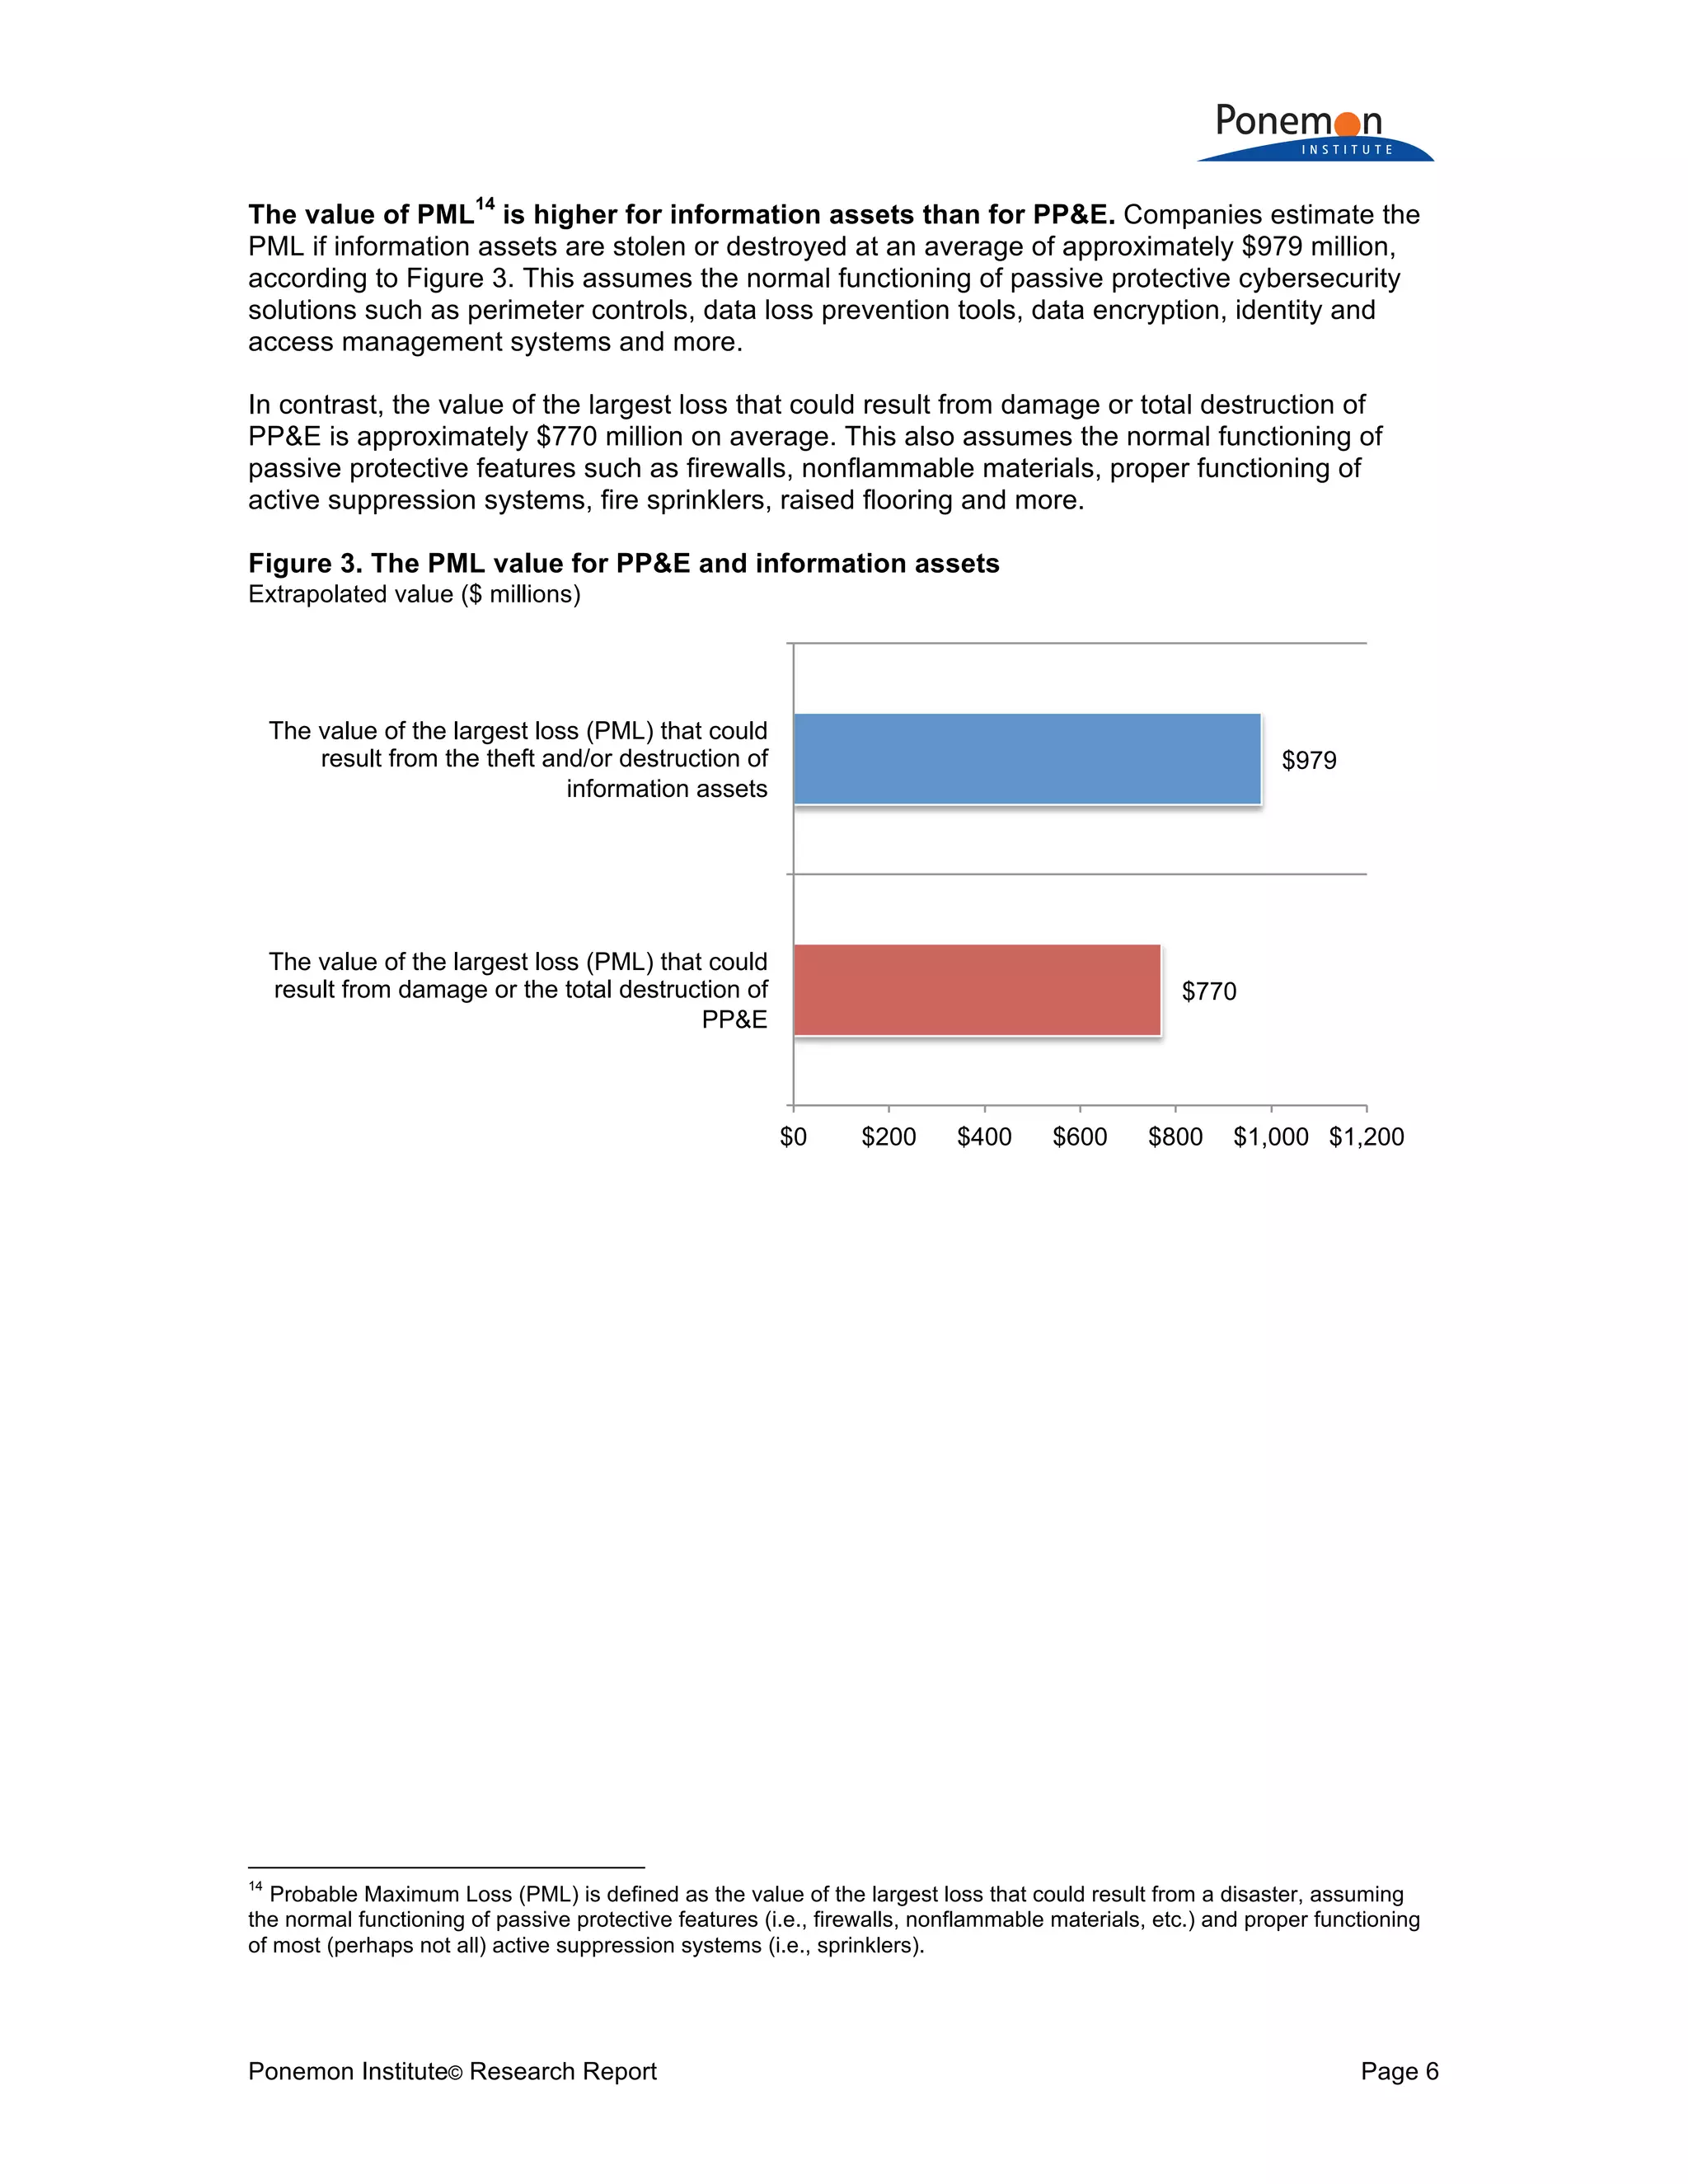
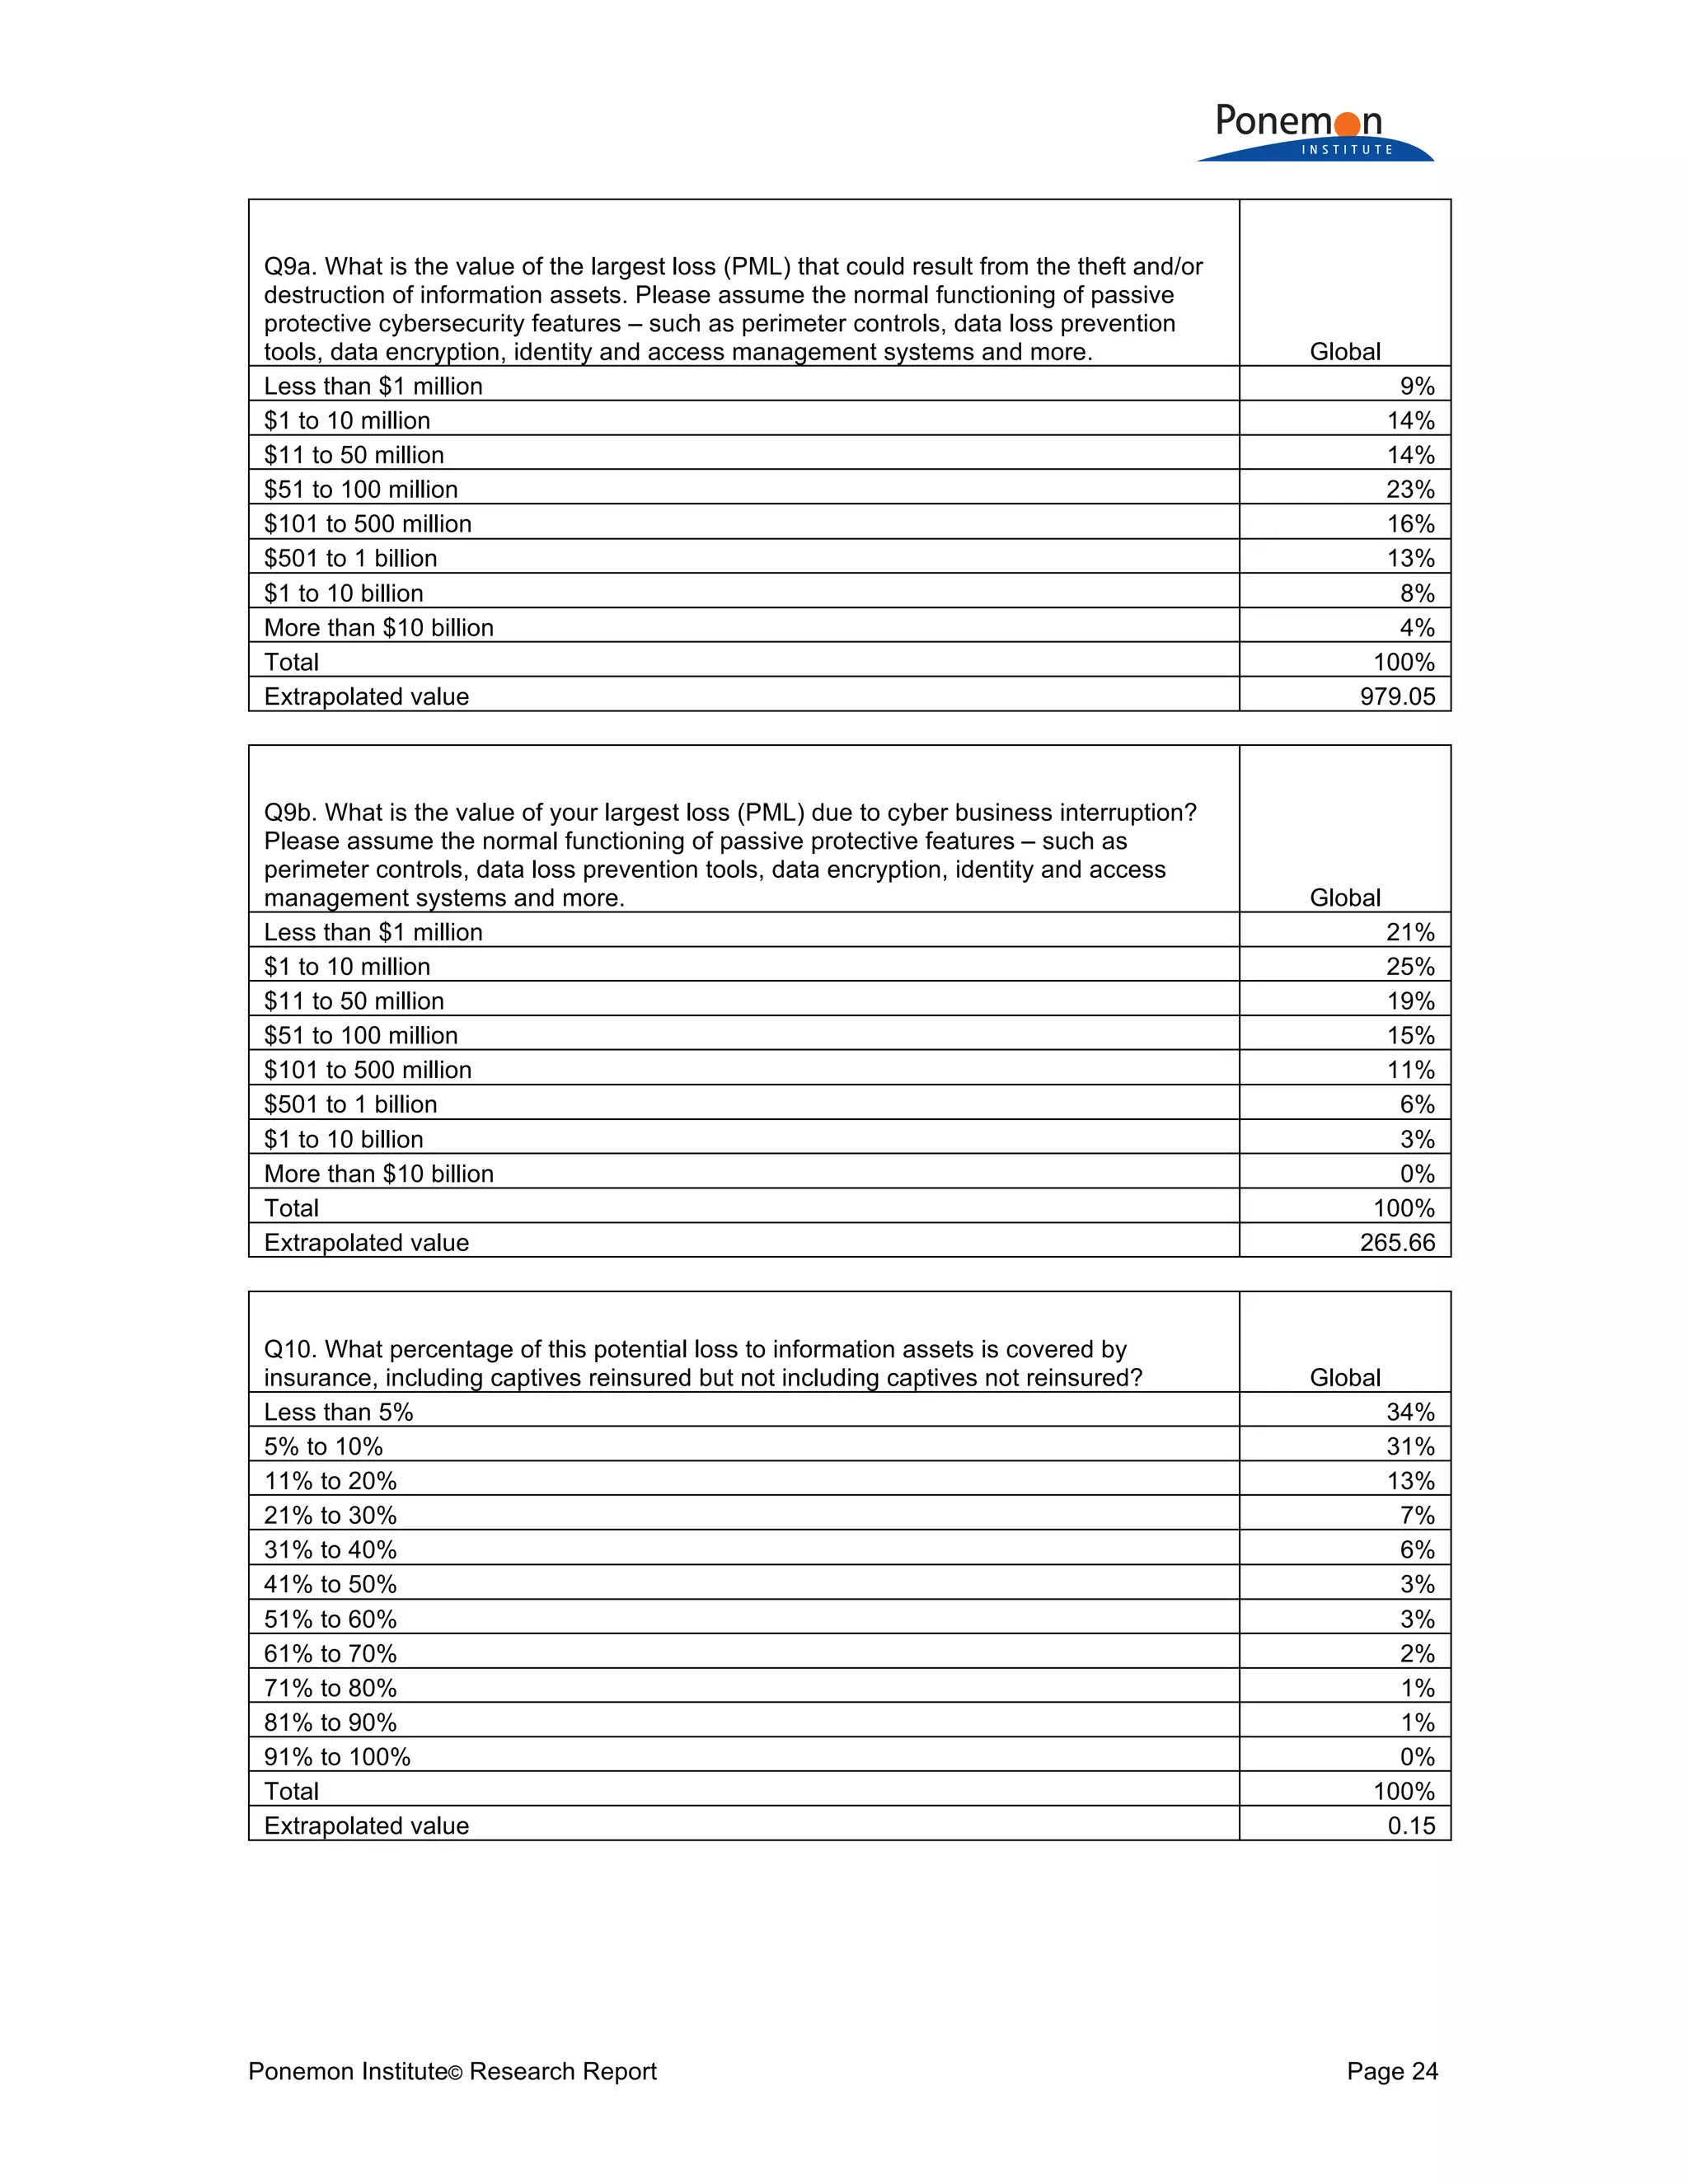
2) The potential maximum loss from information assets being stolen or destroyed is estimated to be higher on average ($979 million) than potential losses from tangible assets ($770 million).
3) Despite higher risks and potential losses to information assets, companies are reluctant to purchase cyber insurance and many would not disclose material losses of information assets in financial statements like they would for tangible assets.
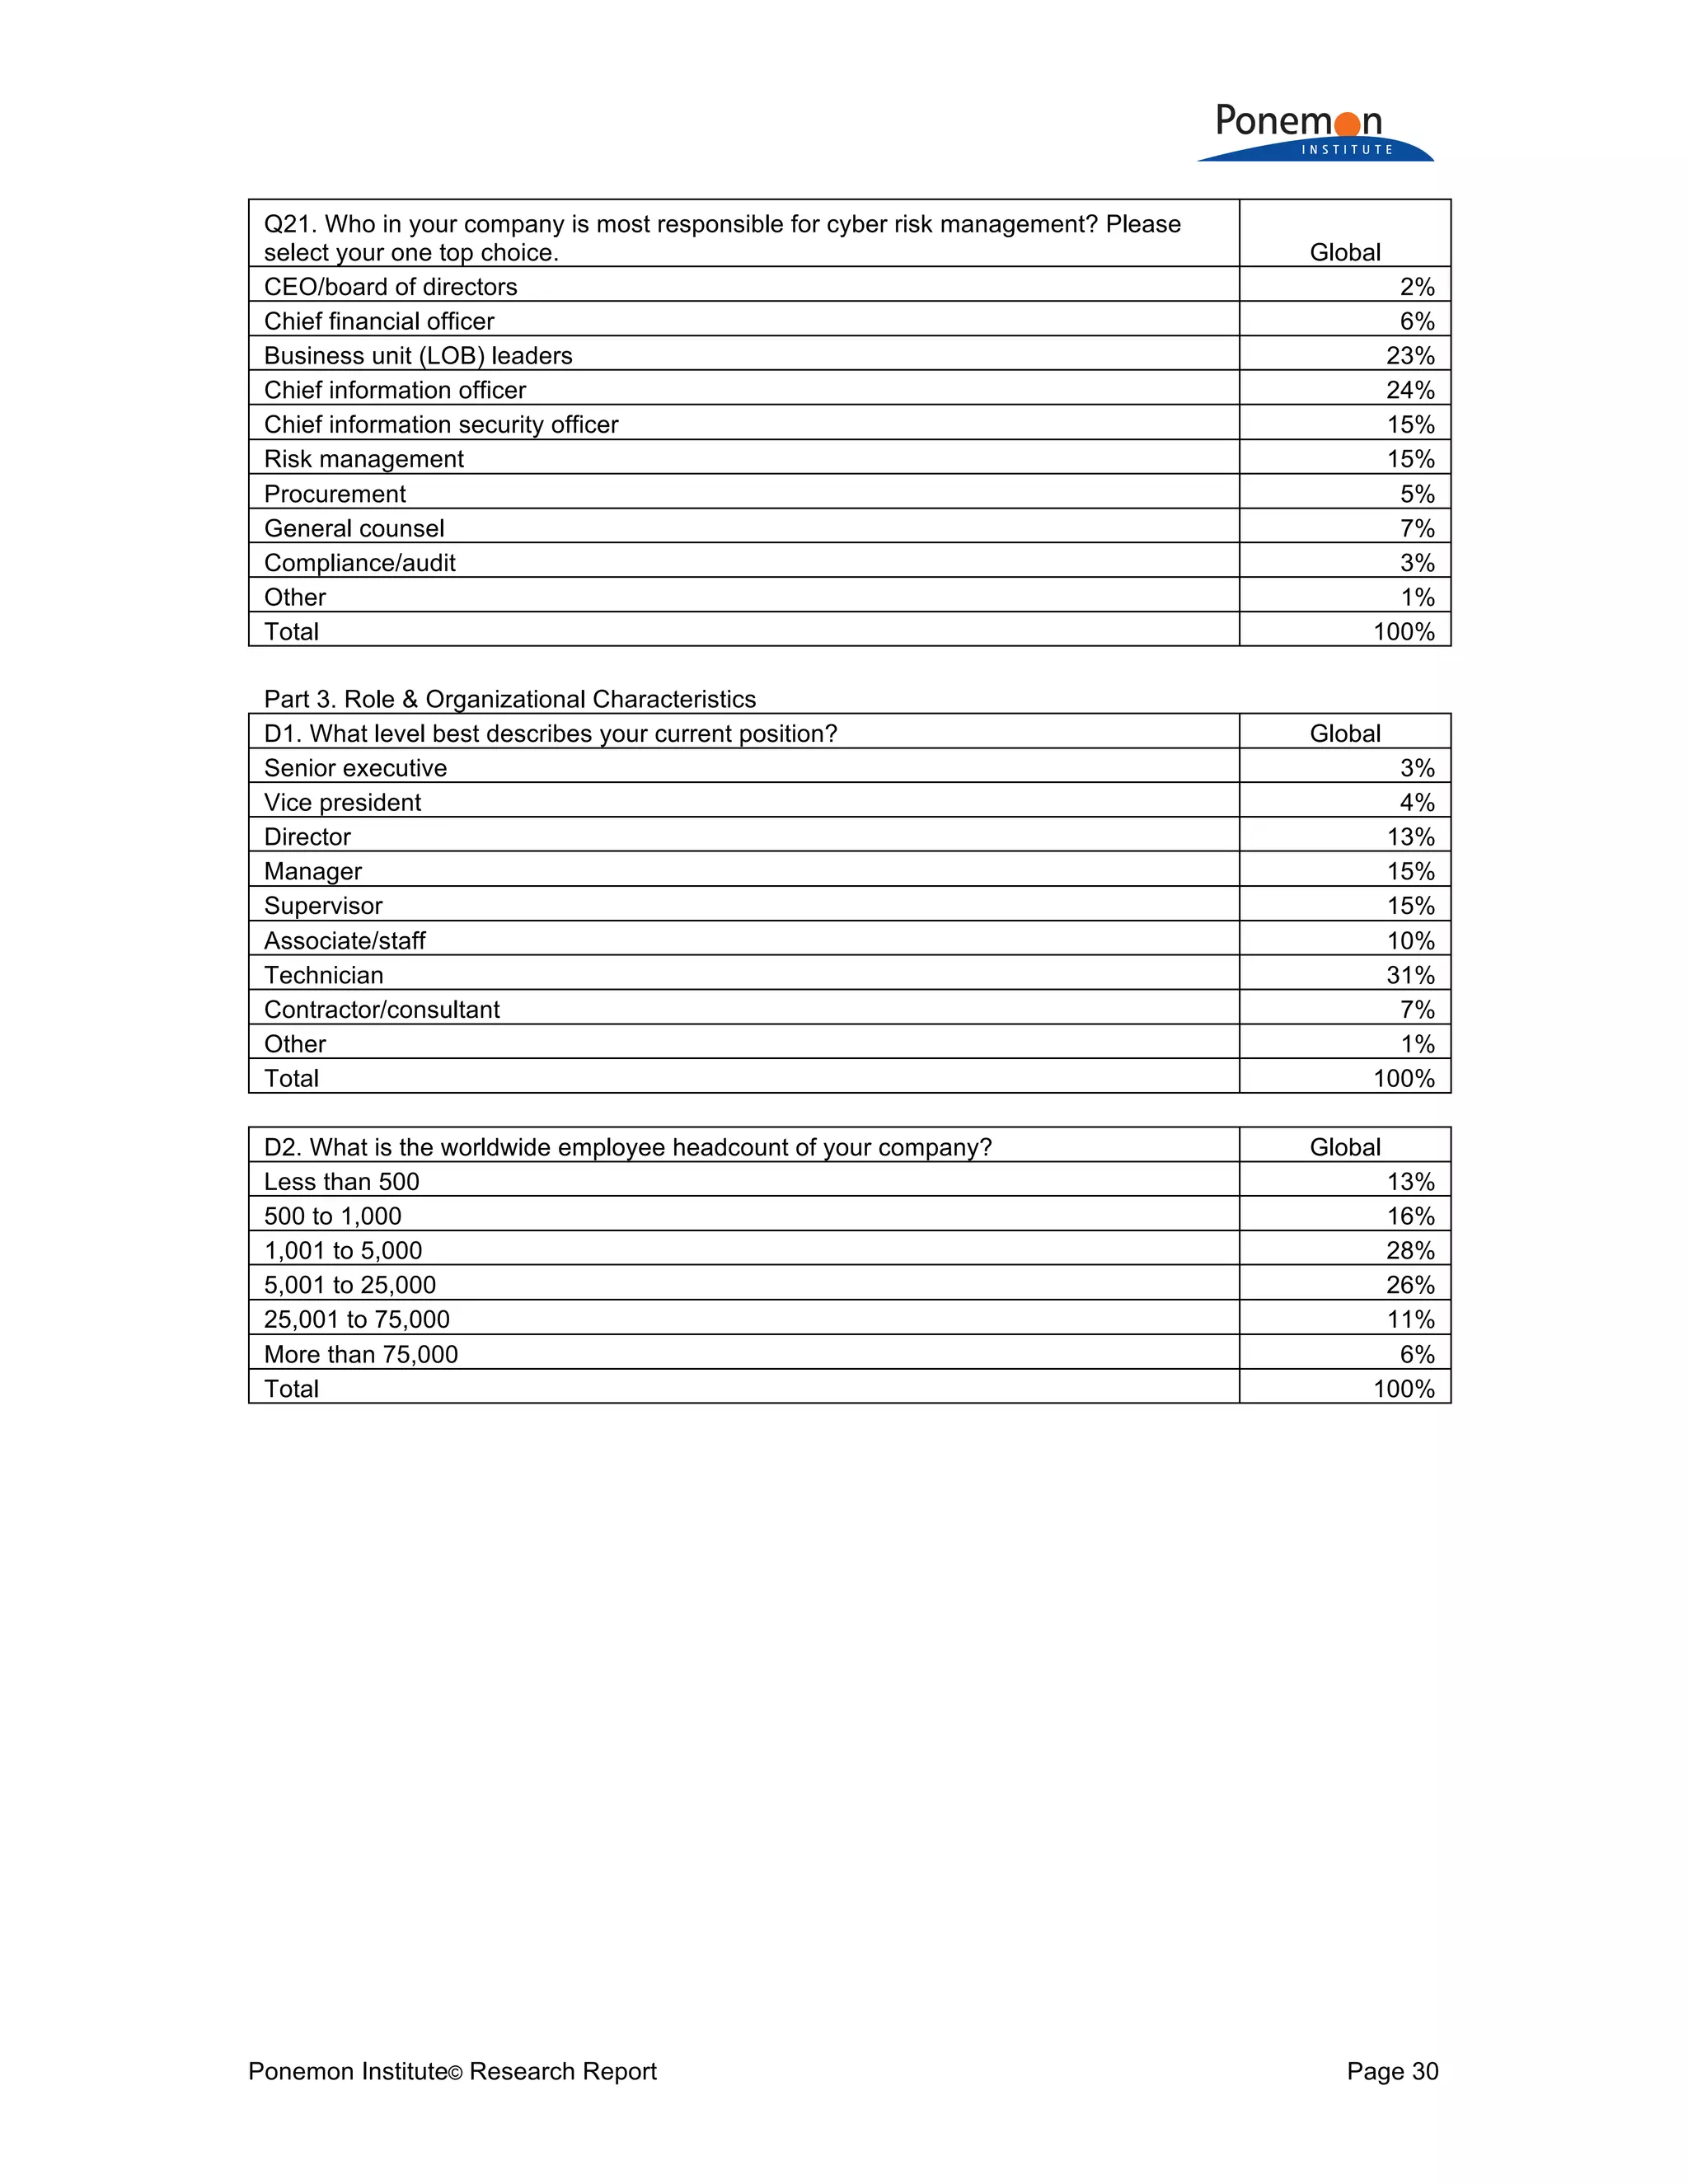
![Ponemon Institute© Research Report Page 26
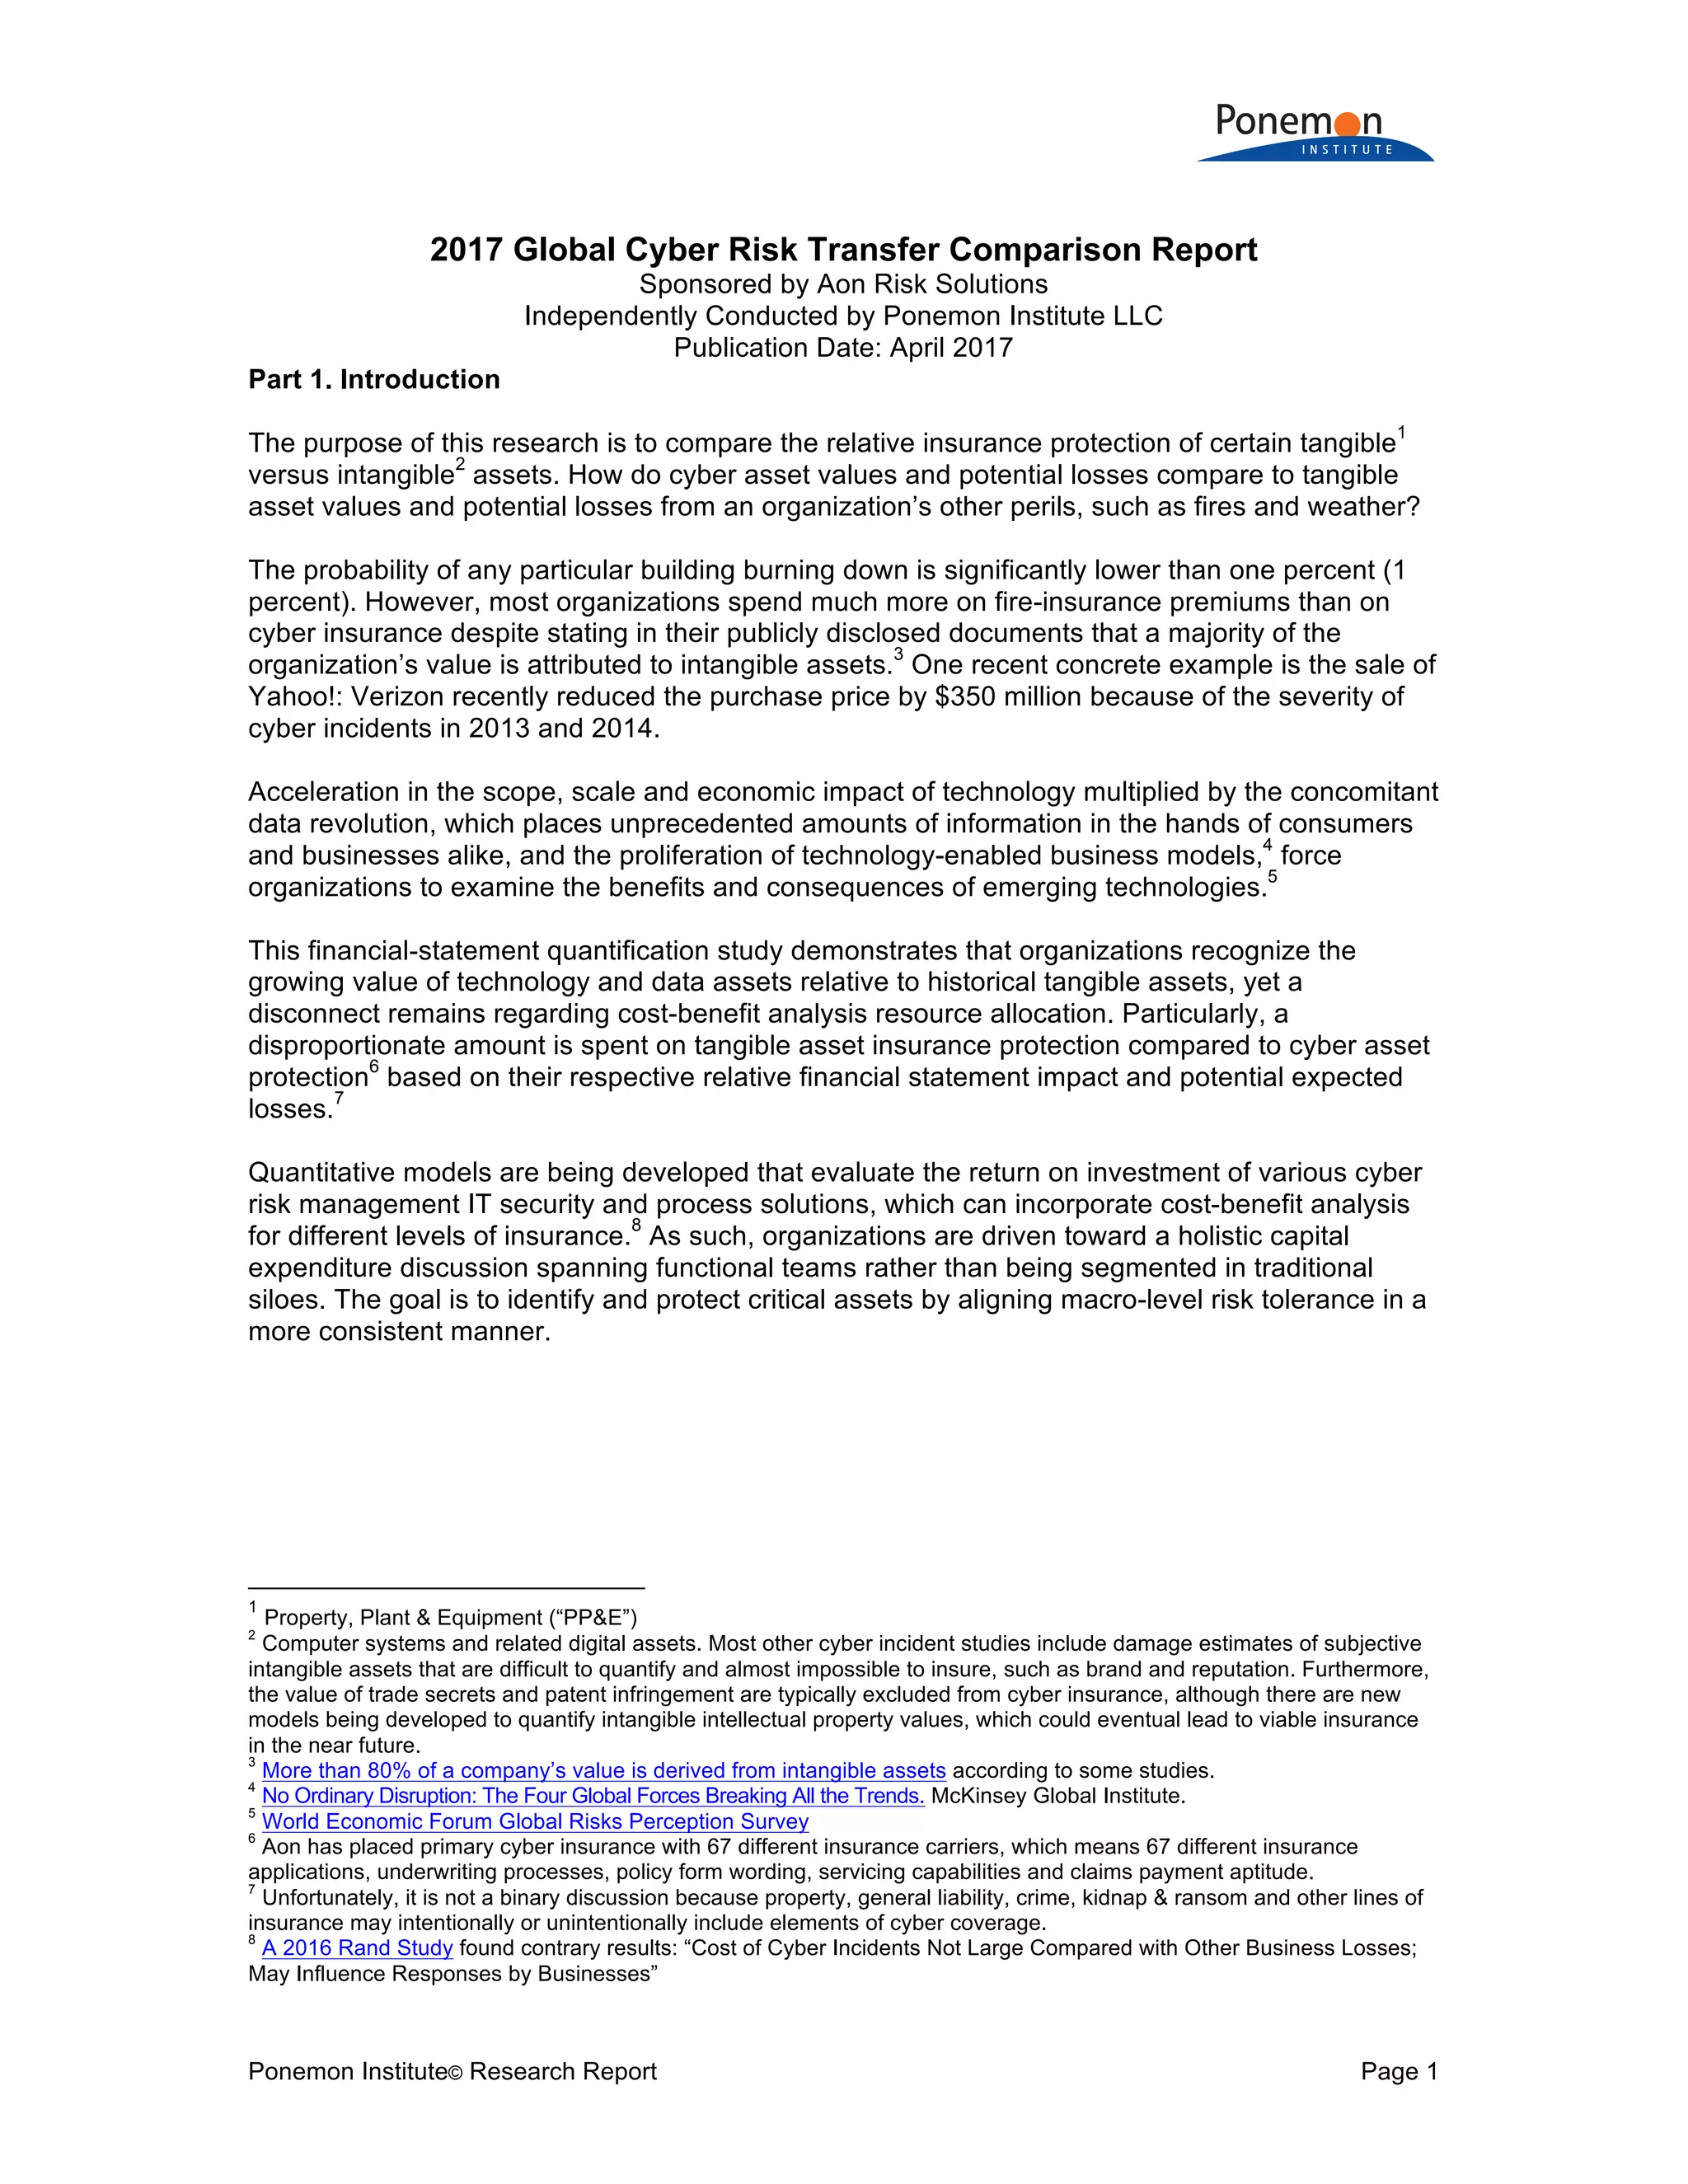
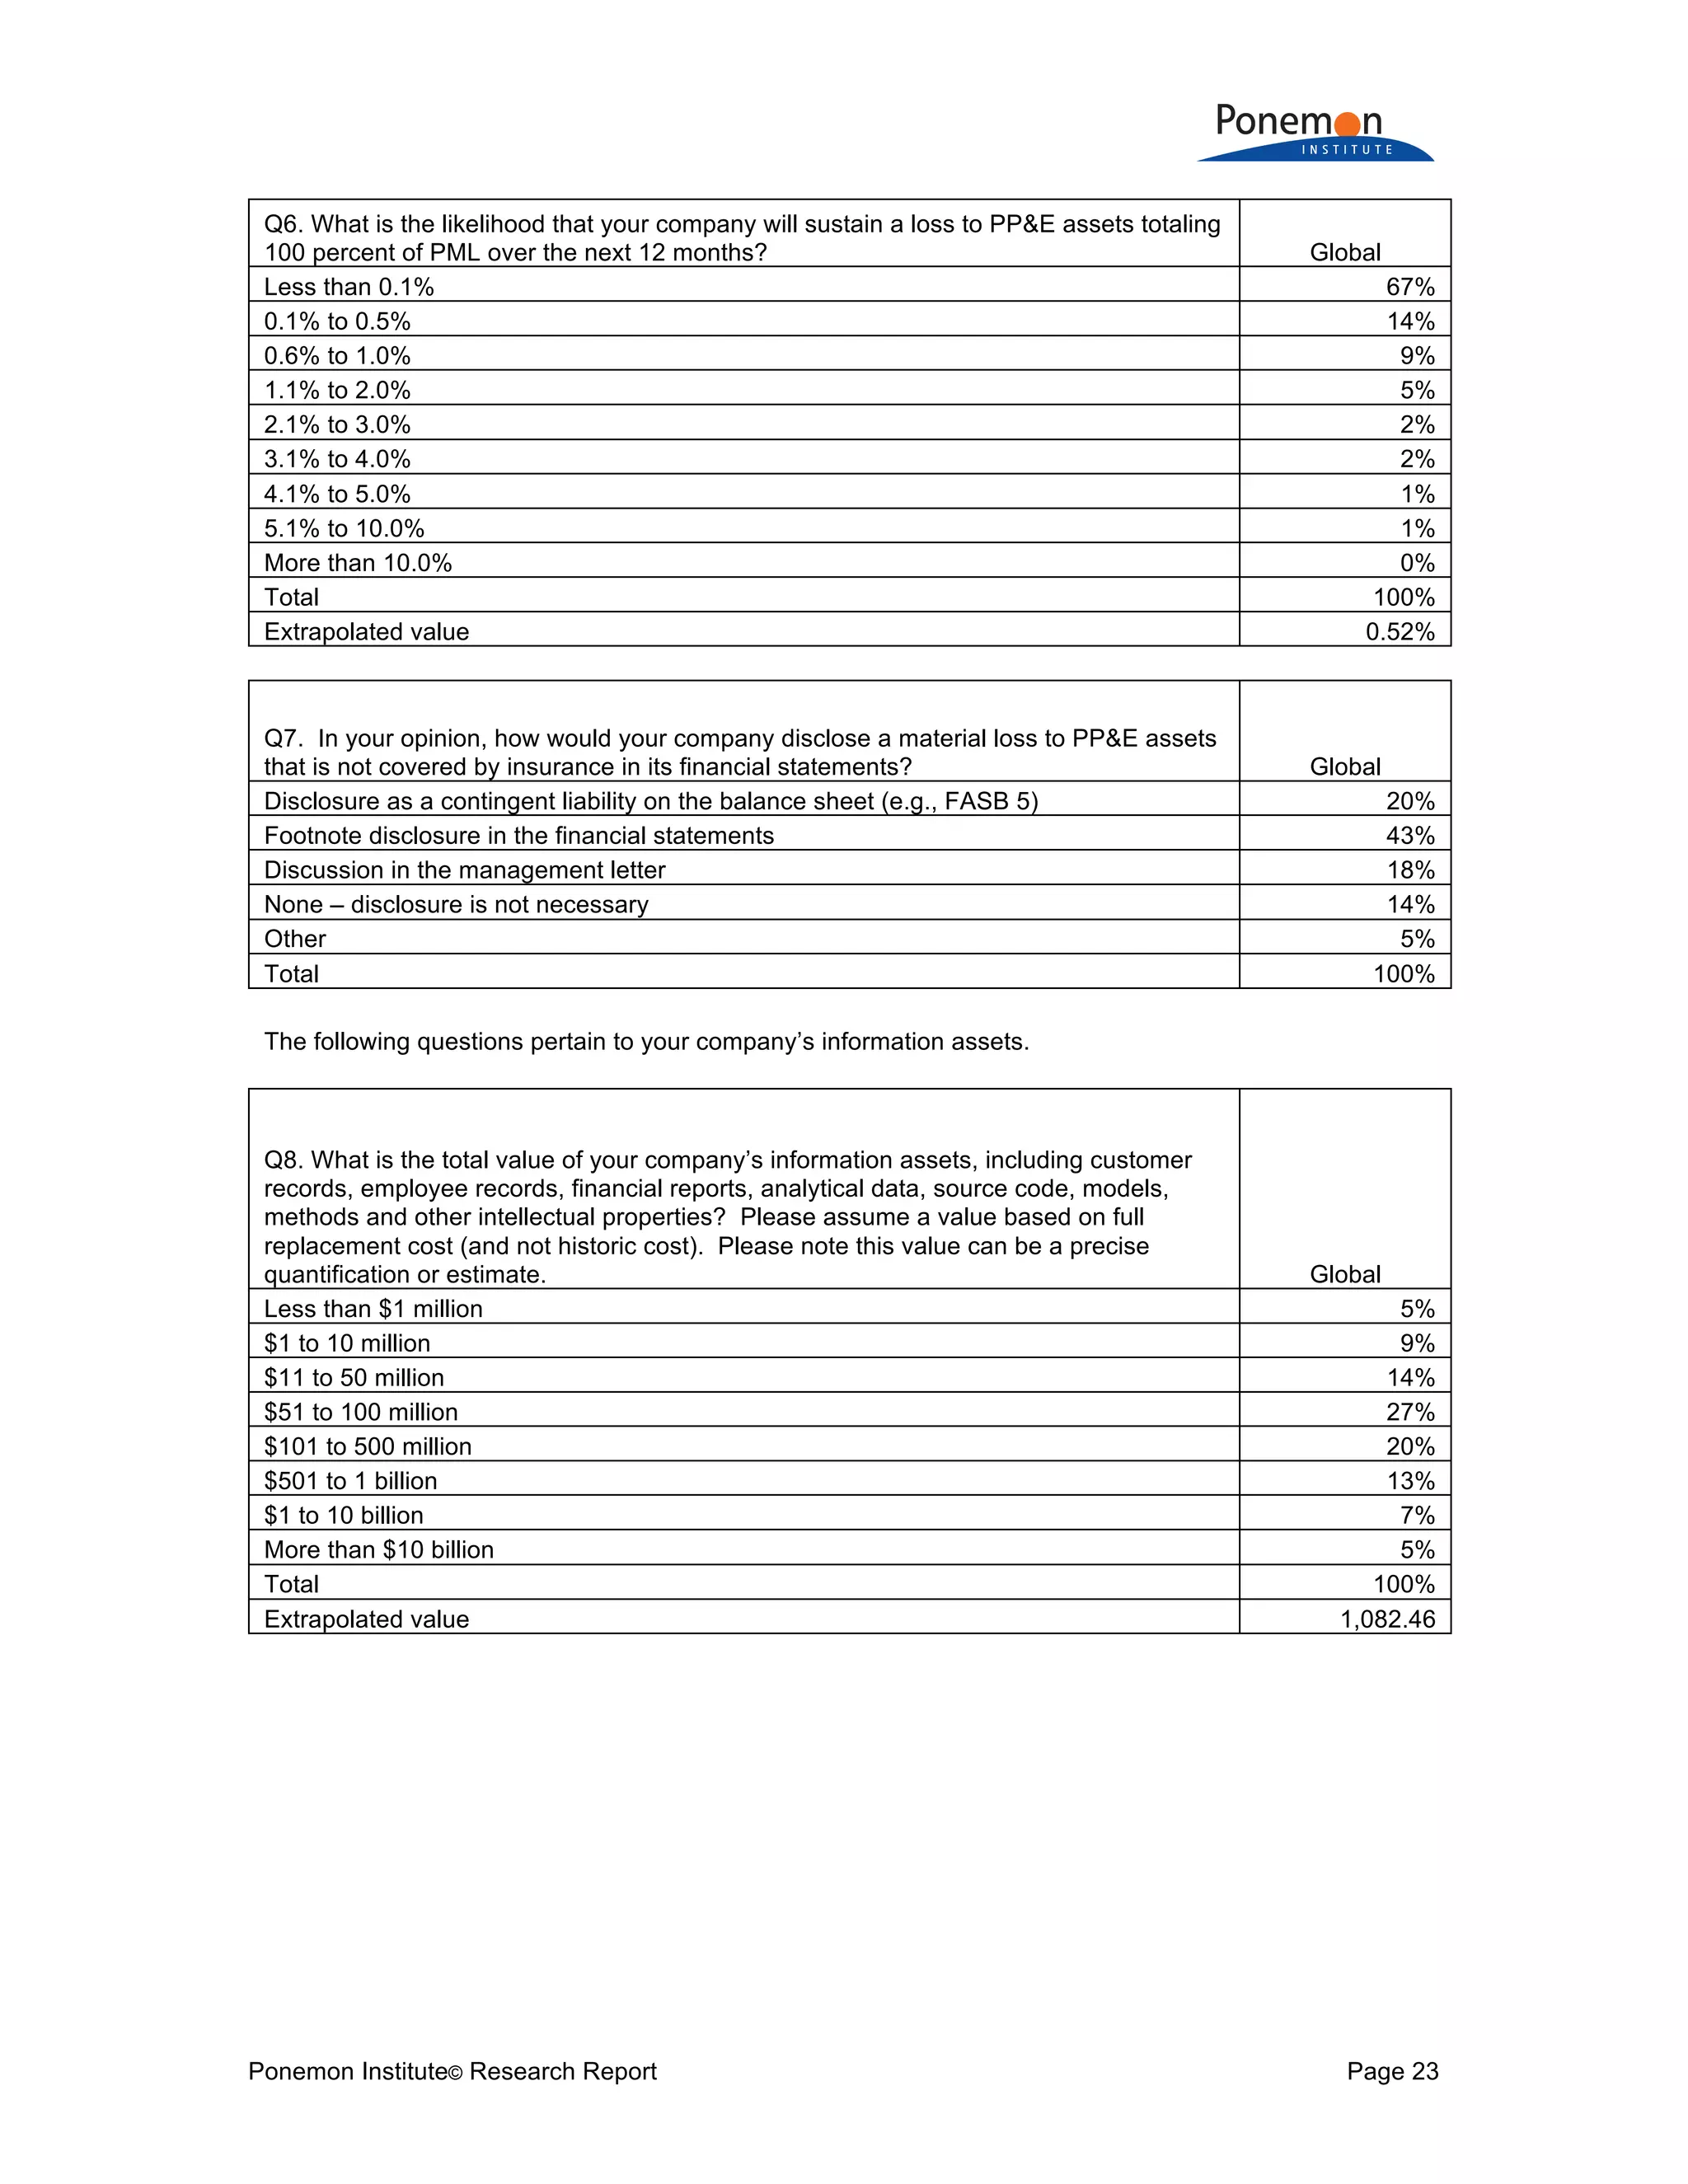
Q14. In your opinion, how would your company disclose a material loss to information
assets that is not covered by insurance in its financial statements? Global
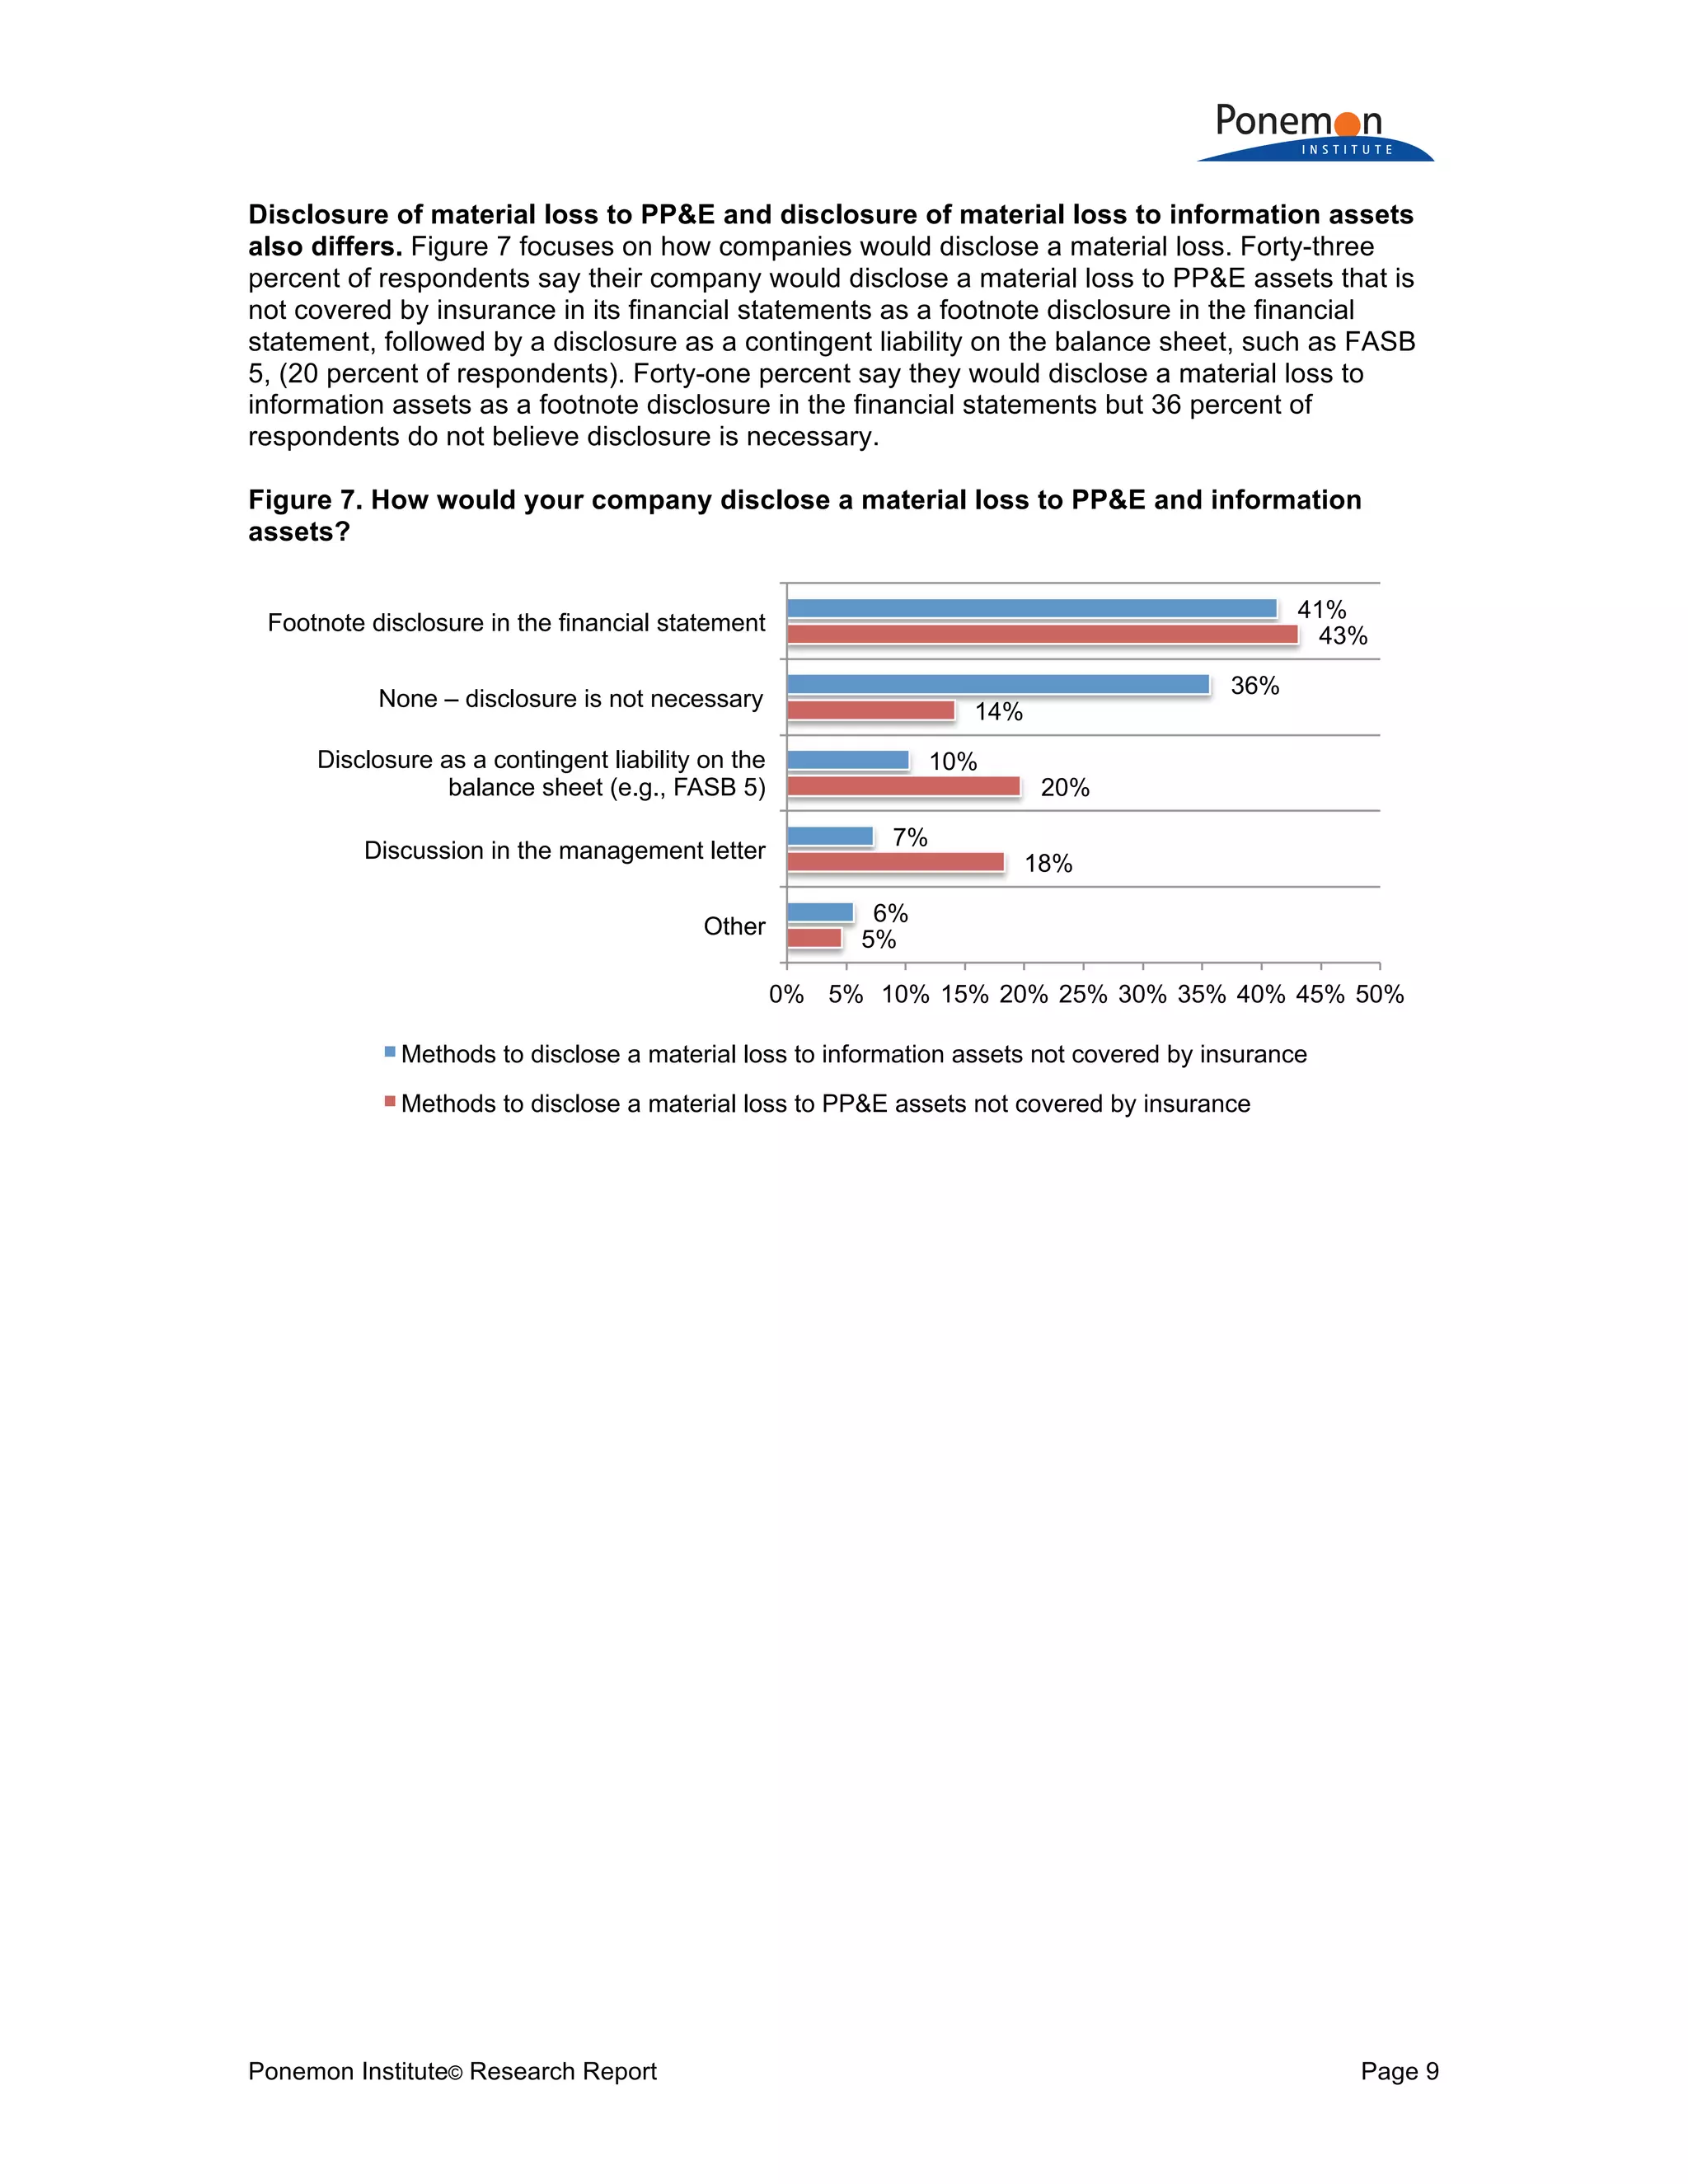
Disclosure as a contingent liability on the balance sheet (FASB 5) 10%
Footnote disclosure in the financial statements 41%
Discussion in the management letter 7%
None – disclosure is not necessary 36%
Other 6%
Total 100%
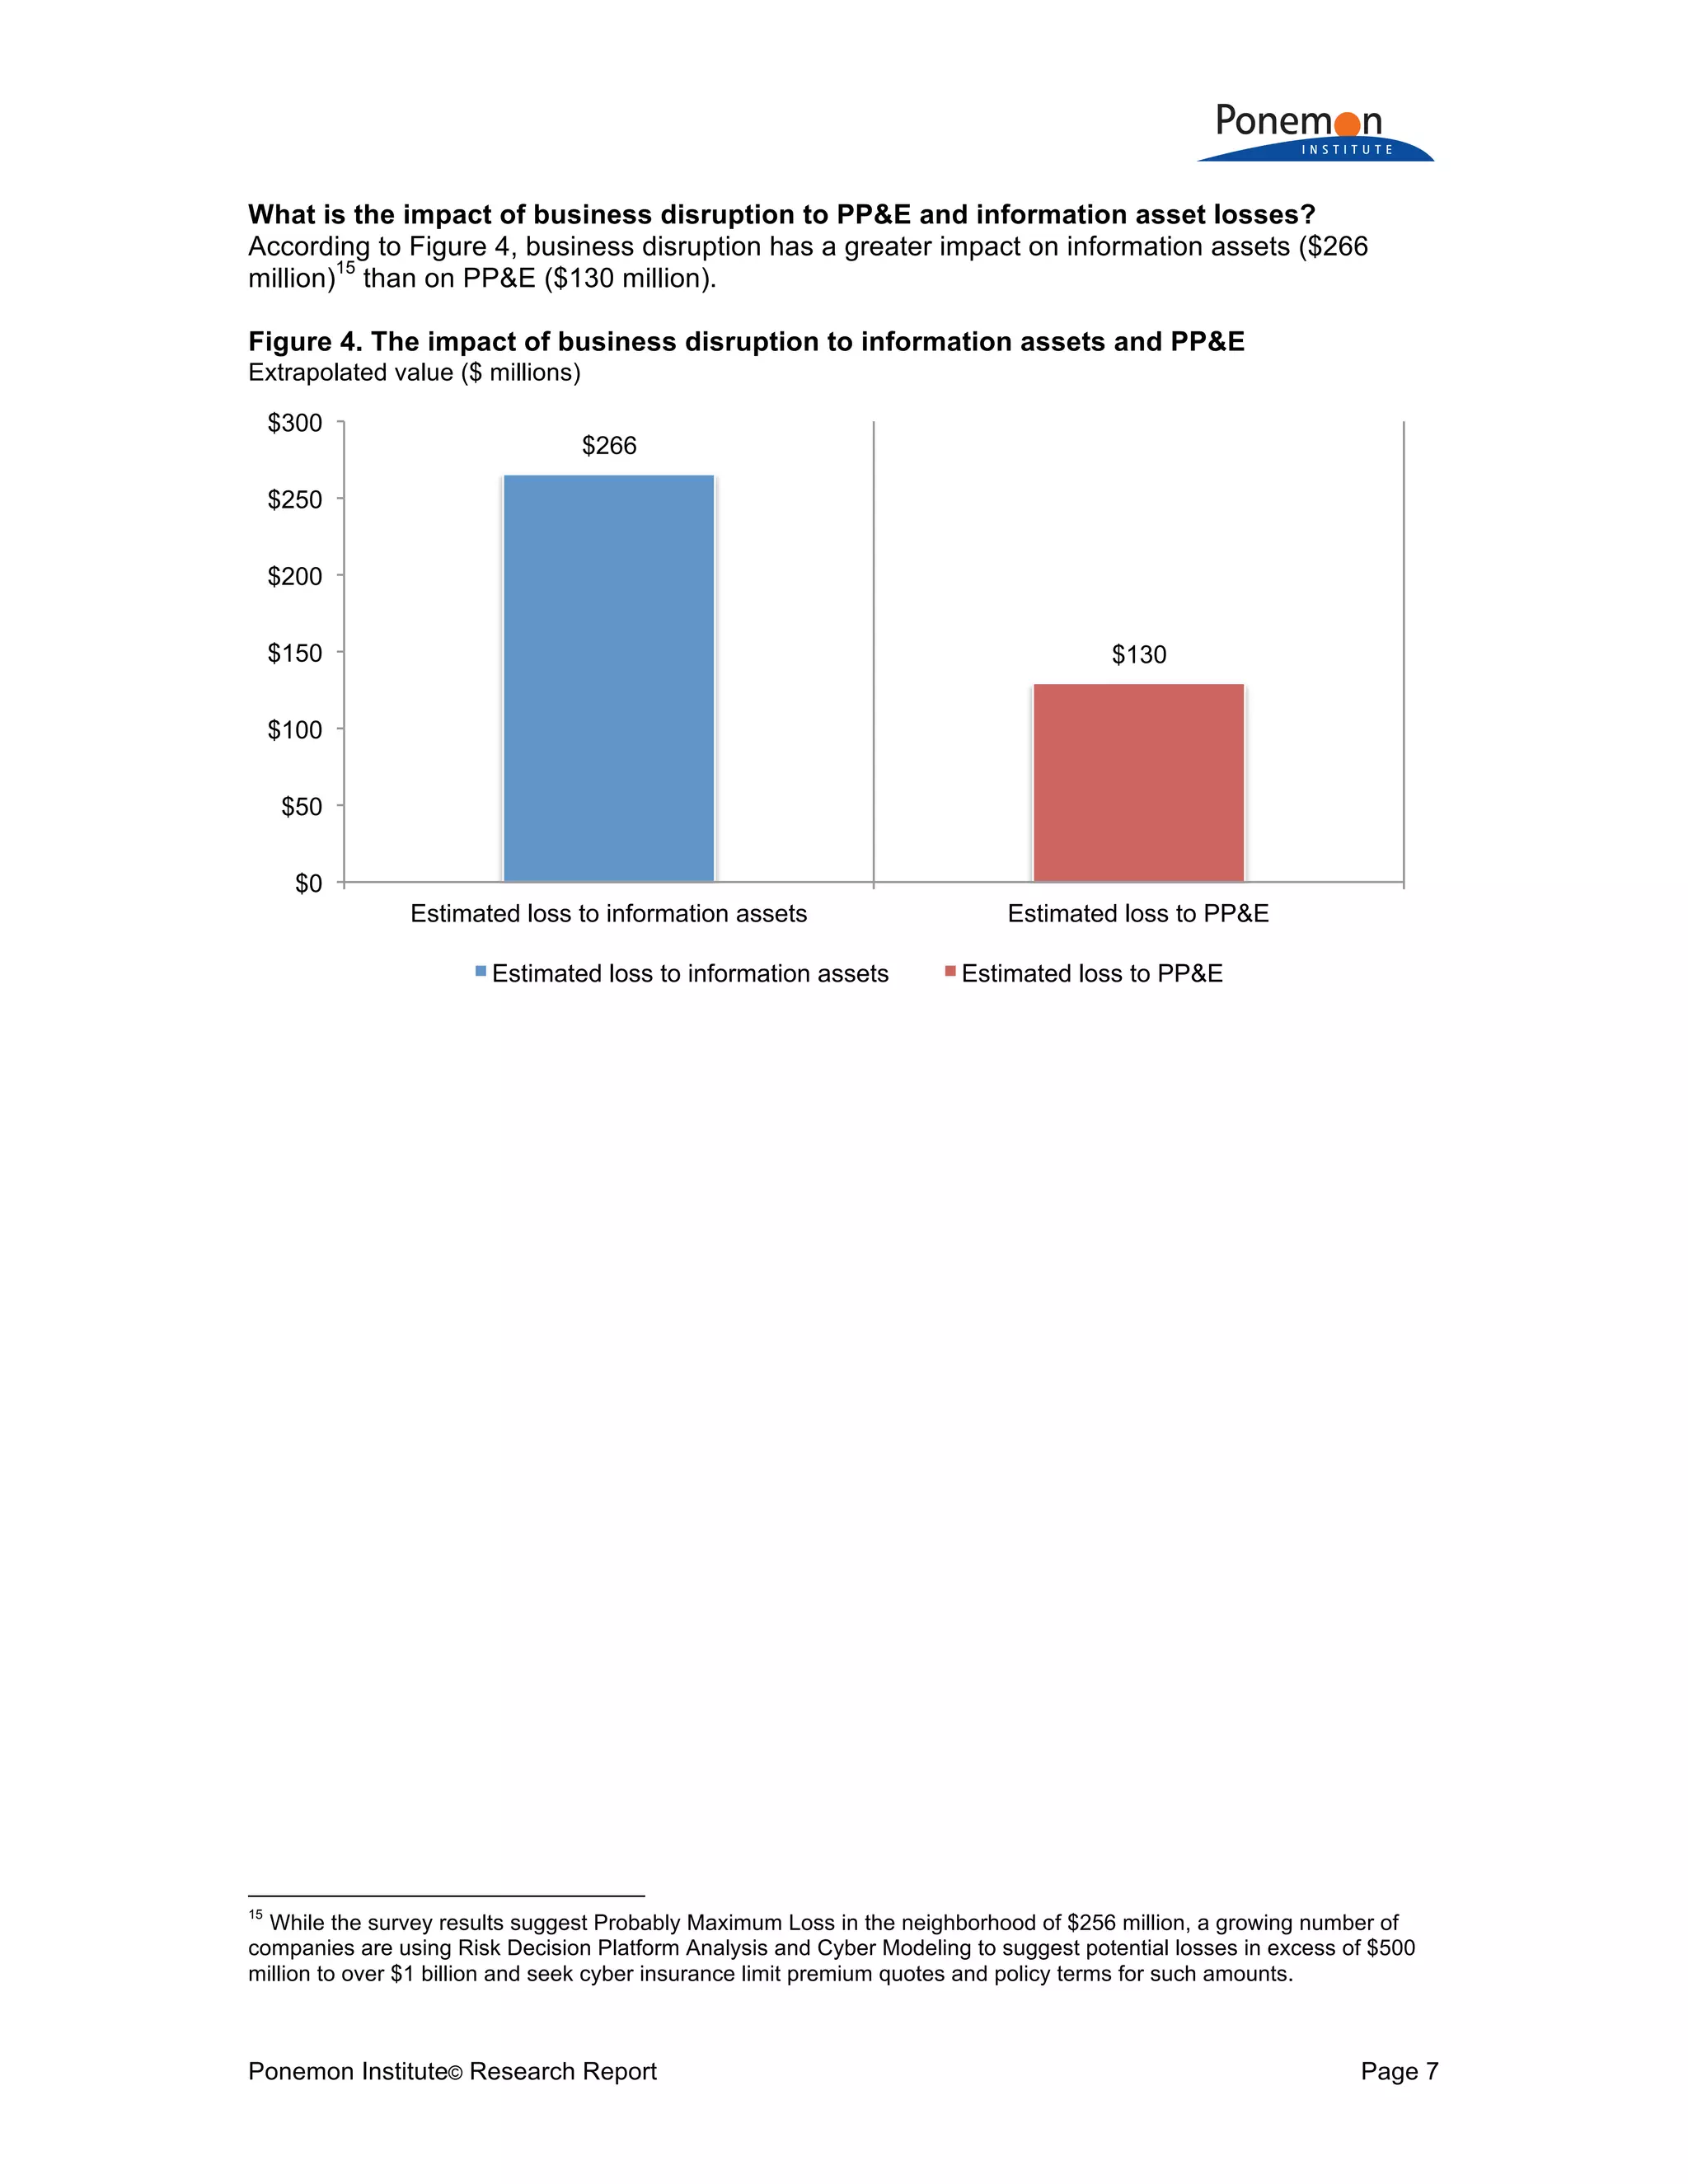
Part 2. Other Questions
Q15. Are you aware of the economic and legal consequences resulting from a data
breach or security exploit in other countries in which your company operates, such as
the European Union’s General Data Protection Regulation (GDPR), which may issue a
fine of up to 5 percent of an organization’s worldwide revenue? Global
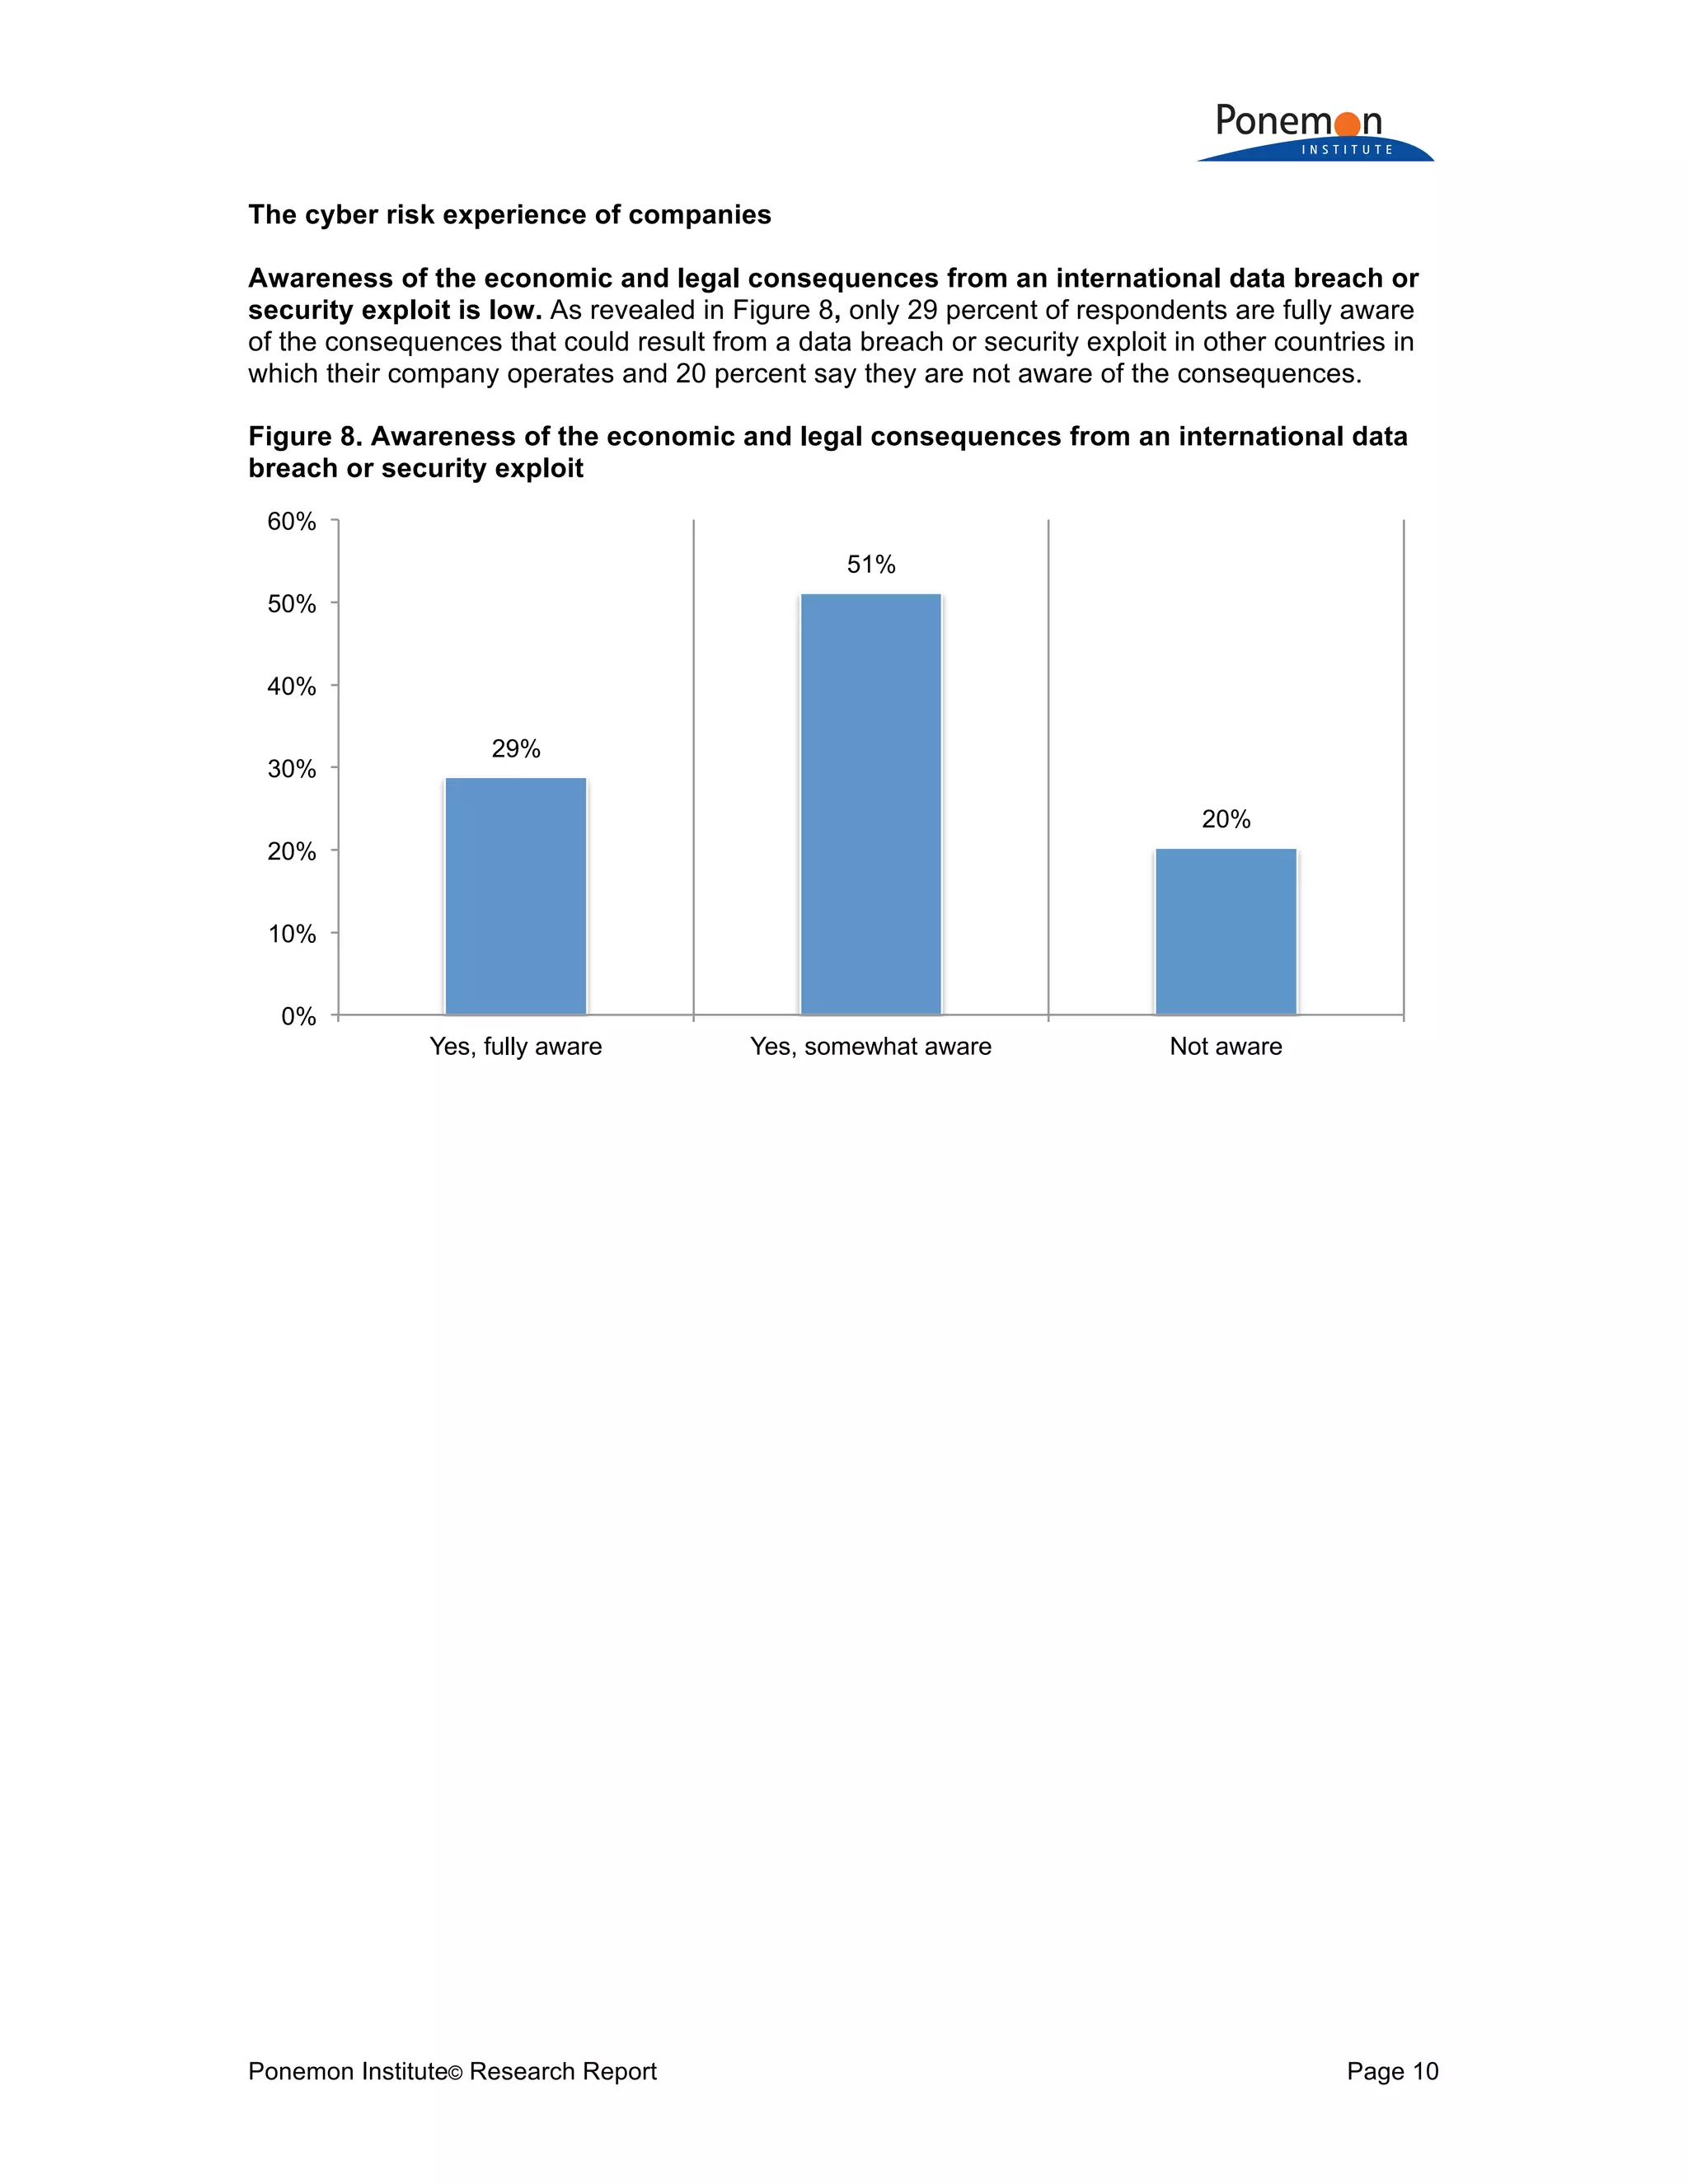
Yes, fully aware 29%
Yes, somewhat aware 51%
Not aware 20%
Total 100%
Q16a. Has your company experienced a material or significantly disruptive security
exploit or data breach one or more times over the past 24 months? Please refer to the
definition of materiality provided above. Global
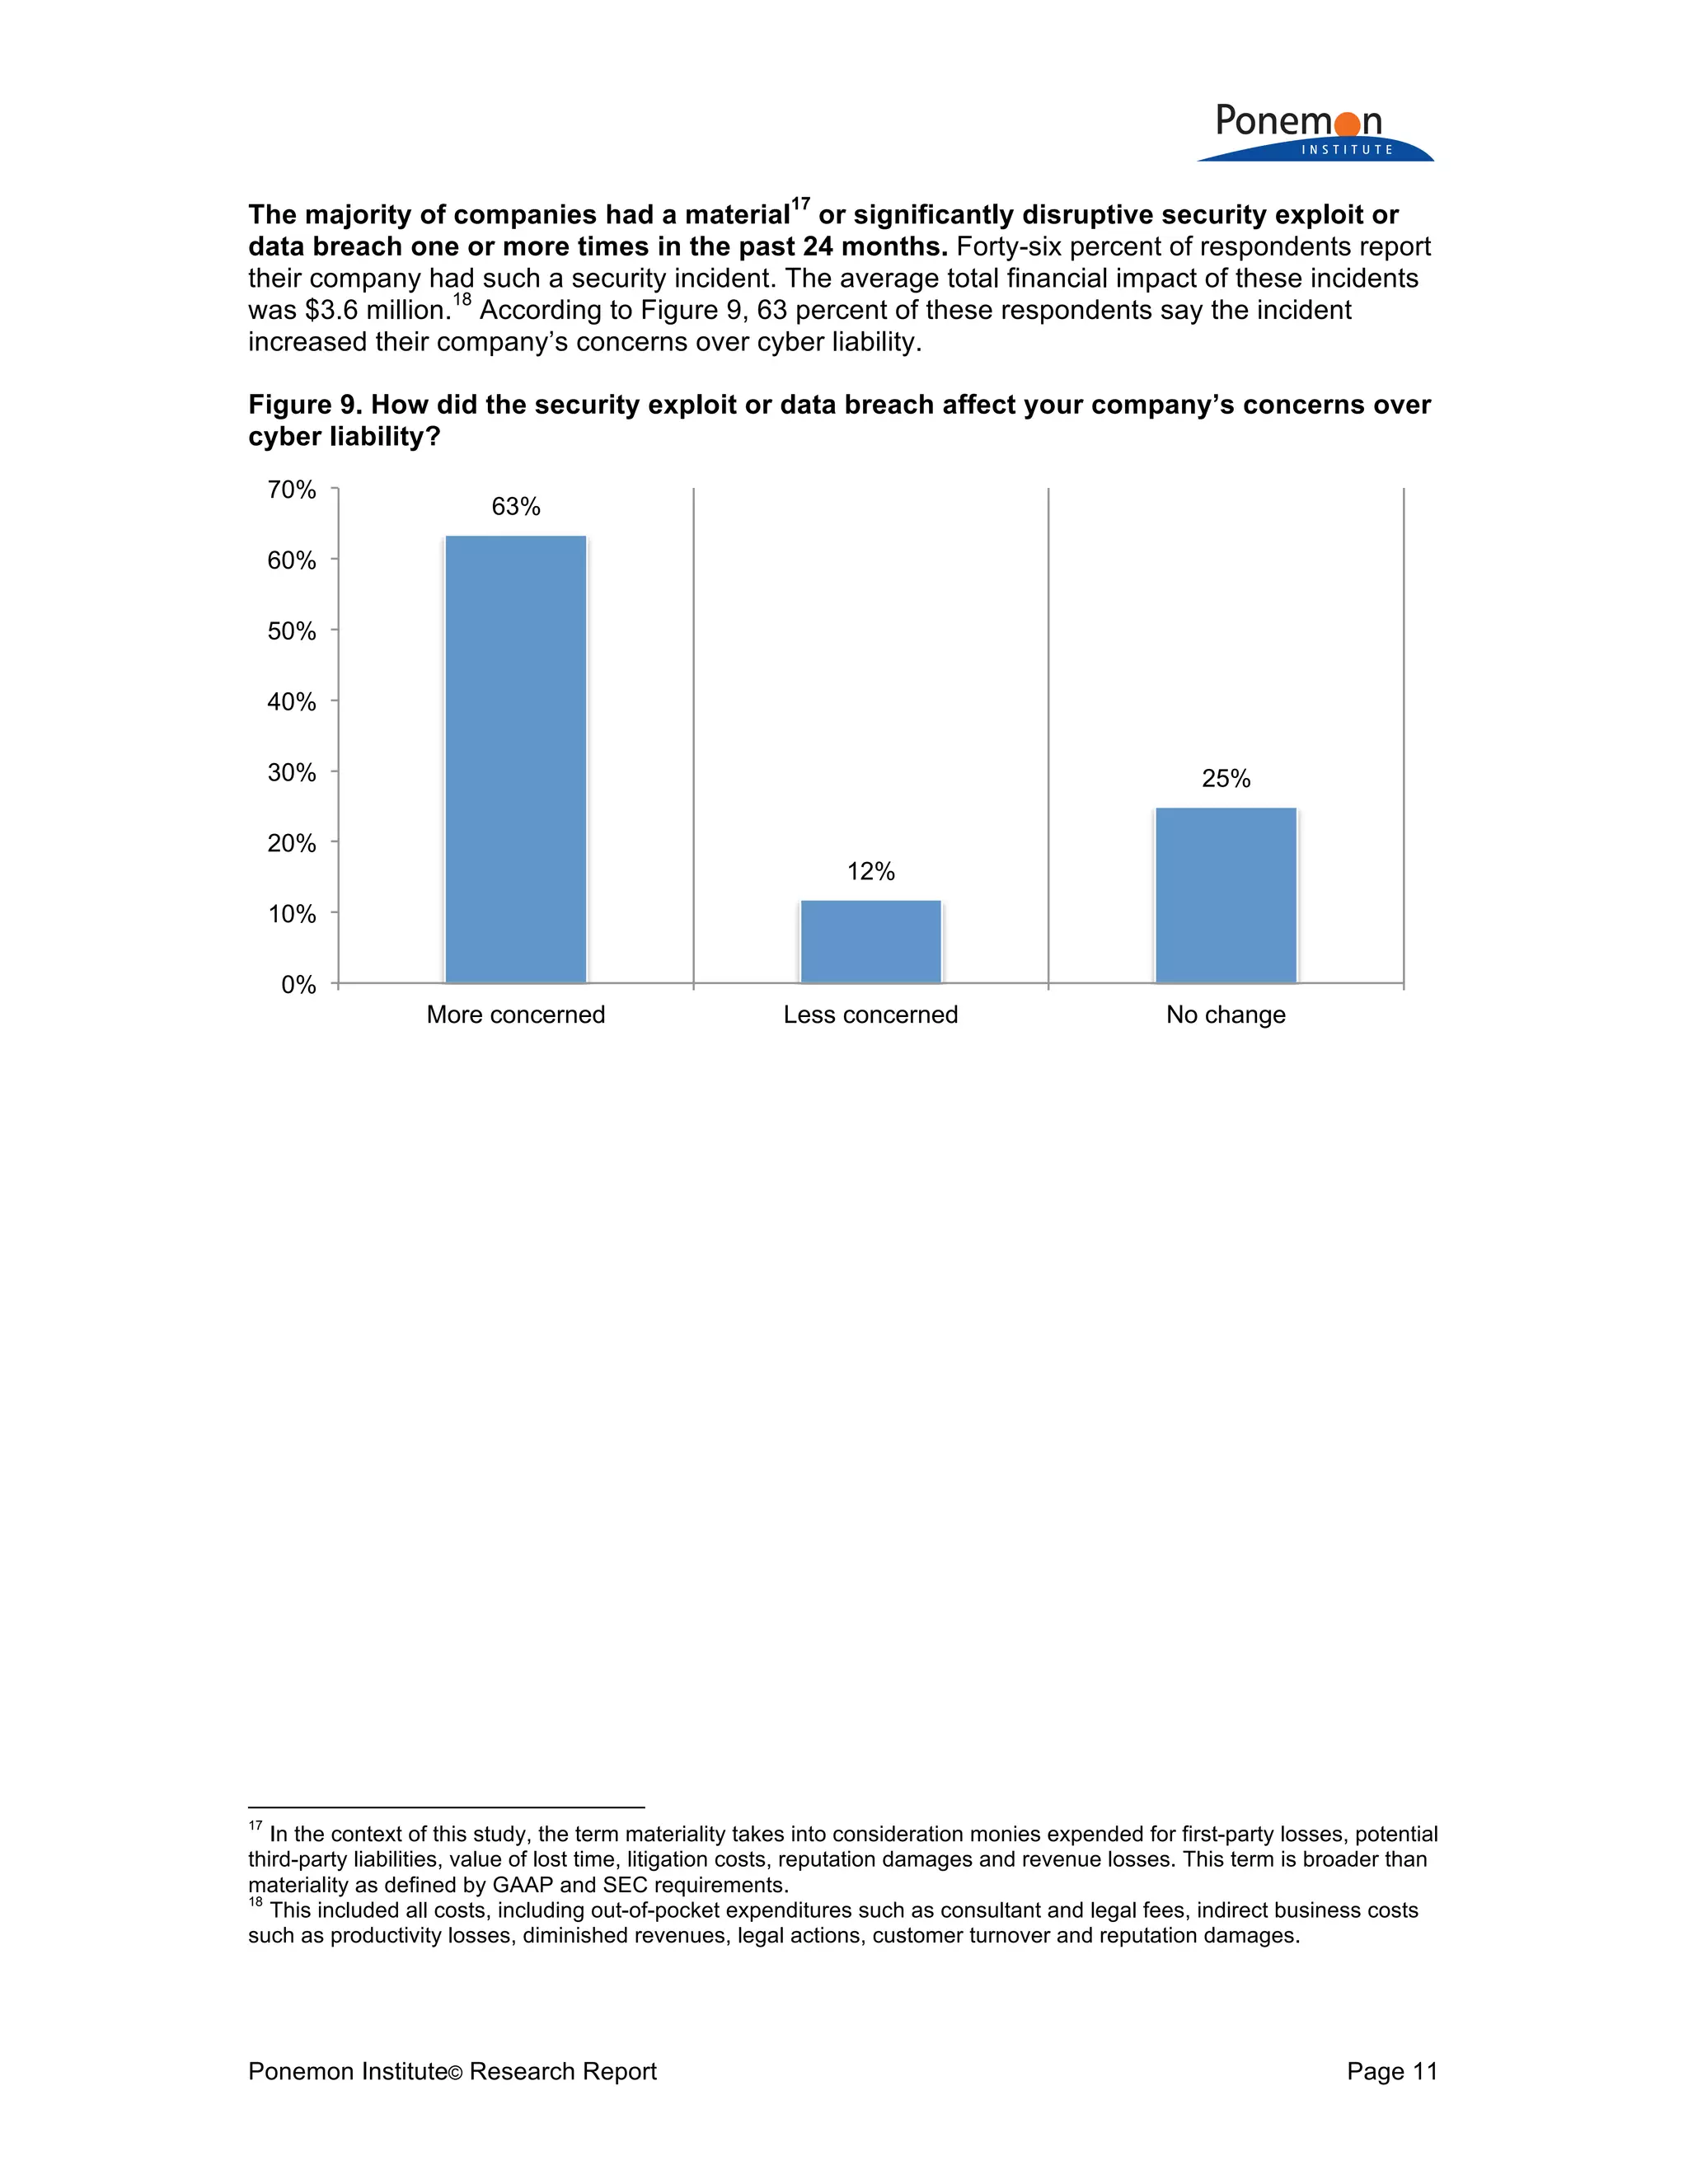
Yes 46%
No [skip to Q17] 54%
Total 100%
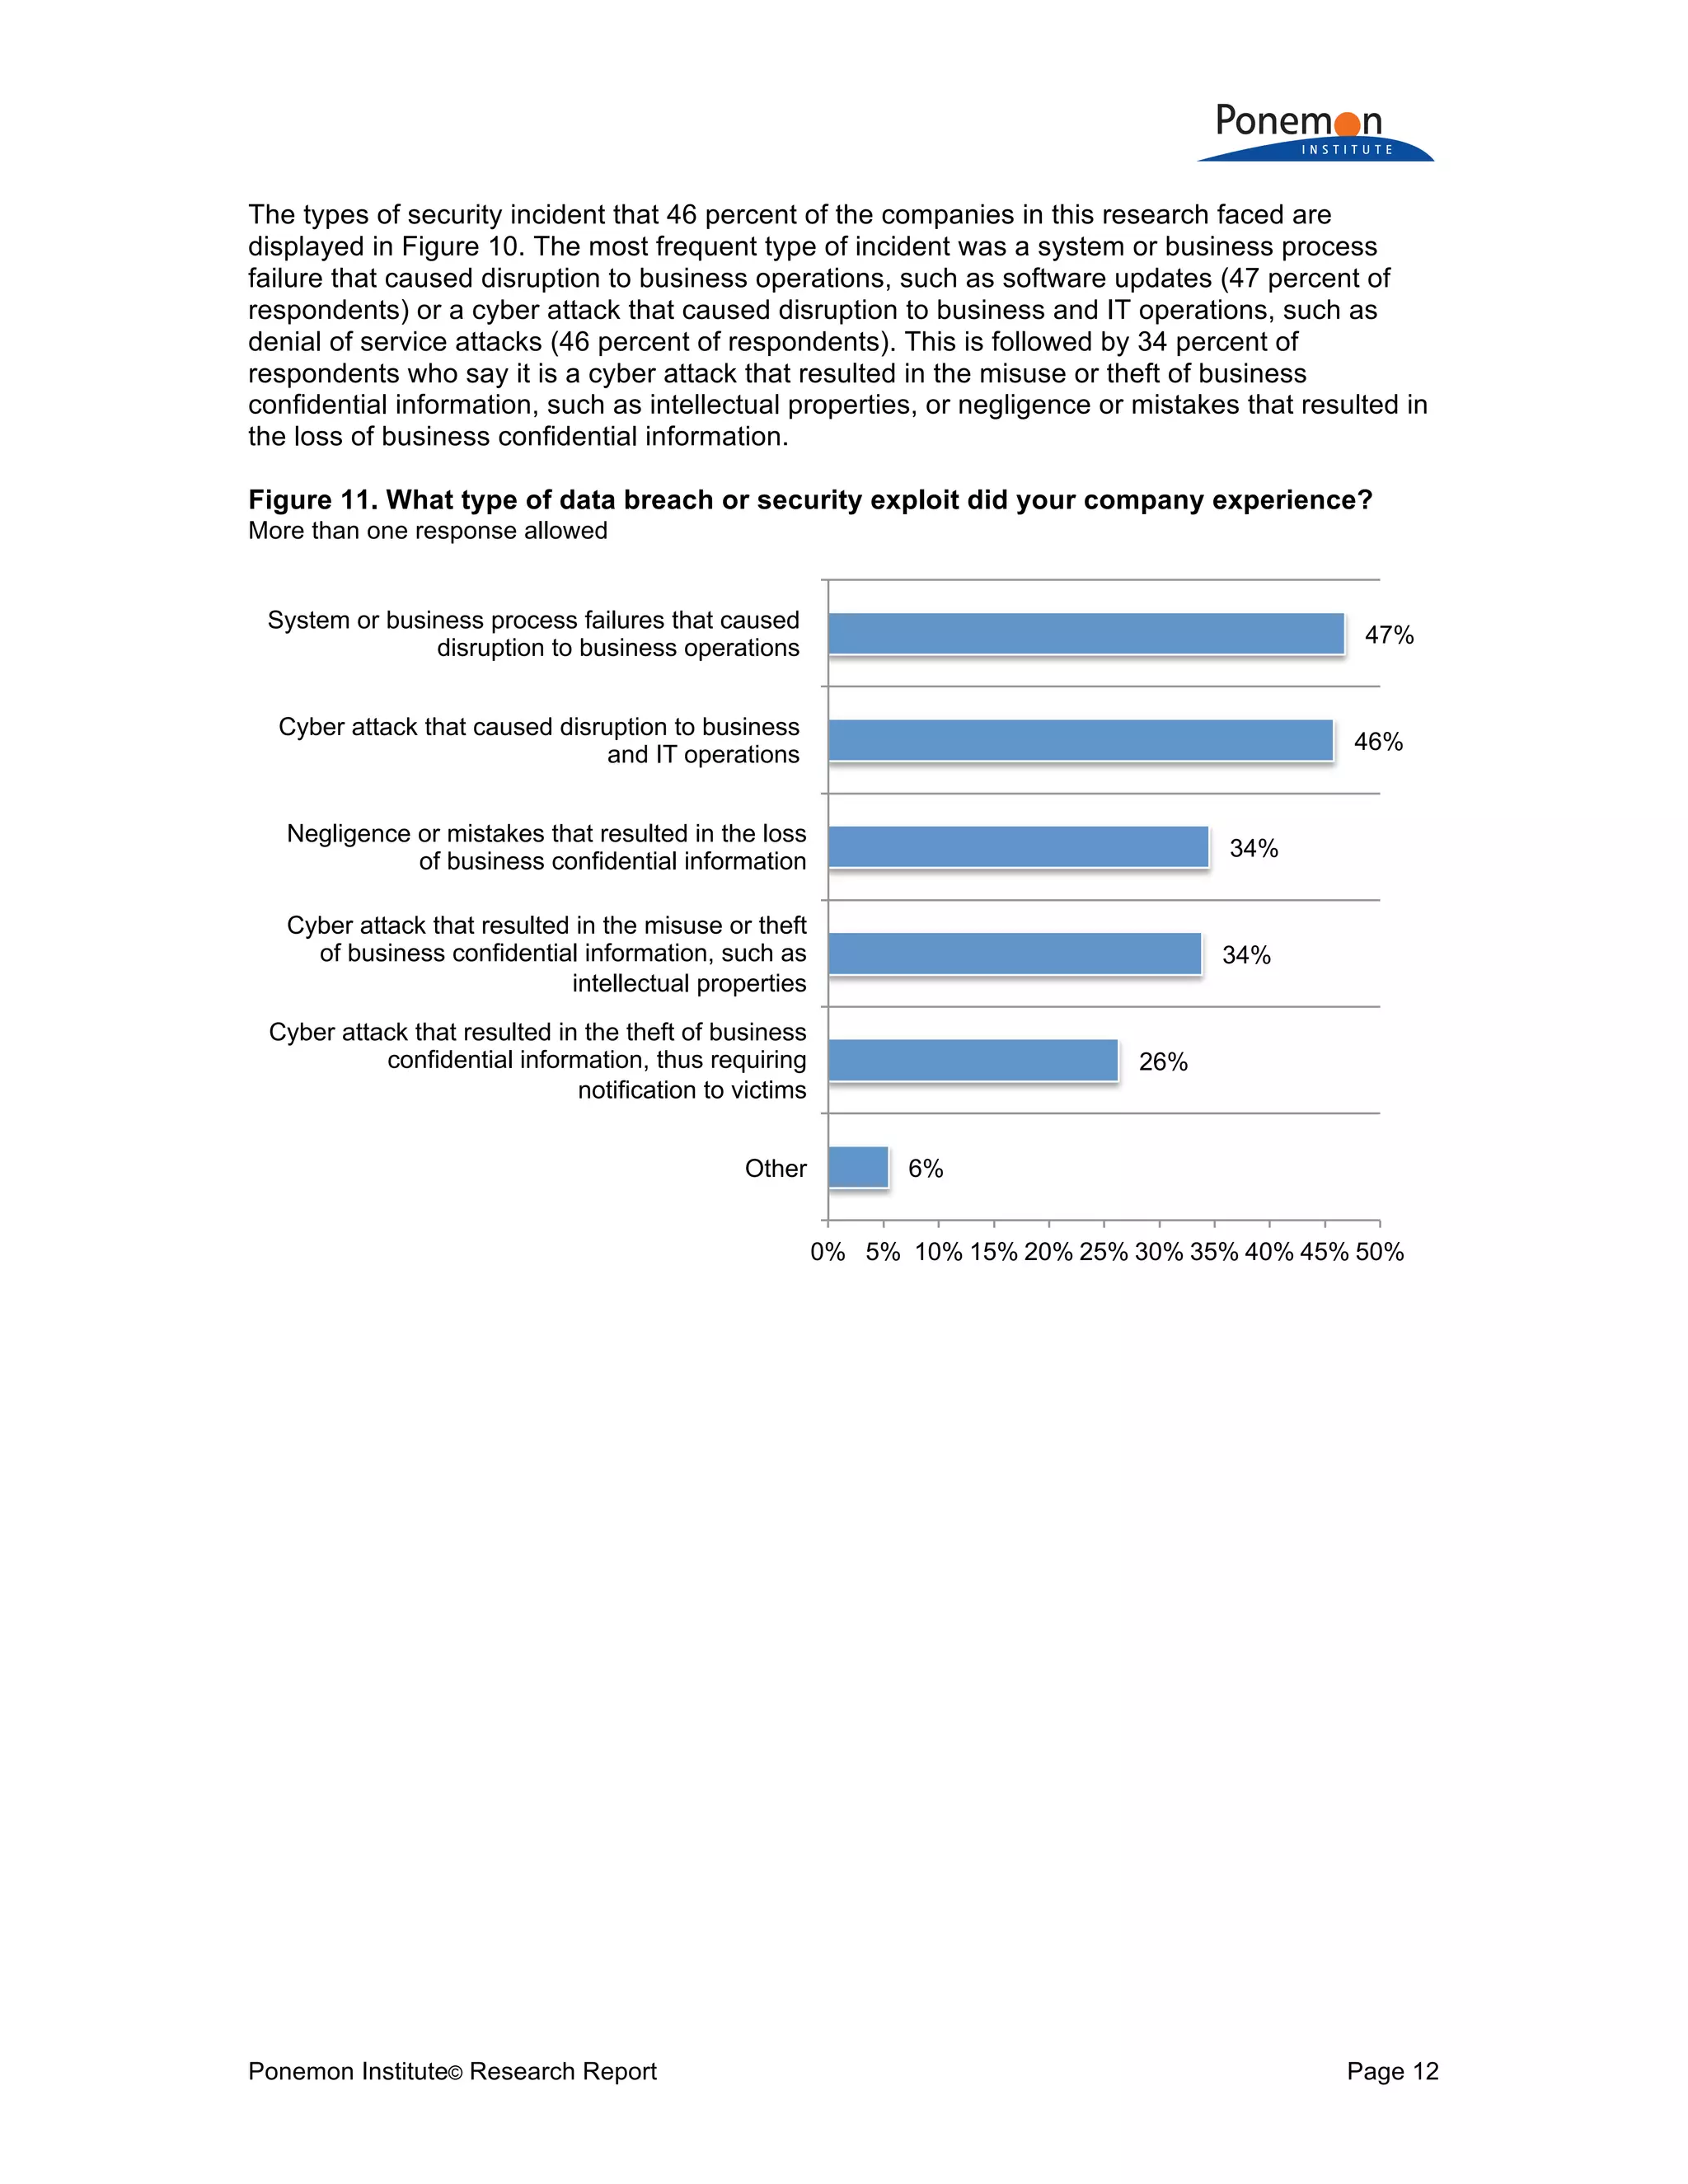
Q16b. If yes, what best describes the data breaches or security exploits experienced by
your company over the past 24 months? Please select all that apply. Global
Cyber attack that caused disruption to business and IT operations (such as denial of
service attacks) 46%
Cyber attack that resulted in the theft of business confidential information, thus
requiring notification to victims 26%
Cyber attack that resulted in the misuse or theft of business confidential information,
such as intellectual properties 34%
Negligence or mistakes that resulted in the loss of business confidential information 34%
System or business process failures that caused disruption to business operations (e.g.
software updates) 47%
Other 6%
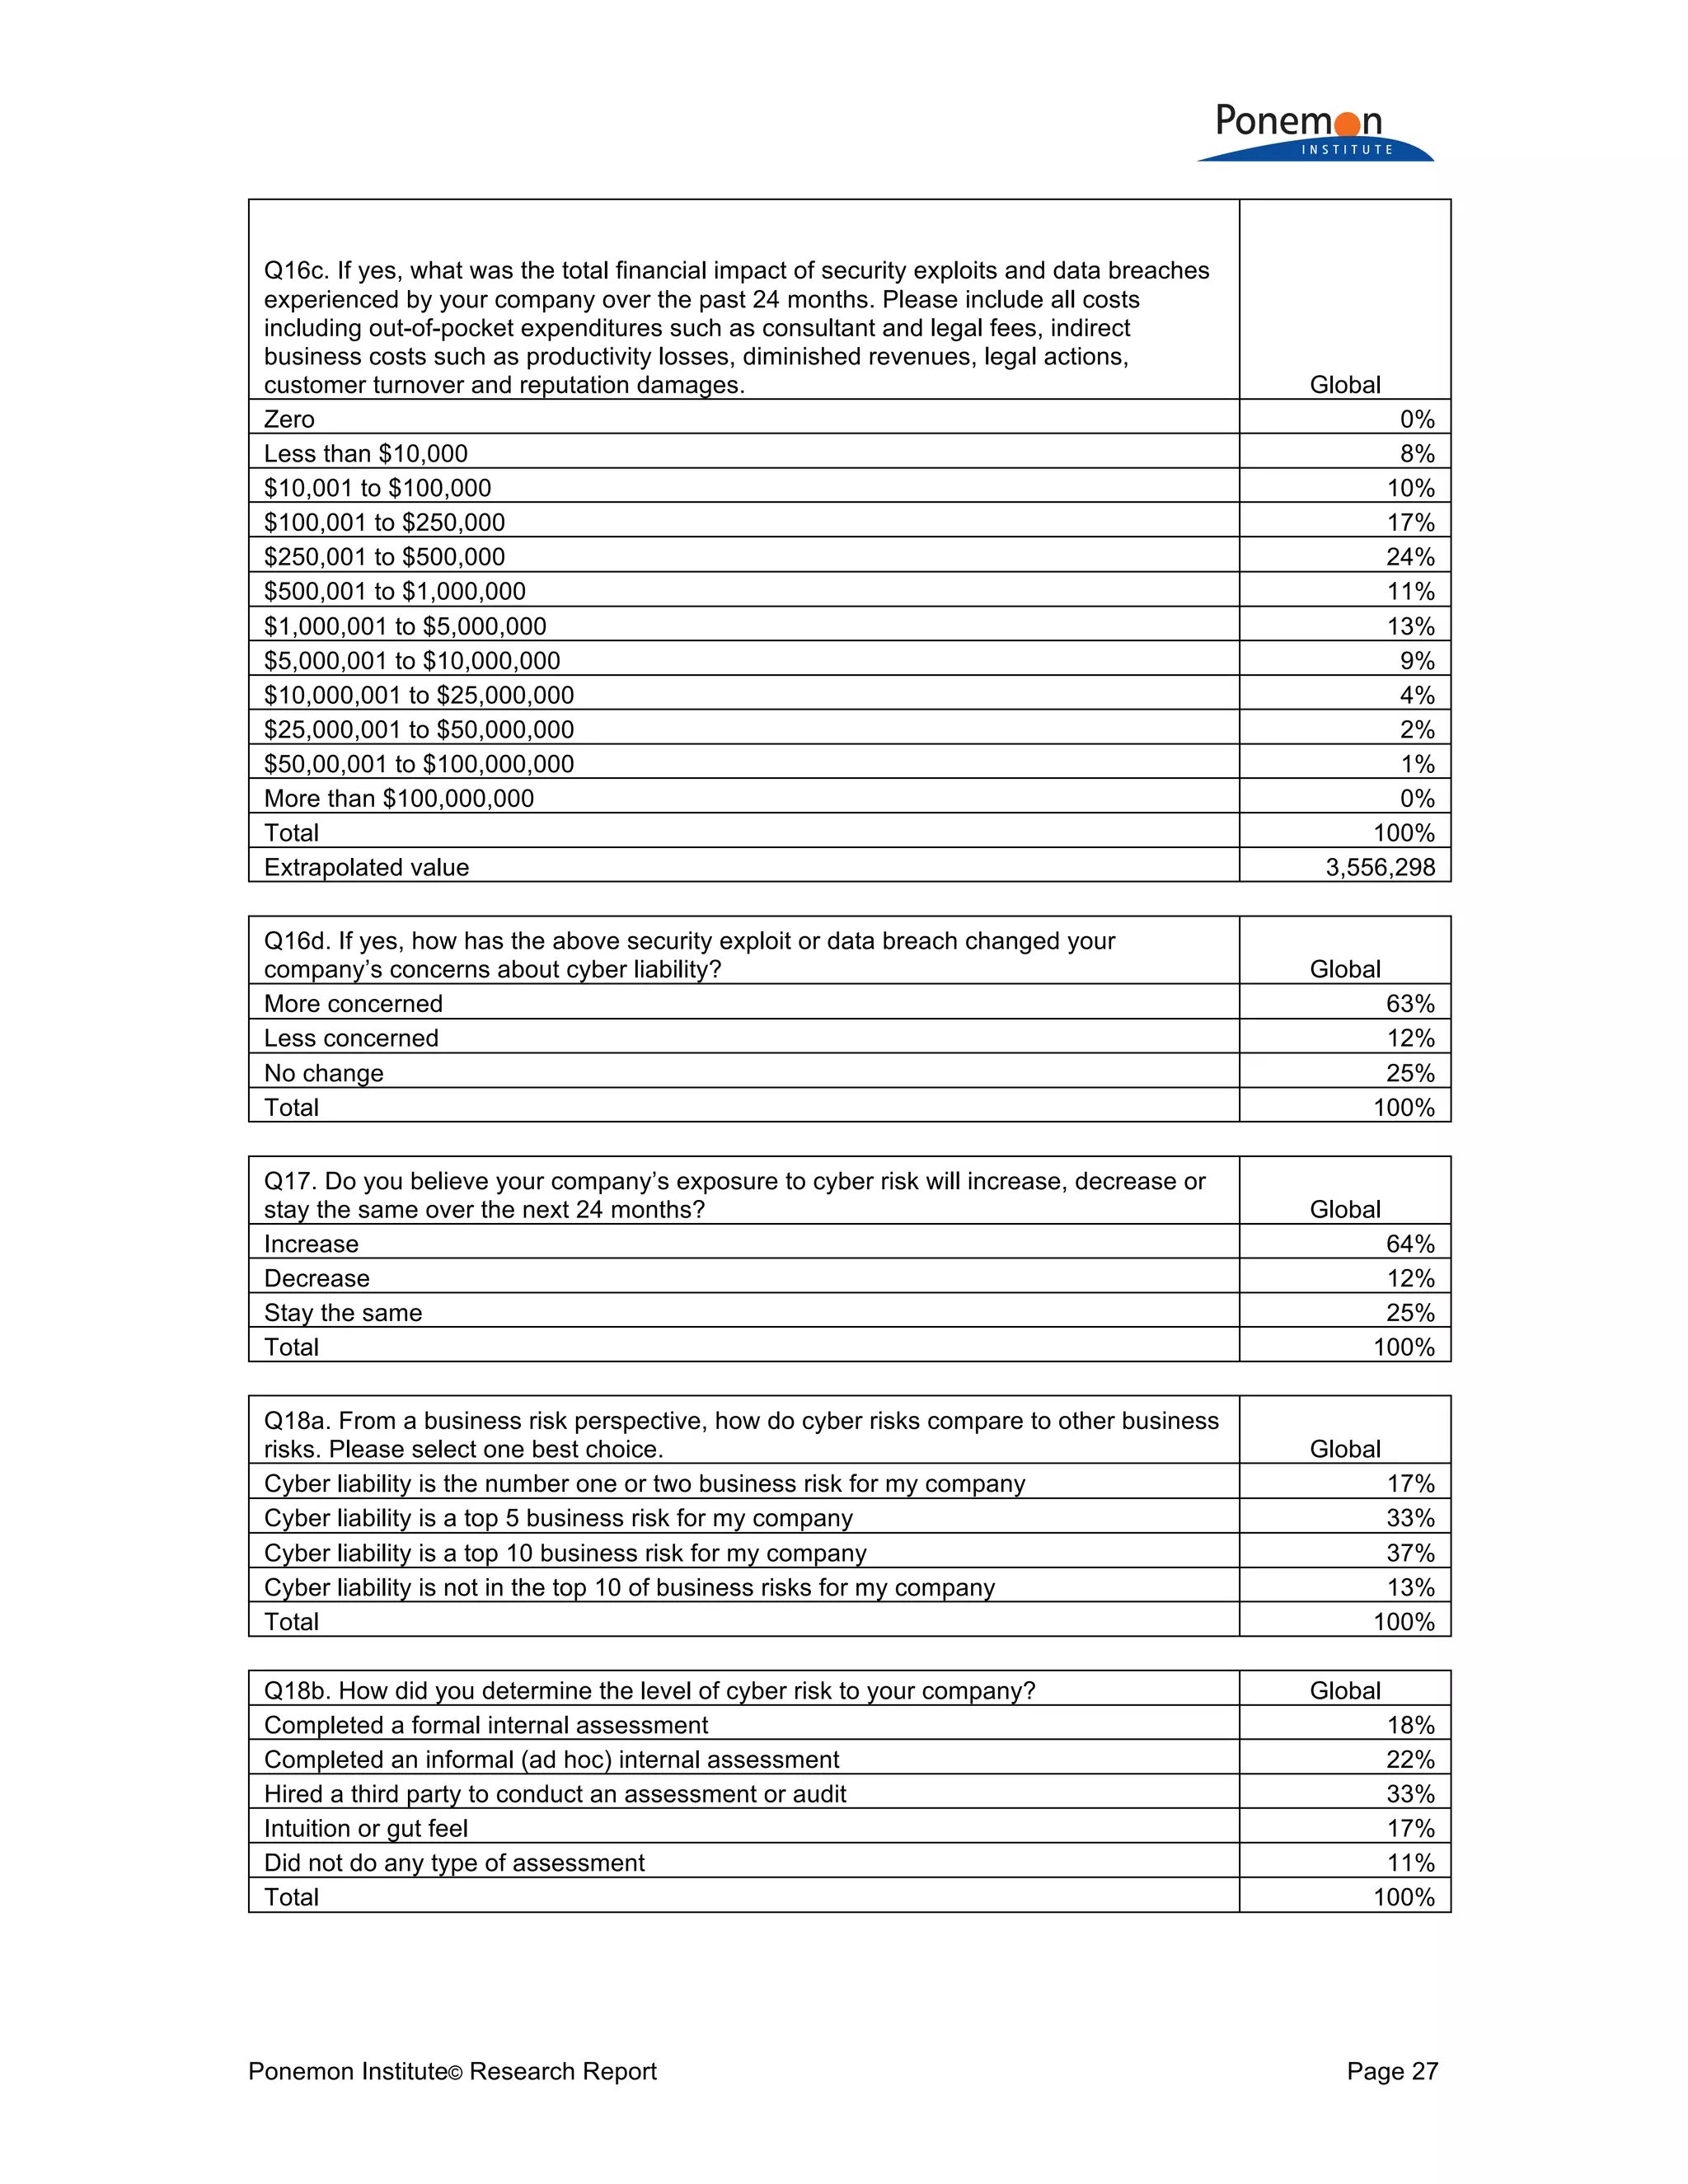
Total 193%](https://image.slidesharecdn.com/2017-global-cyber-risk-transfer-report-final-170505193547/75/2017-global-cyber-risk-transfer-report-final-27-2048.jpg)
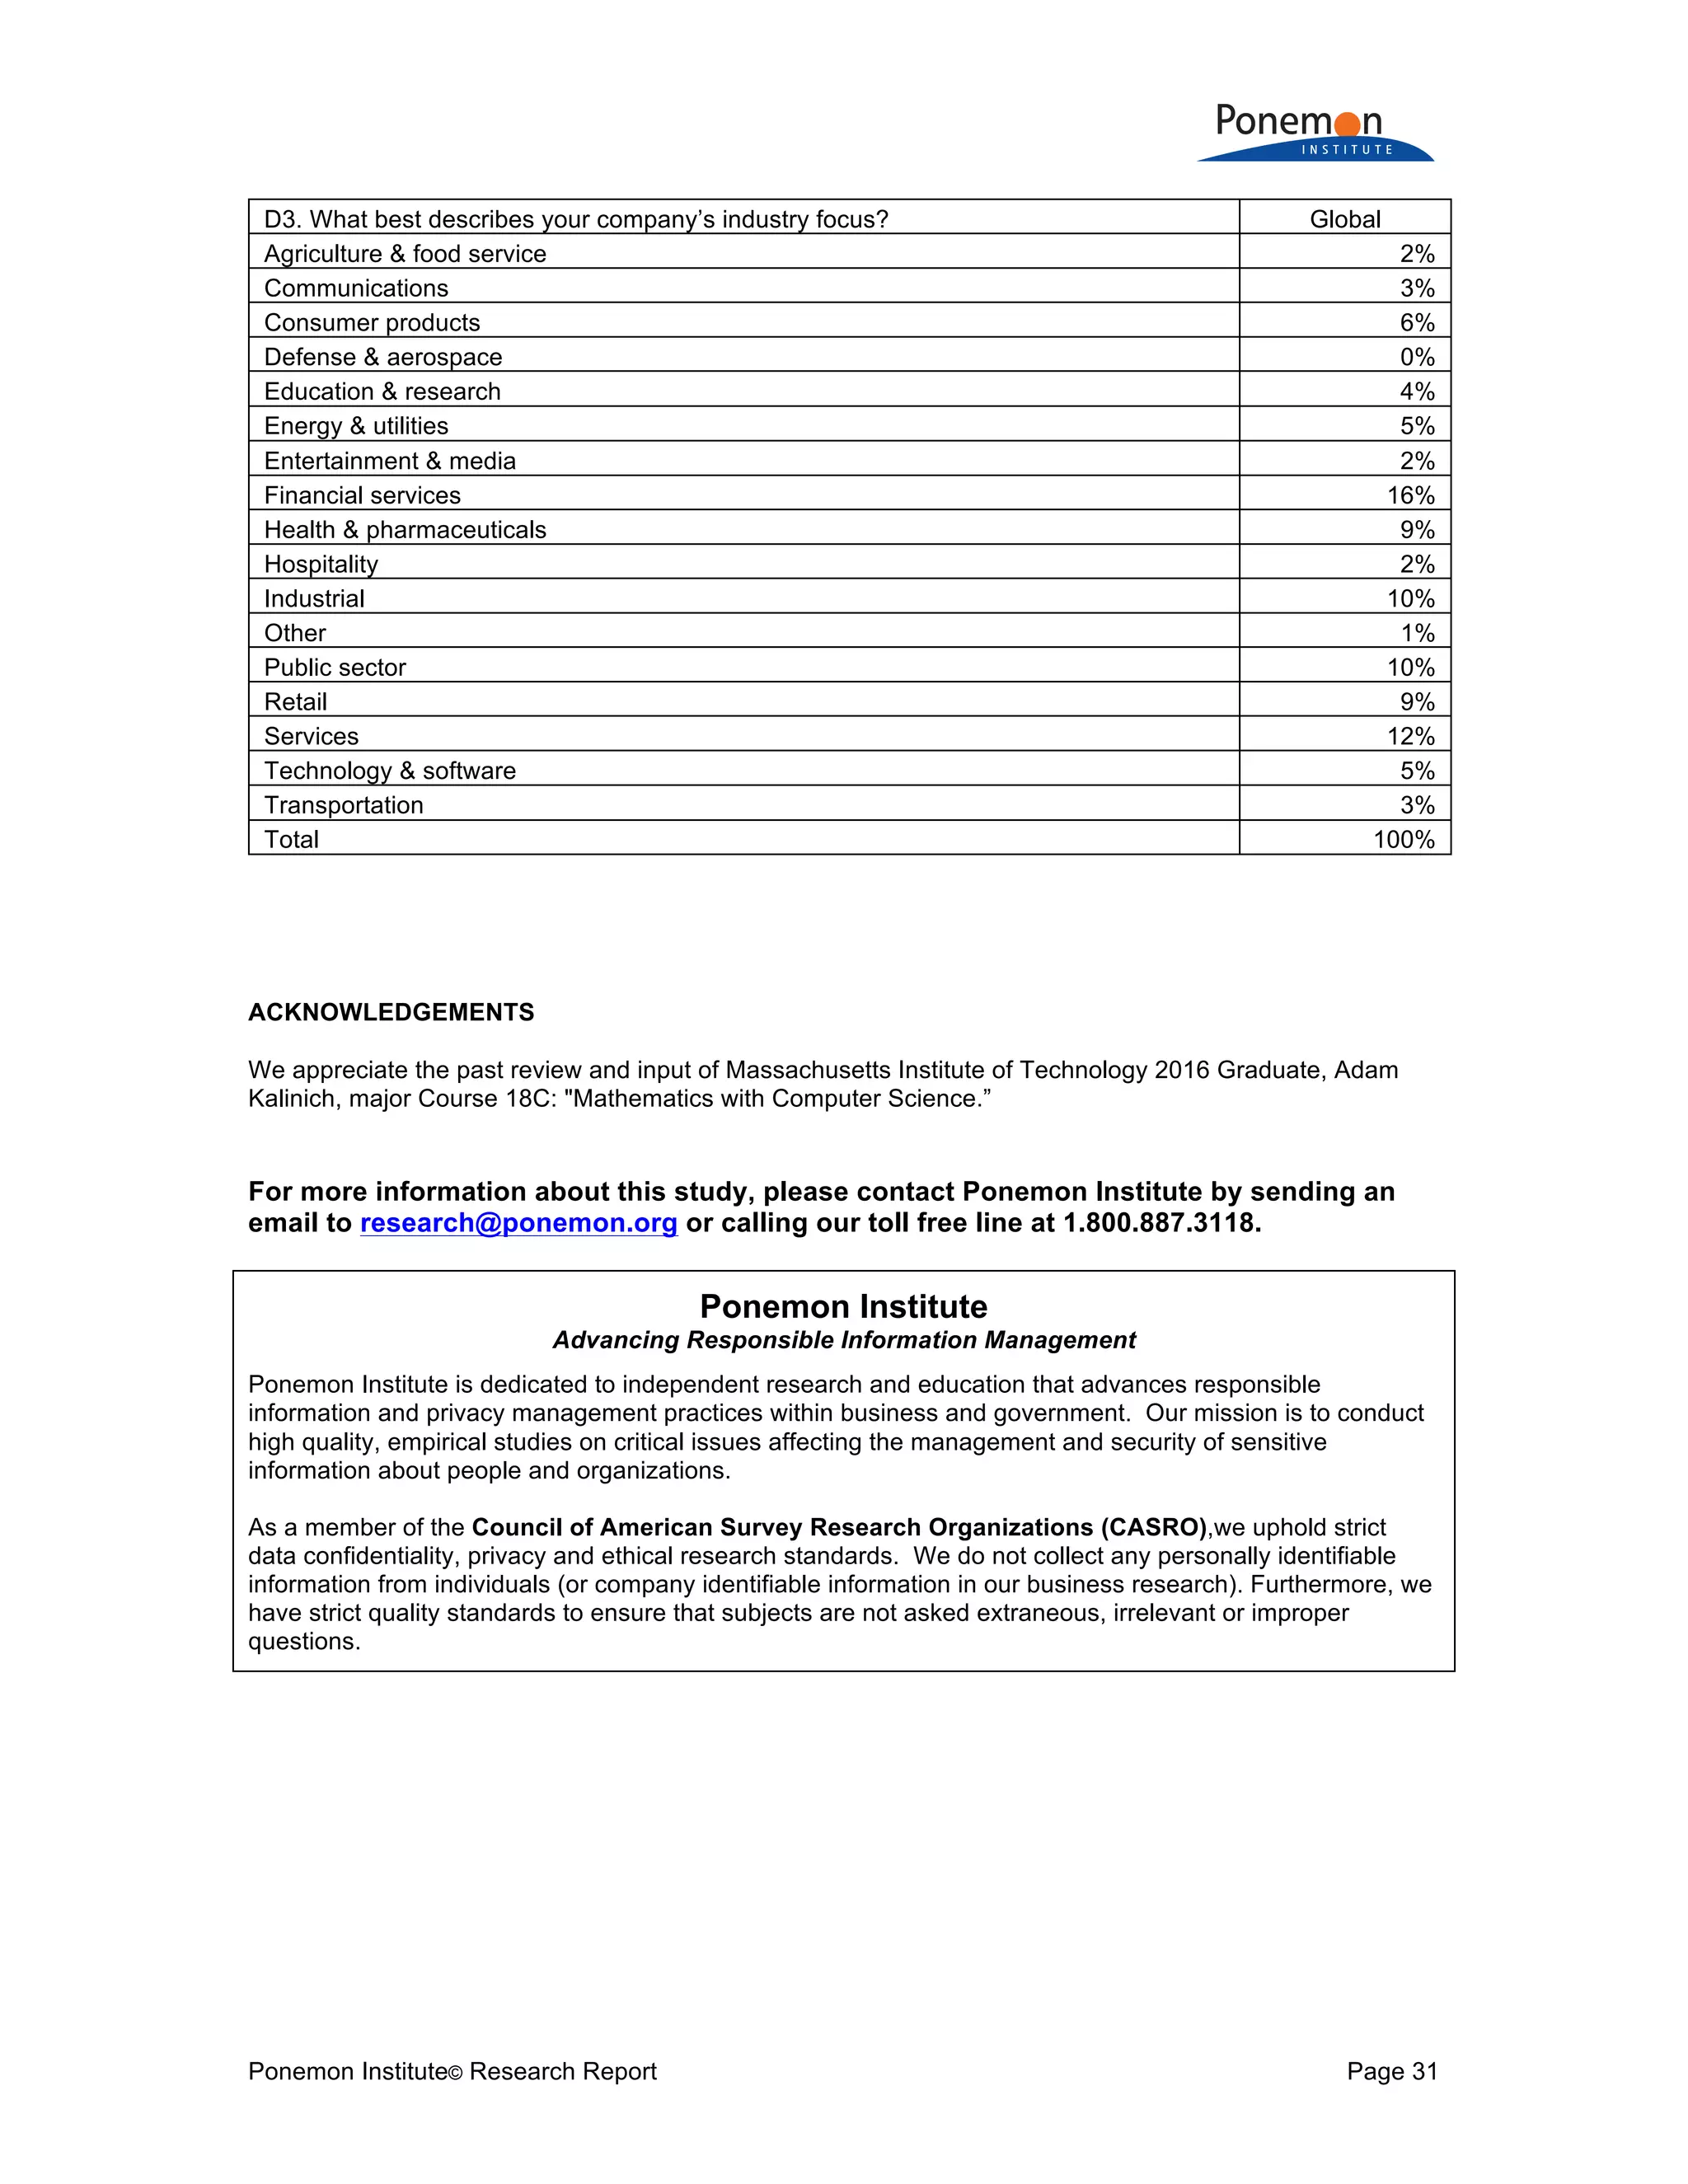
![Ponemon Institute© Research Report Page 28
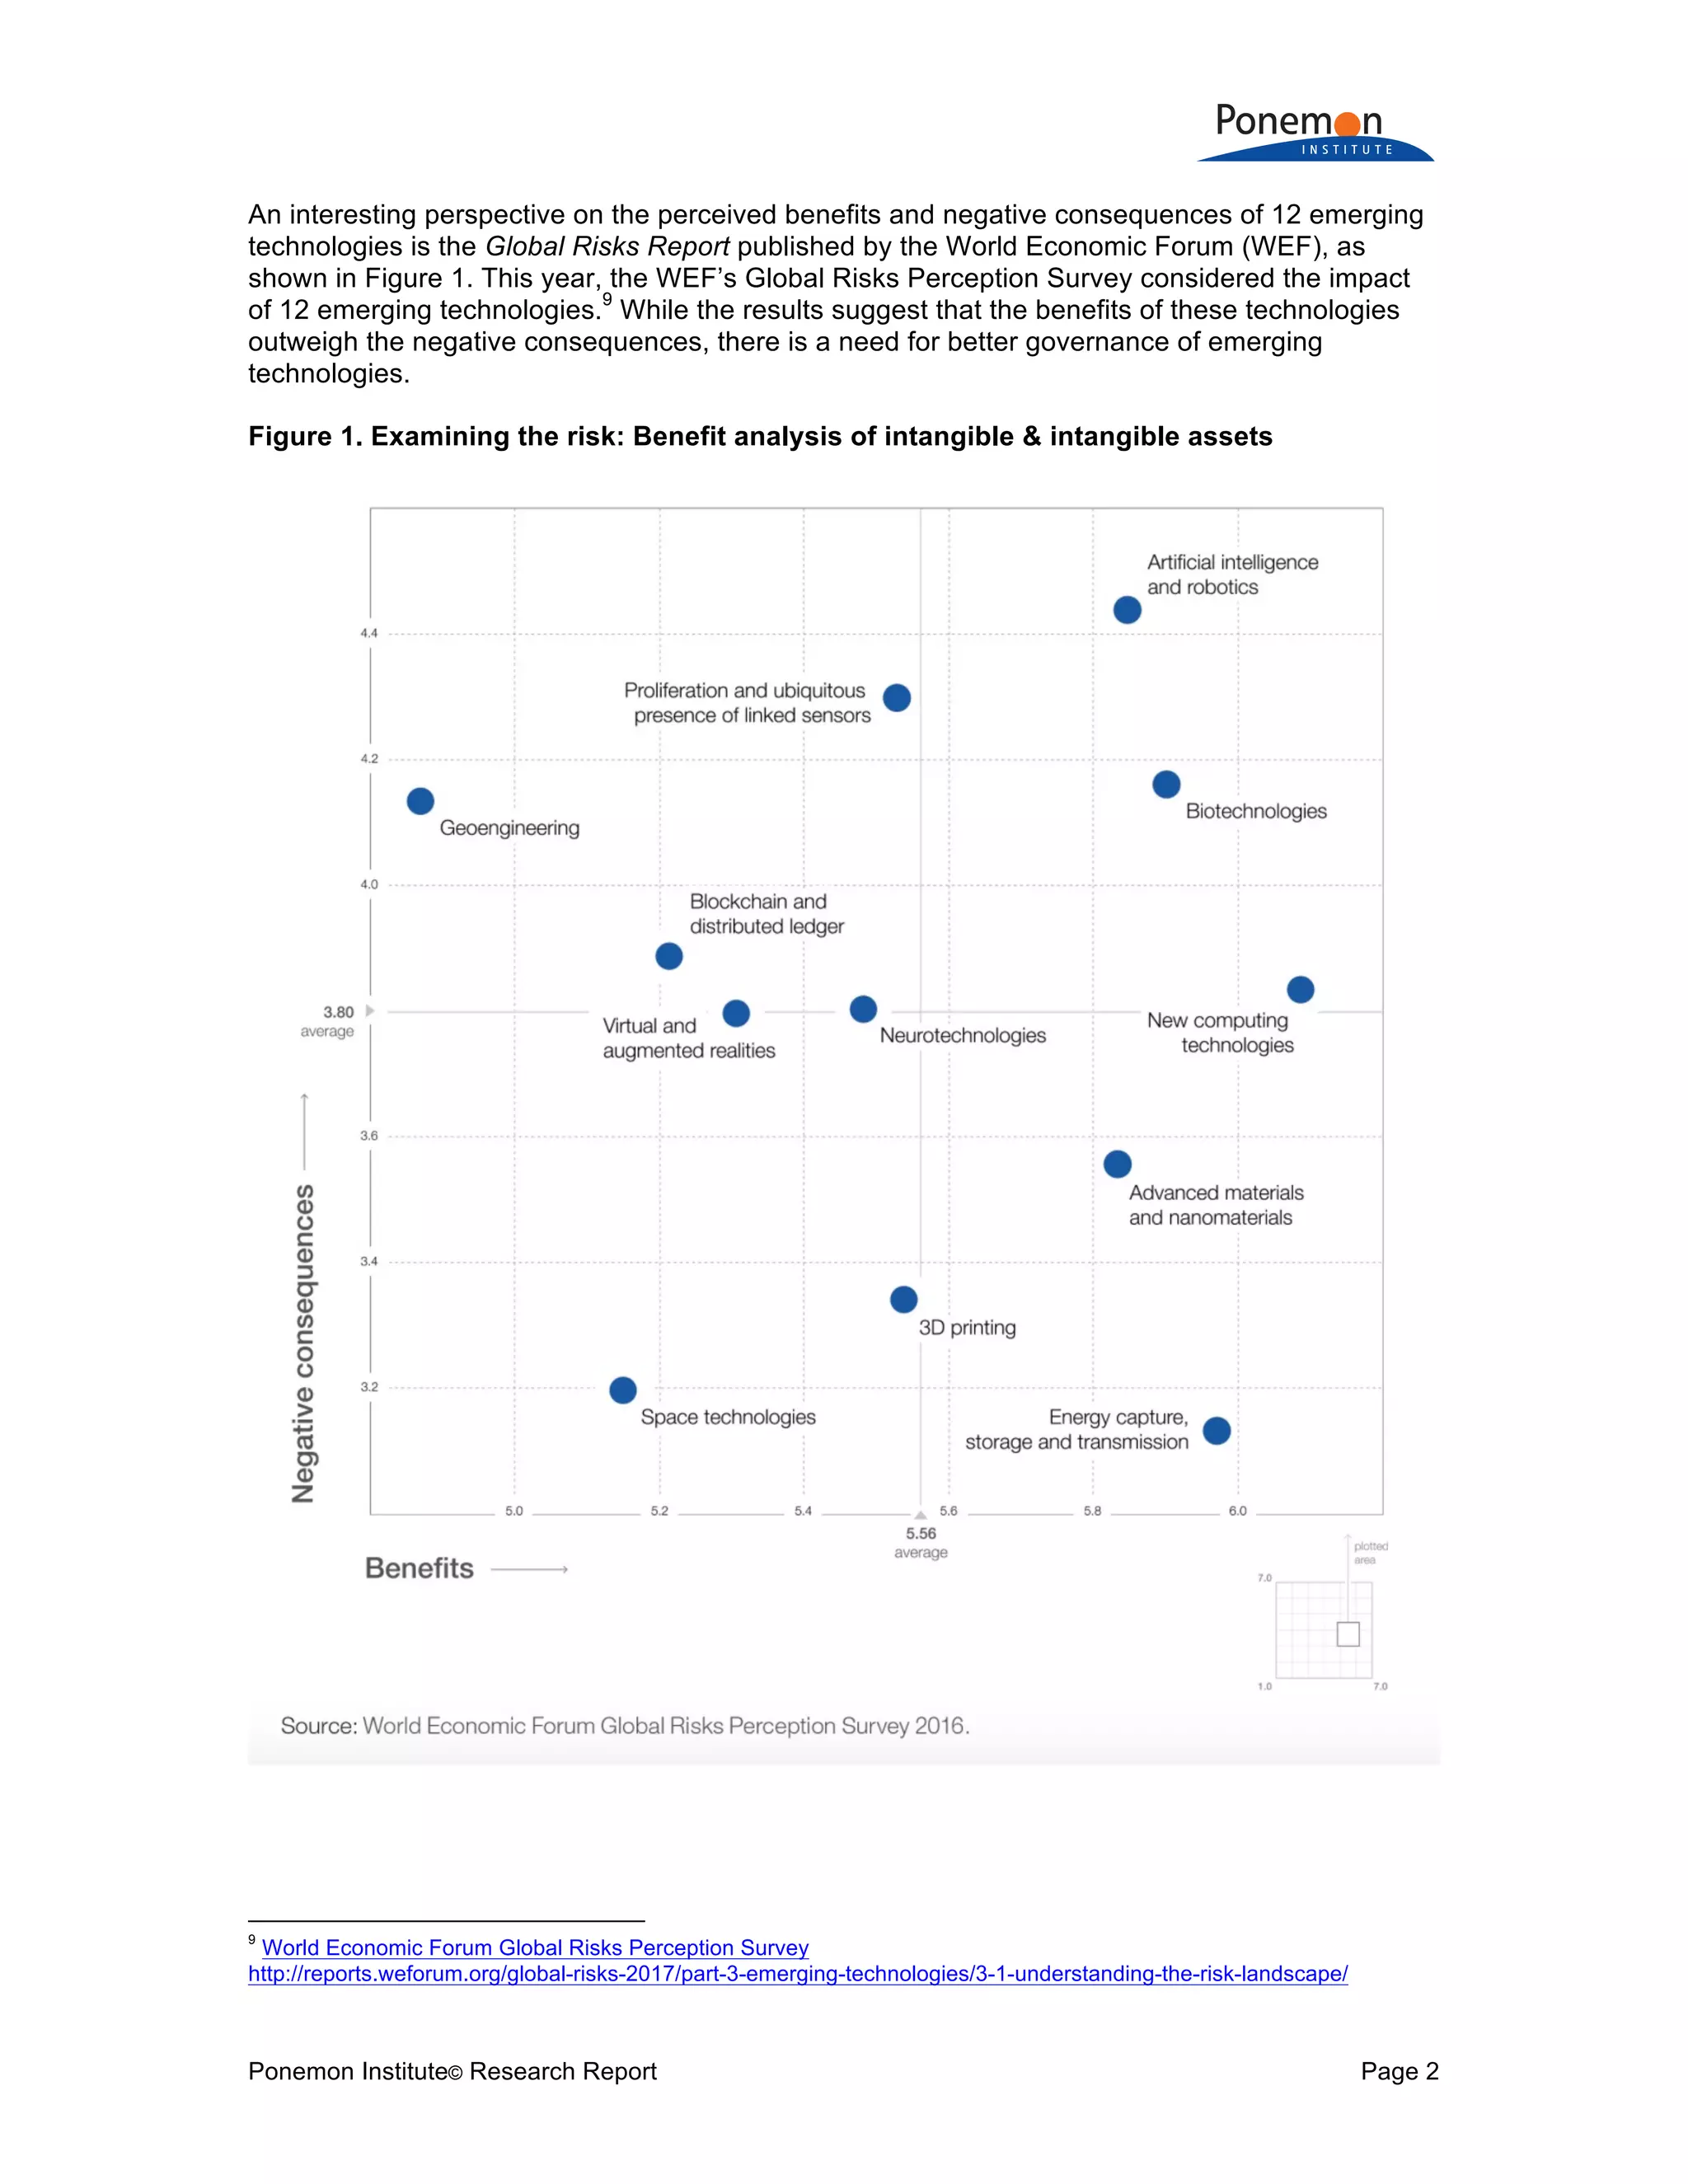
Q19a. Does your company have cyber insurance coverage, including within a
technology Errors & Omission or similar policy not including Property, General Liability
or Crime policy? Global
Yes 24%
No [skip to Q20a] 76%
Total 100%
Q19b. If yes, what limits do you purchase Global
Less than $1 million 7%
$1 million to $5 million 33%
$6 million to $20 million 49%
$21 million to $100 million 7%
More than $100 million 4%
Total 100%
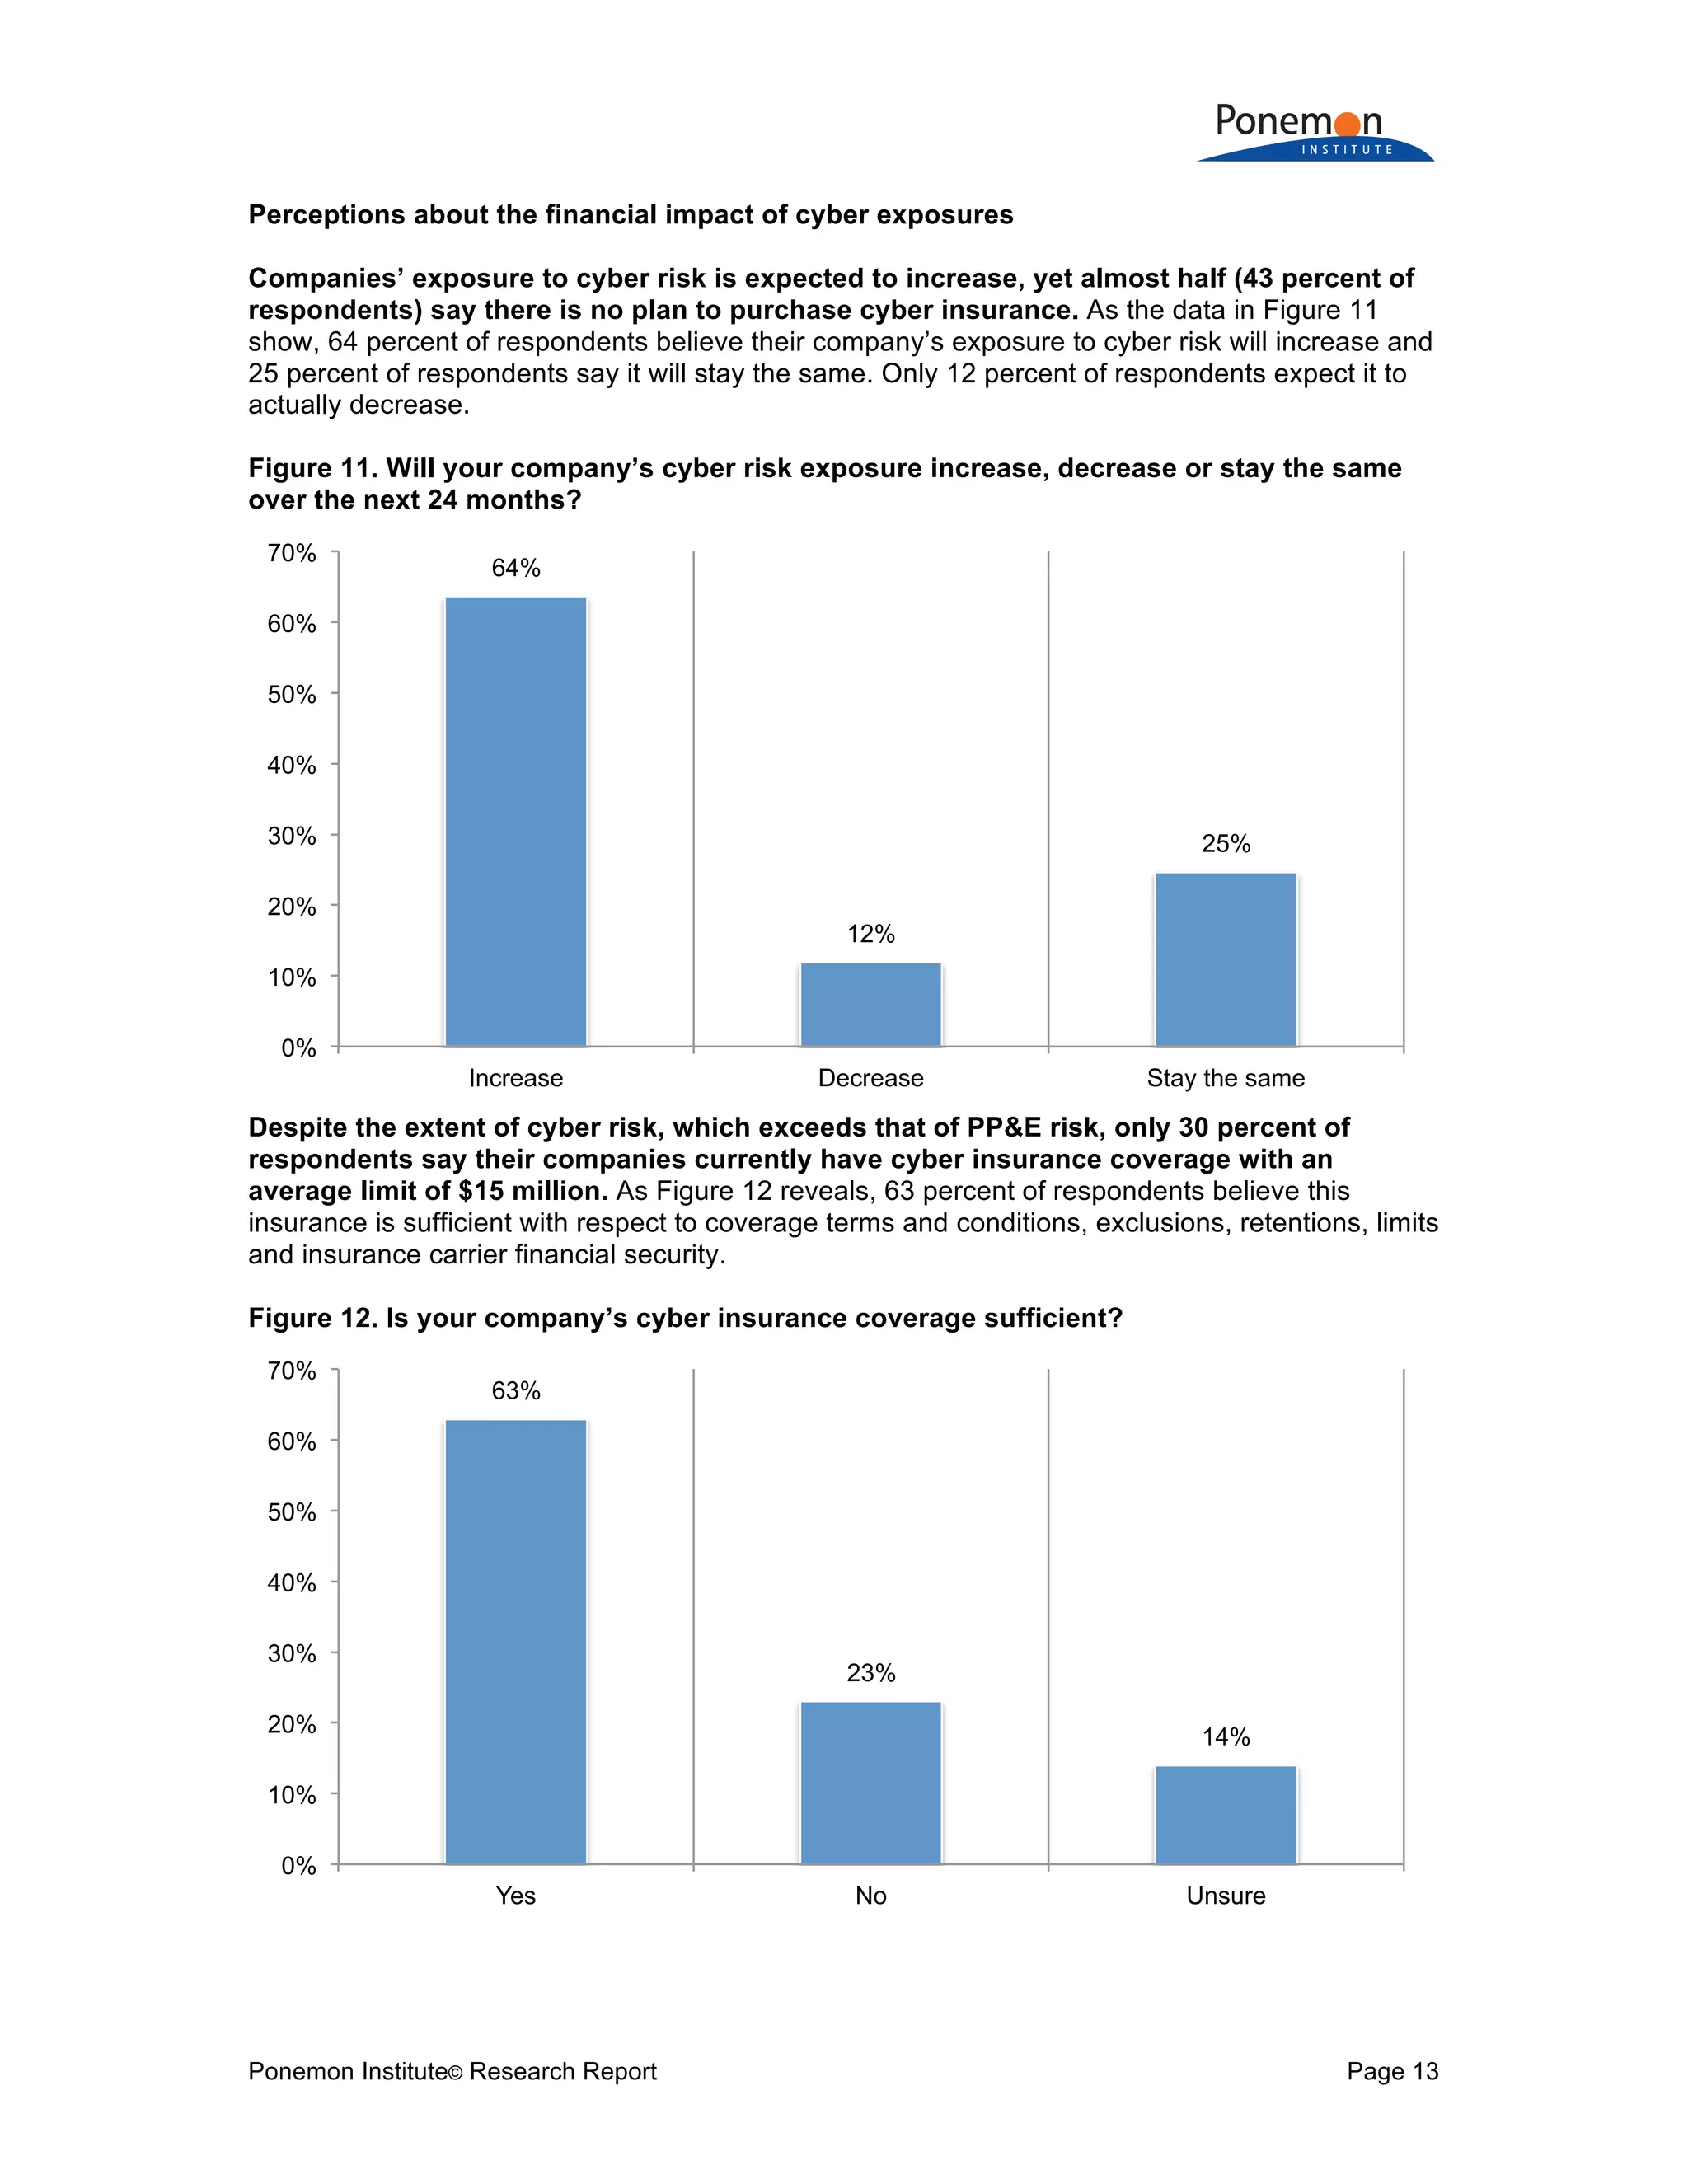
Q19c. Is your company’s cyber insurance coverage sufficient with respect to coverage
terms and conditions, exclusions, retentions, limits and insurance carrier financial
security? Global
Yes 63%
No 23%
Unsure 14%
Total 100%
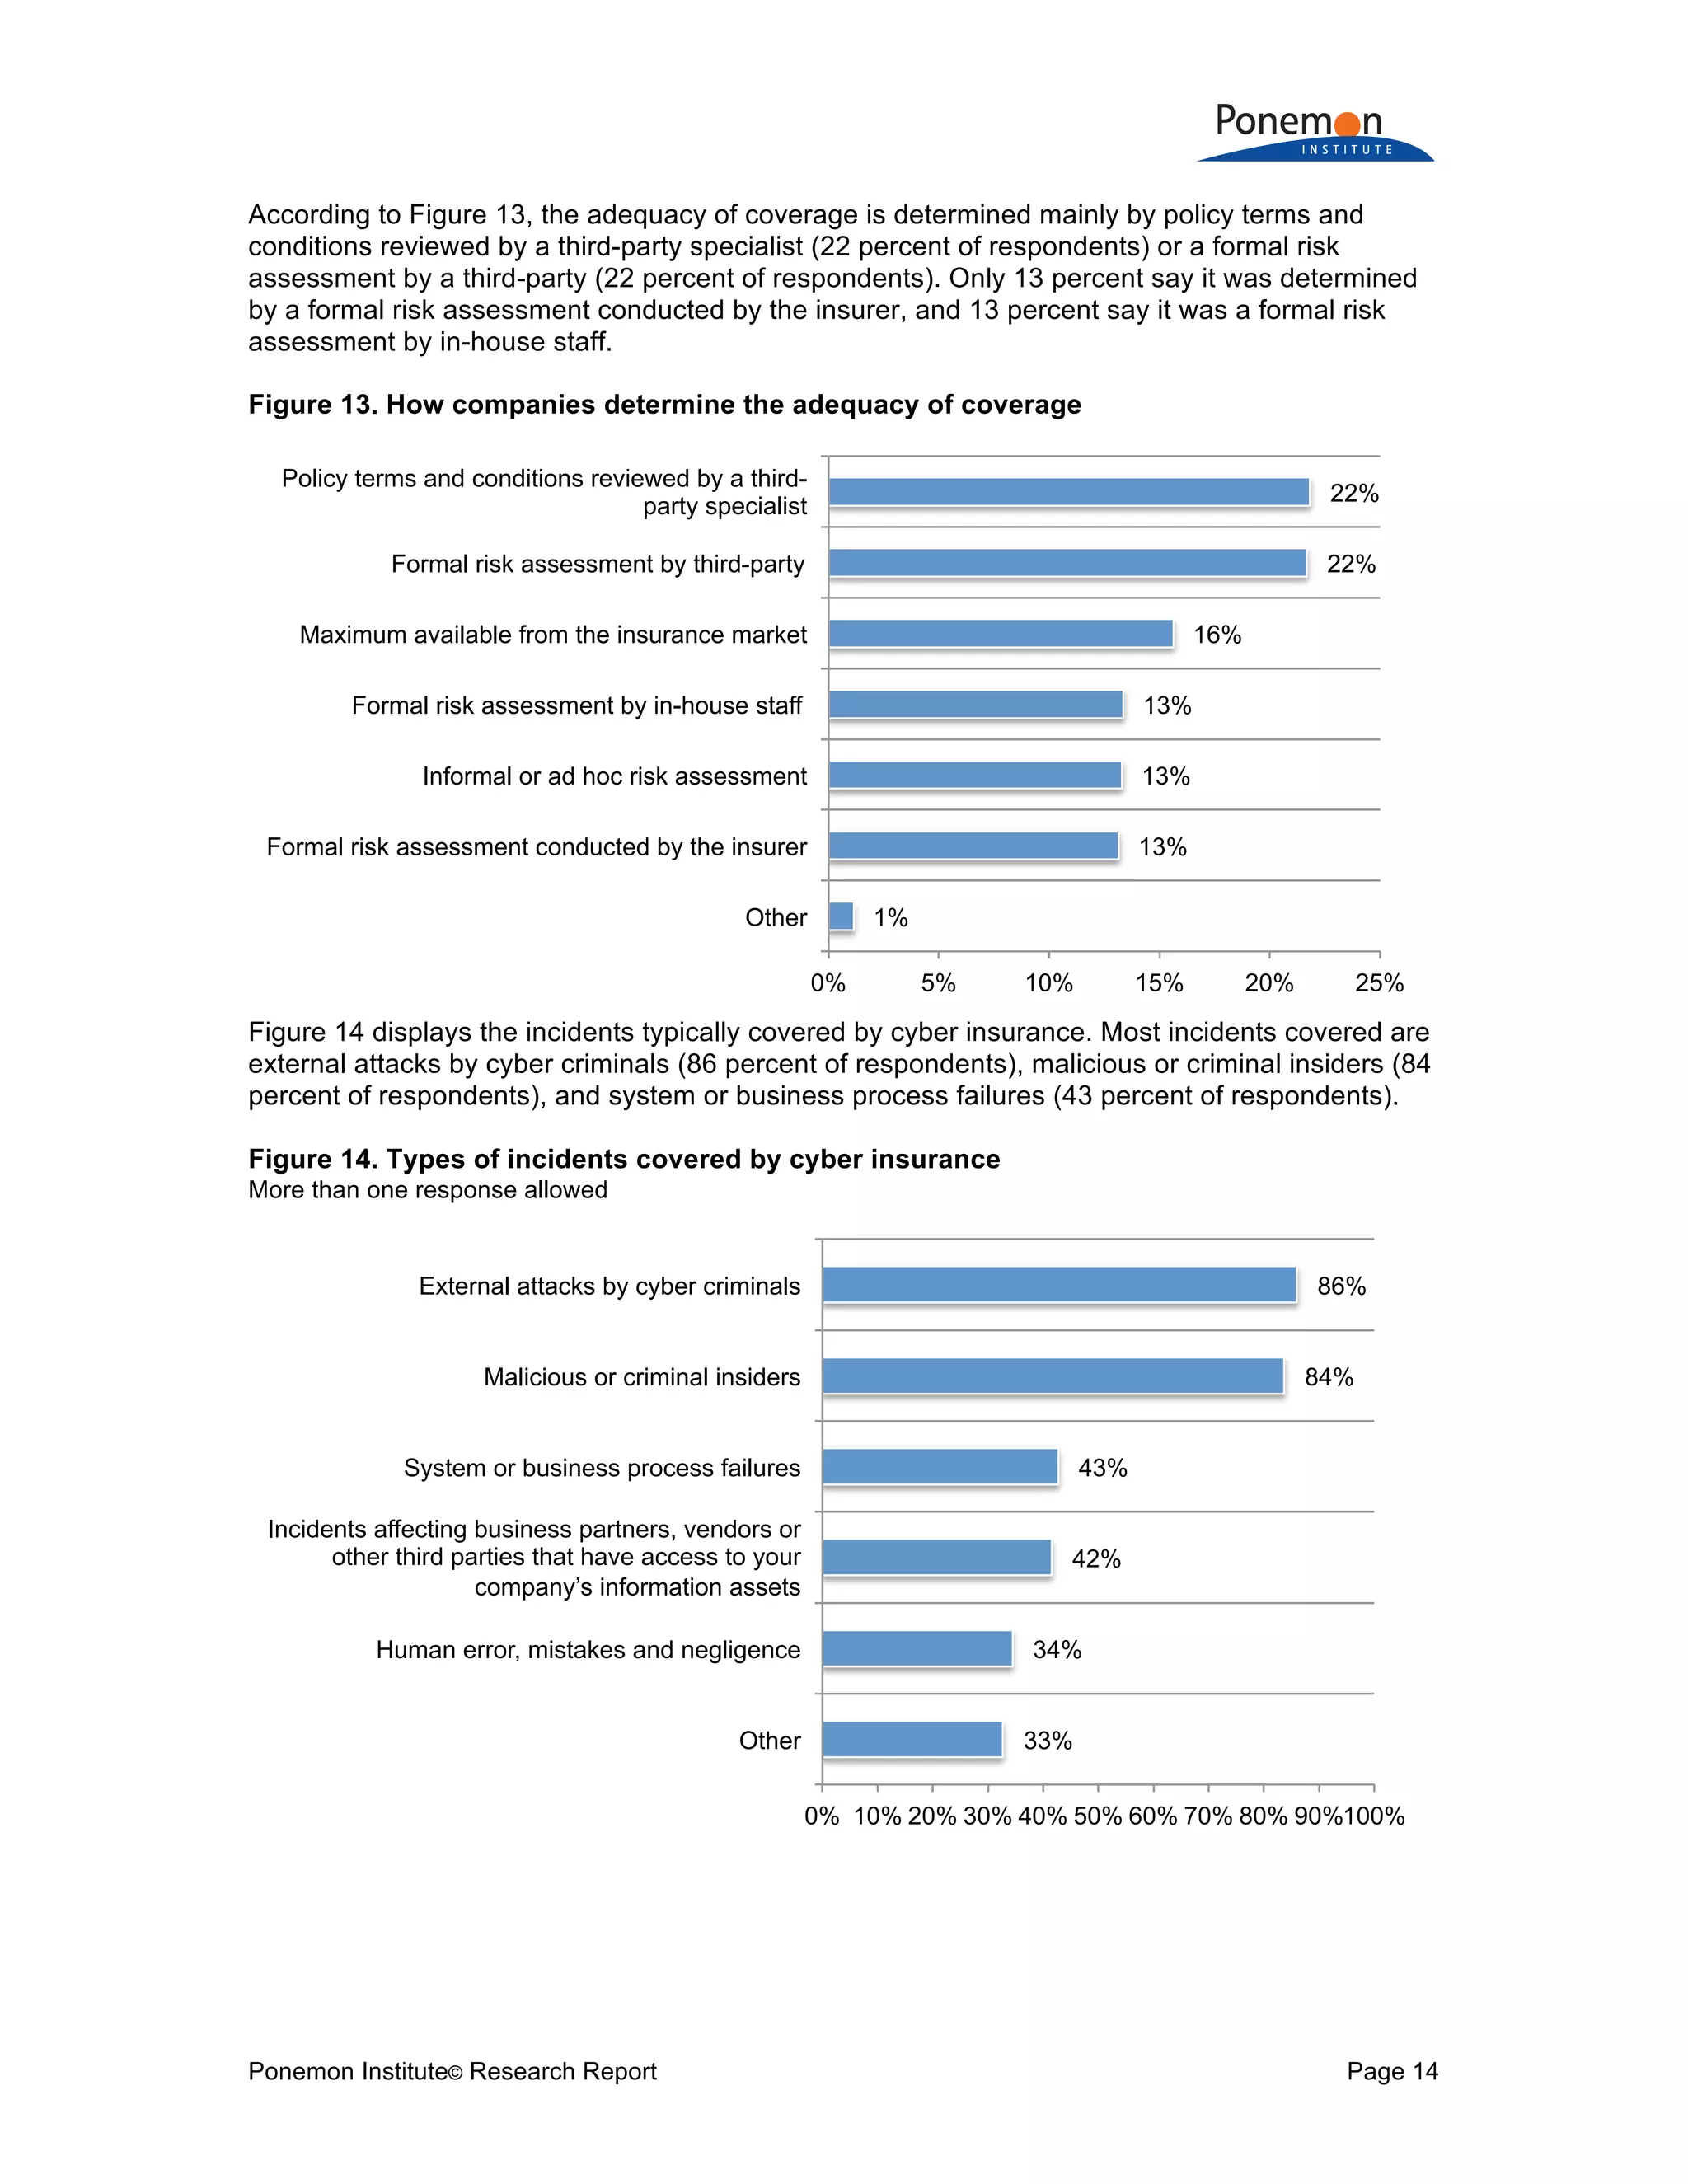
Q19d. How does your company determine the level of coverage it deems adequate? Global
Formal risk assessment by in-house staff 13%
Formal risk assessment conducted by the insurer 13%
Formal risk assessment by third party 22%
Informal or ad hoc risk assessment 13%
Policy terms and conditions reviewed by a third-party specialist 22%
Maximum available from the insurance market 16%
Other 1%
Total 100%
Q19e. What types of incidents does your organization’s cyber insurance cover? Please
select all that apply. Global
External attacks by cyber criminals 86%
Malicious or criminal insiders 84%
System or business process failures 43%
Human error, mistakes and negligence 34%
Incidents affecting business partners, vendors or other third parties that have access to
your company’s information assets 42%
Other 33%
Total 321%](https://image.slidesharecdn.com/2017-global-cyber-risk-transfer-report-final-170505193547/75/2017-global-cyber-risk-transfer-report-final-29-2048.jpg)


![[DSC Europe 25] Jon Dajci - Bridging TradFi and DeFi: Building the Future of ...](https://cdn.slidesharecdn.com/ss_thumbnails/fqmhfvlbqhkihjvqvhmu-7-251211083849-6af7e325-thumbnail.jpg?width=640&height=640&fit=bounds)


![[DSC Europe 25] Nikolay Burlutskiy - Best Practices for Building Enterprise M...](https://cdn.slidesharecdn.com/ss_thumbnails/uirvaiuvq8y1w8hzd9tx-7-251212103249-2619edb4-thumbnail.jpg?width=640&height=640&fit=bounds)
![[DSC Europe 25] Jovan Bogicevic - Legacy to AI-Driven Defense: Transforming D...](https://cdn.slidesharecdn.com/ss_thumbnails/rsarluadt563hntyfc8q-3-251211083849-3e7bc4c0-thumbnail.jpg?width=640&height=640&fit=bounds)

![[DSC Europe 25] Dusan Nesic - Securing Tomorrow’s Infrastructure: Why Cyber-P...](https://cdn.slidesharecdn.com/ss_thumbnails/qikbszfftyowjm2q6duw-1-251211083848-8f2ead6b-thumbnail.jpg?width=640&height=640&fit=bounds)
![[DSC Europe 25] Hans Kleinsman - The Compliance Gearbox: How Tax Tech Mediate...](https://cdn.slidesharecdn.com/ss_thumbnails/dxdytie1toel0hr90bjs-2-251212103250-174fdbe7-thumbnail.jpg?width=640&height=640&fit=bounds)


![[DSC Europe 25] Vladimir Jelic - The AI-Driven Security Shift From Reactive D...](https://cdn.slidesharecdn.com/ss_thumbnails/6g5gj25mtjwayniqem1t-6-251209104645-7a5a5fc6-thumbnail.jpg?width=640&height=640&fit=bounds)
![[DSC Europe 25] Uros Pesic - The Reality of AI in Marketing.pdf](https://cdn.slidesharecdn.com/ss_thumbnails/rtkodnmtycovsllvzsyn-9-251215095918-b0c6bfe3-thumbnail.jpg?width=640&height=640&fit=bounds)
