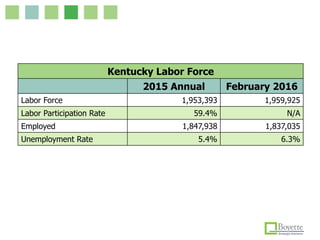
Assessing & Selling Your Workforce
Del Boyette & Kay Stebbins
KAED Spring Conference
4.14.16
What is the #1 factor in
site selection today?
I believe in Rural America because it’s
where the green grass grows.
Workforce
“The continuing war for talent:
Skilled labor availability, typically the
number-one ranked issue annually,
ranked even higher than previous
years. ”
Area Development Corporate Executive Survey, 2016
Workforce is the undisputed
location factor issue.
How To Tell the Best
Workforce Story
I believe in Rural America because it’s
where the green grass grows.
Combine data and
qualitative research to
create a compelling
workforce business case.
Questions You Need to
Know How to Answer
§  How many welders are within a 60-mile
radius?
§  What are the average wages in the
automotive sector?
§  What training programs are available for
metal fabricators and how many completers
do they have annually?
Questions You Need to Know
How to Answer
§  How far are residents willing to commute?
§  What is your underemployment rate?
§  What is the labor participation rate for the
area?
§  How many adults hold an associate’s
degree or higher?
Questions You Need to Know
How to Answer
§  What is your projected population growth?
§  What are your existing employers’ greatest
workforce challenges?
§  What is the average age of your IT
workforce?
§  What are the skill sets of your unemployed
workers?
Questions You Need to Know
How to Answer
Questions To Ask Current
Employers About Their
Workforce
§  What is your overall satisfaction with the
area workforce?
§  What is your annual turnover rate?
§  What is your daily absentee rate?
§  What skills are most important to your
success?
Questions To Ask Current Employers
About Their Workforce
§  From which counties do your employees
commute?
§  What type of training programs would be
beneficial to you?
§  What skill deficits do you see in your
current workforce?
§  What are the most common reasons
employees leave your company?
Questions To Ask Current Employers
About Their Workforce
§  Do you currently employ anyone with a
college degree in a position that does not
require a degree?
§  What is the average length of employment
of your workforce?
§  How would you rate overall employee
availability?
Questions To Ask Current Employers
About Their Workforce
§  How long does it take to fill open positions
in your company?
§  What occupations are most challenging to
fill?
§  Is it challenging to recruit from outside the
region?
§  Is the cost of labor in line with quality
among your workforce?
Questions To Ask Current Employers
About Their Workforce
What You May Need to Know
§  Workforce Skill Sets
§  Key Occupations by Sector
§  Commuting Patterns
§  Projected Job Growth
§  Labor Force and Participation Rate
§  Unemployment and Underemployment
§  Average Wages by Sector and Occupation
What You May Need to Know
§  Occupational Knowledge/Skills/Abilities
§  Skills Gaps
§  Employer Perceptions
§  Resident Needs
§  Available Training Programs
§  Educational Attainment
§  Training Completers
§  Workforce Age
Target
Industries
Educational
Ecosystem
Students/
Completers
Talent
Pipeline
SUCCESS
Workforce Training Inventory
§  Degree Programs
§  Certificate Programs
§  Non-Traditional Programs
§  Concurrent Enrollment Programs
§  Apprenticeships/Internships
§  Customized Training
Kentucky Labor Force
2015 Annual February 2016
Labor Force 1,953,393 1,959,925
Labor Participation Rate 59.4% N/A
Employed 1,847,938 1,837,035
Unemployment Rate 5.4% 6.3%
0
50,000
100,000
150,000
200,000
250,000
300,000
350,000
400,000
Kentucky Employment by Sector
2015 Jobs
2020 Jobs
$33,783
$82,507
$112,082
$60,239
$69,591
$69,164
$30,718
$60,544
$63,329
$77,529
$44,768
$69,451
$116,176
$33,272
$32,488
$54,559
$27,035
$17,727
$28,939
$59,952
$0 $20,000 $40,000 $60,000 $80,000 $100,000 $120,000 $140,000
Crop and Animal Production
Mining, Quarrying, and Oil and Gas Extraction
Utilities
Construction
Manufacturing
Wholesale Trade
Retail Trade
Transportation and Warehousing
Information
Finance and Insurance
Real Estate and Rental and Leasing
Professional, Scientific, and Technical Services
Management of Companies and Enterprises
Administrative and Support and Waste
Educational Services
Health Care and Social Assistance
Arts, Entertainment, and Recreation
Accommodation and Food Services
Other Services (except Public Administration)
Government
Kentucky Earnings by Sector
0 200,000 400,000 600,000 800,000 1,000,000 1,200,000
Less Than 9th Grade
9th Grade to 12th Grade
High School Diploma
Some College
Associate's Degree
Bachelor's Degree
Graduate Degree and Higher
Kentucky Educational Attainment
2020 Population
2015 Population
0
1,000
2,000
3,000
4,000
5,000
6,000
7,000
8,000
9,000
10,000
Skilled Trades Employment in Kentucky
2015 Jobs
2020 Jobs
Prospects Don’t See City
Limits or County Lines
Pikeville Area Labor Force
2015 Annual February 2016
Labor Force 21,264 20,913
Labor Participation Rate 44.3% N/A
Employed 19,016 18,274
Unemployment Rate 10.6% 12.6%
0
2,000
4,000
6,000
8,000
10,000
12,000
14,000
16,000
18,000
20,000
Pikeville Area Employment by Sector
2015 Jobs
2020 Jobs
$47,207
$81,632
$84,178
$47,544
$53,482
$60,524
$28,313
$59,579
$53,991
$49,564
$40,523
$54,072
$63,864
$28,816
$47,378
$52,987
$19,052
$15,569
$30,471
$47,760
$0 $10,000$20,000$30,000$40,000$50,000$60,000$70,000$80,000$90,000
Crop and Animal Production
Mining, Quarrying, and Oil and Gas Extraction
Utilities
Construction
Manufacturing
Wholesale Trade
Retail Trade
Transportation and Warehousing
Information
Finance and Insurance
Real Estate and Rental and Leasing
Professional, Scientific, and Technical Services
Management of Companies and Enterprises
Administrative and Support and Waste
Educational Services
Health Care and Social Assistance
Arts, Entertainment, and Recreation
Accommodation and Food Services
Other Services (except Public Administration)
Government
Pikeville Area Earnings by Sector
•  9,499
Inbound
Commuters
•  11,671
Living and
Working in
Pike County
•  7,271
Outbound
Commuters
Pikeville Area Commuting
0 10,00020,00030,00040,00050,00060,00070,00080,00090,000
Less Than 9th Grade
9th Grade to 12th Grade
High School Diploma
Some College
Associate's Degree
Bachelor's Degree
Graduate Degree and Higher
Pikeville Area Educational Attainment
2020 Population
2015 Population
0
100
200
300
400
500
600
700
800
900
1,000
Skilled Trades Employment in Pikeville Area
2015 Jobs
2020 Jobs
Understanding Your
Workforce is a
Competitive Advantage
Key Messages
§  The Pikeville area is home to more than 3,000
skilled trades workers.
§  More than 7,000 residents commute out of Pike
County each day.
§  With a labor shed that draws from three states,
more than half of the regional workforce is under
the age of 45.
§  Currently, more than 3,000 Pike County residents
are unemployed, many of them highly skilled with
experience in the coal industry.
DO YOU KNOW YOUR
WORKFORCE STORY?
Boye%e	Strategic	Advisors	
Atlanta	§	Li%le	Rock		
	
Boye%eStrategicAdvisors.com

Assessing & Selling Your Workforce