- The document is an investor presentation that provides forward-looking statements and information about risks and uncertainties that could impact financial performance.
- It notes that statements in the presentation regarding prospects, financial performance, dividend growth, management plans and other matters are forward-looking.
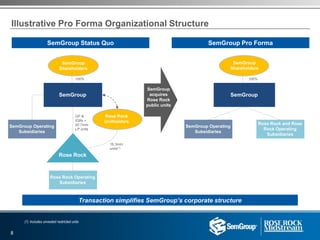
- The presentation directs investors to SEC filings for additional information about the proposed merger between SemGroup and Rose Rock Midstream.