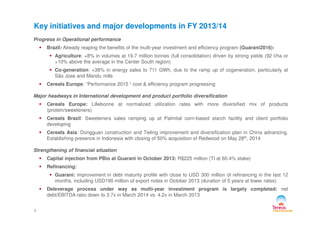
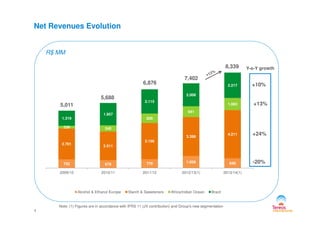
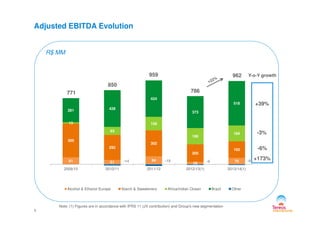
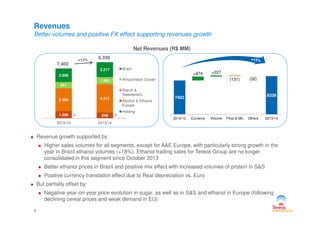
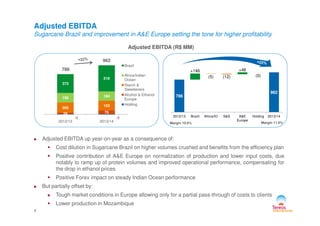
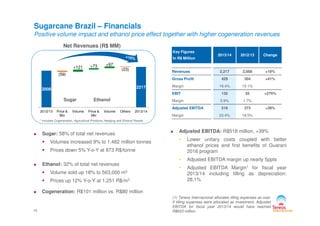
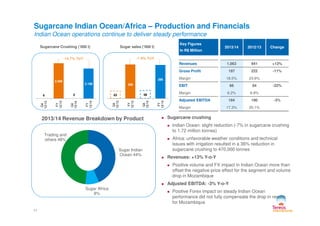
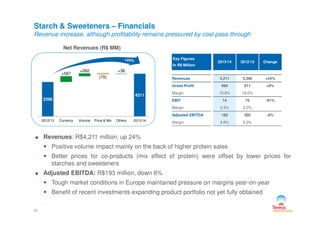
SlideShare a Scribd company logo
1 of 18
Download to read offline
Tereos Internacional
2013/14 Year End Results
São Paulo – June 11th, 2014
Key initiatives and major developments in FY 2013/14
Progress in Operational performance
Brazil: Already reaping the benefits of the multi-year investment and efficiency program (Guarani2016):
Agriculture: +8% in volumes at 19.7 million tonnes (full consolidation) driven by strong yields (92 t/ha or
+10% above the average in the Center South region)
Co-generation: +38% in energy sales to 711 GWh, due to the ramp up of cogeneration, particularly at
São Jose and Mandu mills
Cereals Europe: ”Performance 2015 “ cost & efficiency program progressing
Major headways in International development and product portfolio diversification
Cereals Europe: Lillebonne at normalized utilization rates with more diversified mix of products
(protein/sweeteners)
2
Cereals Brazil: Sweeteners sales ramping up at Palmital corn-based starch facility and client portfolio
developing
Cereals Asia: Dongguan construction and Tieling improvement and diversification plan in China advancing.
Establishing presence in Indonesia with closing of 50% acquisition of Redwood on May 28th, 2014
Strengthening of financial situation
Capital injection from PBio at Guarani in October 2013: R$225 million (TI at 60.4% stake)
Refinancing:
Guarani: improvement in debt maturity profile with close to USD 300 million of refinancing in the last 12
months, including USD190 million of export notes in October 2013 (duration of 5 years at lower rates)
Deleverage process under way as multi-year investment program is largely completed: net
debt/EBITDA ratio down to 3.7x in March 2014 vs. 4.2x in March 2013
Sugar:
Since January’s low, raw sugar prices have increased 21% to 17.8
USD cents/lb in March 31st, mainly on the back of the severe
drought that affected sugarcane fields in Center-South of Brazil.
Since then prices hovering around 18.0-18.5 USD cents/lb
BRL/USD devaluation during the quarter (-5%) improved Brazilian
producers’ remuneration
Starch:
Tensions in Ukraine pushed Matif cereal prices up in Feb/Mar
Q4 2013/14 Market Highlights
14
15
16
17
18
19
20
21
380
410
440
470
500
530
560
590
Apr-13 Jul-13 Oct-13 Jan-14
LIFFE#5 NY#11
US$/MT USD Cts/lb
230
250
270 €/MT
Market demand for both starch and liquid sweeteners slightly better
last quarter but competition in Europe remains fierce
High volatility of cereal prices maintained margins under pressure
during the period
Ethanol:
In Brazil, anhydrous and hydrous ethanol prices increased 10%
and 8% in the quarter on tighter stock as the Center-South region
entered into the intercrop period. Concerns over the 2014/15
crop also contributed to sustain prices
In Europe, FOB Rotterdam prices rebounded 9% during March
from EUR460/m3 to EUR502/m3, on increasing US ethanol
prices, higher feedstock costs and stronger demand
3 Source: Bloomberg
150
170
190
210
230
Apr-13 Jul-13 Oct-13 Jan-14
Corn MATIF Wheat MATIF
400
450
500
550
600
650
700
700
900
1100
1300
1500
1700
1900
Apr-13 Jul-13 Oct-13 Jan-14
Brazil ESALQ Europe Rotterdam
R$/m³ €/m³
941
1.063
1.957
2.115
2.008
2.217
7,402
Net Revenues Evolution
5,688
5,011
6,876
R$ MM
+10%
+13%
Y-o-Y growth8,339
752 678 779 1.056 848
2.701
2.511
3.156
3.396
4.211
239 540
826
941
1.319
1.957
2009/10 2010/11 2011/12 2012/13(1) 2013/14(1)
Alcohol & Ethanol Europe Starch & Sweeteners Africa/Indian Ocean Brazil
Note: (1) Figures are in accordance with IFRS 11 (JV contribution) and Group's new segmentation
4
+24%
-20%
281 428
424
373
518
959
850
786
Adjusted EBITDA Evolution
771
R$ MM
+39%
Y-o-Y growth962
81 51 94
28
75
395
292
302
205
193
13
93
158
190
184
373
-14 -19 -9 -9
2009/10 2010/11 2011/12 2012/13(1) 2013/14(1)
Alcohol & Ethanol Europe Starch & Sweeteners Africa/Indian Ocean Brazil Other
5
-3%
-6%
+173%
Note: (1) Figures are in accordance with IFRS 11 (JV contribution) and Group's new segmentation
0 01.056
3.396 4.211
941
1.063
2.008
2.217 Brazil
Africa/Indian Ocean
Starch &
Sweeteners
Alcohol & Ethanol
Europe
Holding
Revenues
Better volumes and positive FX effect supporting revenues growth
Net Revenues (R$ MM)
7,402
8,339
7402
8339
+874 +227
(131) (32)
0 01.056 848
2012/13 2013/14
Holding
6
Revenue growth supported by:
Higher sales volumes for all segments, except for A&E Europe, with particularly strong growth in the
year in Brazil ethanol volumes (+18%). Ethanol trading sales for Tereos Group are no longer
consolidated in this segment since October 2013
Better ethanol prices in Brazil and positive mix effect with increased volumes of protein in S&S
Positive currency translation effect due to Real depreciation vs. Euro
But partially offset by:
Negative year-on-year price evolution in sugar, as well as in S&S and ethanol in Europe (following
declining cereal prices and weak demand in EU)
2012/13 Currency Volume Price & Mix Others 2013/14
Net Revenues Evolution by Product
March 2013 – 12 Months March 2014 – 12 Months
Sugar
24%
Starch &
Co-products
Alcohol &
Ethanol
20%
Energy
2%
Others
11%
Sugar
22%
Starch &
SweetenersCo-products
Alcohol &
Ethanol
18%
Energy
2%
Others
10%
7
Well-diversified portfolio with relatively stable breakdown
Sugar and Sweeteners remain the major source of revenues for Tereos Internacional
Alcohol & Ethanol remains as the second major activity backed by increased volumes & prices in Brazil
Co-products revenues had a higher contribution in 2013/14 mainly on the back of positive mix effect with
the diversification of production at Lillebonne and the development of protein sales
Energy sales increasing due to the higher co-generation in Brazil
Starch &
Sweeteners
31%
Co-products
12%
Sweeteners
32%
Co-products
16%
786
962
+146
(5) (12)
+48
(0)
28 75
205
193
190 184
373
518
Brazil
Africa/Indian
Ocean
Starch &
Sweeteners
Alcohol & Ethanol
Europe
Holding
Adjusted EBITDA
Sugarcane Brazil and improvement in A&E Europe setting the tone for higher profitability
Adjusted EBITDA (R$ MM)
786
962
2012/13 Brazil Africa/IO S&S A&E
Europe
Holding 2013/14-9 -9
28 75
2012/13 2013/14
8
Adjusted EBITDA up year-on-year as a consequence of:
Cost dilution in Sugarcane Brazil on higher volumes crushed and benefits from the efficiency plan
Positive contribution of A&E Europe on normalization of production and lower input costs, due
notably to ramp up of protein volumes and improved operational performance, compensating for
the drop in ethanol prices
Positive Forex impact on steady Indian Ocean performance
But partially offset by:
Tough market conditions in Europe allowing only for a partial pass-through of costs to clients
Lower production in Mozambique
Margin 11.5%Margin 10.6%
43
514
16
711
Q4
12/13
FY
12/13
Q4
13/14
FY
13/14
143
477
208
563
Q4
12/13
FY
12/13
Q4
13/14
FY
13/14
363
1.357
374
1.482
Q4
12/13
FY
12/13
Q4
13/14
FY
13/14
4,9
16.5
0
18.3
Q4
12/13
FY
12/13
Q4
13/14
FY
13/14
Ethanol Sales (‘000 m³)Sugarcane Crushing (MM t) Sugar Sales (‘000 t)
+9.2% YoY +18.1% YoY
Sugarcane Brazil – Production & Sales
Record Sugarcane Crushing at 19.7 million tonnes
Energy Sales (‘000 MWh)
+38.3% YoY
Crushing
+10.6% YoY
9
Crushing
Higher crushing in 2013/14: 19.7 million tonnes or +8% y-o-y (full consolidation) and 18.3 million tonnes
or +11% y-o-y (without Vertente, on equity consolidation)
Better-than-expected agricultural yields at 92 t/ha vs. 84 t/ha in 2012/13
Improvement in production
Overall production up 10% to 2.5 Mt (expressed in TRS)
Mix: 63% sugar, 37% ethanol vs. 64% / 36% last year
Sugar: 1.5 Mt +9% YoY
Ethanol: 535 k m³ +13% YoY
Progress on cogeneration
Energy sales (including trading) up 38% to 711 GWh, due to the ramp up of cogeneration, particularly at
São Jose and Mandu mills
2008 2217
(59)
+121 +73 +97
(23)
2012/13 Price & Volume Price & Volume Others 2013/14
Sugarcane Brazil – Financials
Positive volume impact and ethanol price effect together with higher cogeneration revenues
Net Revenues (R$ MM)
Sugar Ethanol
Key Figures
In R$ Million
2013/14 2012/13 Change
Revenues 2,217 2,008 +10%
Gross Profit 429 304 +41%
Margin 19.4% 15.1%
EBIT 132 35 +275%
Margin 5.9% 1.7%
Adjusted EBITDA 518 373 +39%
2012/13 Price &
Mix
Volume Price &
Mix
Volume Others 2013/14
* includes Cogeneration, Agricultural Products, Hedging and Ethanol Resale
10
(1) Tereos Internacional allocates tilling expenses as cost.
If tilling expenses were allocated as investment, Adjusted
EBITDA for fiscal year 2013/14 would have reached
R$623 million.
Sugar: 58% of total net revenues
Volumes increased 9% to 1.482 million tonnes
Prices down 5% Y-o-Y at 873 R$/tonne
Ethanol: 32% of total net revenues
Volume sold up 18% to 563,000 m3
Prices up 12% Y-o-Y at 1,251 R$/m3
Cogeneration: R$101 million vs. R$80 million
Adjusted EBITDA: R$518 million, +39%
• Lower unitary costs coupled with better
ethanol prices and first benefits of Guarani
2016 program
• Adjusted EBITDA margin up nearly 5ppts
• Adjusted EBITDA Margin1 for fiscal year
2013/14 including tilling as depreciation:
28.1%
Margin 23.4% 18.5%
63
290
68
286
Q4
12/13
FY
12/13
Q4
13/14
FY
13/14
6
2.566
0
2.188
Q4
12/13
FY
12/13
Q4
13/14
FY
13/14
-14.7% YoY
Sugarcane Indian Ocean/Africa – Production and Financials
Indian Ocean operations continue to deliver steady performance
Sugarcane Crushing (’000 t) Sugar sales (‘000 t)
-1.4% YoY
Key Figures
In R$ Million
2013/14 2012/13 Change
Revenues 1,063 941 +13%
Gross Profit 197 222 -11%
Margin 18.5% 23.6%
EBIT 66 84 -22%
Margin 6.2% 8.9%
Adjusted EBITDA 184 190 -3%
Margin 17.3% 20.1%
11
2013/14 Revenue Breakdown by Product Sugarcane crushing
Indian Ocean: slight reduction (-7% in sugarcane crushing
to 1.72 million tonnes)
Africa: unfavorable weather conditions and technical
issues with irrigation resulted in a 36% reduction in
sugarcane crushing to 470,000 tonnes
Revenues: +13% Y-o-Y
Positive volume and FX impact in Indian Ocean more than
offset the negative price effect for the segment and volume
drop in Mozambique
Adjusted EBITDA: -3% Y-o-Y
Positive Forex impact on steady Indian Ocean
performance did not fully compensate the drop in results
for Mozambique
Sugar Indian
Ocean 44%
Sugar Africa
8%
Trading and
others 48%
129
535
79
423
Q4
12/13
FY
12/13
Q4
13/14
FY
13/14
432
1.738
451
1.772
Q4
12/13
FY
12/13
Q4
13/14
FY
13/14
764
3.151
839
3.298
Q4
12/13
FY
12/13
Q4
13/14
FY
13/14
Cereal Segment - Production and Sales
Higher Grinding on Recovery of Lillebonne Production and Palmital Ramp-up
Cereal Grinding
(‘000 t)
Starch & Sweeteners
Sales (‘000 t)
+4.7% YoY +2.0% YoY
Alcohol & Ethanol
Sales (‘000 m3)
-20.9% YoY
289
1.166
282
1.162
4T
12/13
12M
12/13
4T
13/14
12M
13/14
Co-products Sales
(‘000 t)
-0.3% YoY
Q4
12/13
FY
12/13
Q4
13/14
FY
13/14
Q4
12/13
FY
12/13
Q4
13/14
FY
13/14
Q4
12/13
FY
12/13
Q4
13/14
FY
13/14
12
Grinding in 2013/14: +5% to 3.3 million tonnes, mostly driven by better capacity utilization at Lillebonne,
investments in Marckolsheim and ramp-up of Palmital corn factory in Brazil
Starch & Sweeteners sales: +2% Slight increase in the volume of starch products sold in a
sluggish EU market with strong pressure on prices for
some segments
Alcohol & Ethanol sales: -21% Mostly end of ethanol trading sales for Tereos Group in the 2nd
half
4T
12/13
12M
12/13
4T
13/14
12M
13/14
3396
4211
+567
+282
(70)
+36
Starch & Sweeteners – Financials
Revenue increase, although profitability remains pressured by cost pass-through
Net Revenues (R$ MM)
Key Figures
In R$ Million
2013/14 2012/13 Change
Revenues 4,211 3,396 +24%
Gross Profit 664 611 +9%
Margin 15.8% 18.0%
EBIT 14 75 -81%
Margin 0.3% 2.2%
Adjusted EBITDA 193 205 -6%
2012/13 Currency Volume Price & Mix Others 2013/14
13
Revenues: R$4,211 million, up 24%
Positive volume impact mainly on the back of higher protein sales
Better prices for co-products (mix effect of protein) were offset by lower prices for
starches and sweeteners
Adjusted EBITDA: R$193 million, down 6%
Tough market conditions in Europe maintained pressure on margins year-on-year
Benefit of recent investments expanding product portfolio not yet fully obtained
Adjusted EBITDA 193 205 -6%
Margin 4.6% 6.0%
Alcohol & Ethanol Europe – Financials
Positive performance in the 2nd half led to better results y-o-y. End of trading activity
Net Revenues (R$ MM)
Key Figures
In R$ Million
2013/14 2012/13 Change
Revenues 848 1,056 -20%
Gross Profit 69 51 +36%
Margin 8.1% 4.8%
EBIT 31 (17) -282%
Margin 3.7% (1.6%)
Adjusted EBITDA 75 28 +173%
1056
848
+161
(311) (38) (20)
Revenues: R$848 million, down 20%
Prices: -3.6% for the segment
Lower ethanol trading sales y-o-y
Adjusted EBITDA: R$75 million, up 173%
Lower input prices, due notably to ramp up of
gluten volumes and improved operational
performance, more than offsetting the lower
Rotterdam prices
14
2013/14 Revenue Breakdown by Product
Margin 8.9% 2.6%
Alcohol &
ethanol own
sales 66%
Trading of
ethanol 29%
Others 5%
2012/13 Currency Volume Price & Mix Others 2013/14
Capital Expenditures
Significant CAPEX reduction with the finalization of several investment programs
CAPEX (R$ MM)2013/14 CAPEX Breakdown
Starch &
Sweeteners
21%
Alcohol &
Ethanol
Europe
4%
Africa/Indian
Brazil
63%
1111
885
+24 +8
(149)
(109)
15
Brazil: R$561 million
• Combination of plantation, intercrop costs,
and multi-year investment plan in capacity
and cogeneration (Tanabi)
• 86% of the expansion program completed
Africa/Indian Ocean: R$110 million
• Primarily maintenance for the segment and
plantation in Mozambique
Starch & Sweeteners: R$182 million
• Focused on maintenance of European
facilities and finalization of 1st phase of
investments of Palmital starch facility
Alcohol & Ethanol Europe: R$31 million
• Maintenance of current operations
Africa/Indian
Ocean
12% 2012/13 Brazil Africa/IO S&S A&E
Europe
2013/14
Cash Flow Reconciliation & Debt Composition
Strong deleverage: 3.7x in March 2014 vs. 4.9x in December 2013
Cash Flow
In R$ Million
2013/14
Adjusted EBITDA 962
Working capital variance 288
Financial interests (197)
Others (119)
Operating Cash Flow 934
Recurring Capex (530)
Recurring Cash Flow 404
Debt
In R$ Million
March 31st,
2014
March 31st,
2013
∆
Current 1,522 1,829 -16.8%
Non-current 2,734 2,399 +14.0%
Amortized cost (23) (26)
Total Gross Debt 4,233 4,202 +0.7%
In € 1,413 1,596 -11.5%
In USD 1,890 1,688 +12.0%
In R$ 935 882 +6.0%
16
Net Debt/Adjusted EBITDA: 3.7x vs. 4.2x on March 31st, 2013 and 4.9x sequentially
Refinancing of USD190 million notes at Guarani
Working capital efforts
Currency Effect on Debt: Devaluation of the Real against Euro and USD
Growth Capex (360)
Dividends paid and
received
9
Capital increase 225
Others (78)
Free Cash Flow 200
Others (inc. Forex impact) (444)
Net Debt Variation (244)
In R$ 935 882 +6.0%
Other currencies 19 62 -69.3%
Cash and Cash Equivalent (682) (892) -23.5%
Total Net Debt 3,551 3,310 +7.3%
Related Parties Net Debt 15 13 -
Total Net Debt + Related
Parties
3,566 3,322 +7.3%
Sugarcane Brazil:
Crushing volumes in the next crop expected to be up again, by some 4%, to c. 20.5 million tonnes (full
consolidation basis) to further increase industrial utilization rates, in contrast to Center-South region which is
expected to crush less than last year (current estimates hovering around a 5-10% drop)
Electricity volume to further grow next year, with Tanabi coming on stream
Further unitary cost reduction expected due to the “Guarani 2016” efficiency program and higher crushing
Multi-year investment program in Brazil nearing completion to further reduce Capex level next year
Sugarcane Africa/Indian Ocean:
Sugarcane crushing in Mozambique to recover on the back of higher replanted area in irrigated fields
Cereals:
Outlook
Cereals:
Europe:
“Performance 2015”: progress to continue on the multi-year performance improvement program; economic
conditions expected to remain challenging in the EU and cereal prices to remain volatile
Major development projects completed in Europe, Capex reduced and oriented to energy saving programs/
sustaining activity
Alcohol & Ethanol segment operational performance stabilized at Lillebonne. Normalization of margins with the
end of trading sales activity for Tereos Group. Negative impact of lower ethanol price to remain
International:
Brazil: full year-consolidation of Palmital as sweeteners sales ramp up to improve the product mix, helping as
well to dilute fixed costs
China: Dongguan facility to start ramping up in the second semester
Indonesia: Operational performance improvement and product diversification plan at Redwood to be finalized,
and implementation to begin in the year
17
18

More Related Content

What's hot

Tereos apresentacao 3_t13_eng
Tereos apresentacao 3_t13_engTereos apresentacao 3_t13_eng
Tereos apresentacao 3_t13_engTereosri
 
Tereos 1T 2015/16 Presentation EN
Tereos 1T 2015/16 Presentation ENTereos 1T 2015/16 Presentation EN
Tereos 1T 2015/16 Presentation ENTEREOSIR
 
Q1 1314 earnings release
Q1 1314 earnings releaseQ1 1314 earnings release
Q1 1314 earnings releaseTereosri
 
Acucar Guarani Q3 09/10 Earnings Presentation
Acucar Guarani Q3 09/10 Earnings PresentationAcucar Guarani Q3 09/10 Earnings Presentation
Acucar Guarani Q3 09/10 Earnings PresentationAlexandre Menezio
 
Tereos Internacional Q1 10/11 Earnings Presentation
Tereos Internacional Q1 10/11 Earnings PresentationTereos Internacional Q1 10/11 Earnings Presentation
Tereos Internacional Q1 10/11 Earnings PresentationAlexandre Menezio
 
Acucar Guarani Q1 09/10 Earnings Presentation
Acucar Guarani Q1 09/10 Earnings PresentationAcucar Guarani Q1 09/10 Earnings Presentation
Acucar Guarani Q1 09/10 Earnings PresentationAlexandre Menezio
 
Tereos apresentacao 1_t13_eng
Tereos apresentacao 1_t13_engTereos apresentacao 1_t13_eng
Tereos apresentacao 1_t13_engTereosri
 
BASF analyst conference call Q1 2016
BASF analyst conference call Q1 2016BASF analyst conference call Q1 2016
BASF analyst conference call Q1 2016BASF
 
Speech BASF analyst conference FY-2019
Speech BASF analyst conference FY-2019Speech BASF analyst conference FY-2019
Speech BASF analyst conference FY-2019BASF
 
20110523 ti conf_call_presentation_q4_engl_v2
20110523 ti conf_call_presentation_q4_engl_v220110523 ti conf_call_presentation_q4_engl_v2
20110523 ti conf_call_presentation_q4_engl_v2Tereosri
 
2015 07-29 - Yara International ASA Q2 2015 Report
2015 07-29 - Yara International ASA Q2 2015 Report2015 07-29 - Yara International ASA Q2 2015 Report
2015 07-29 - Yara International ASA Q2 2015 ReportYara International
 
BASF Q4 FY2016
BASF Q4 FY2016BASF Q4 FY2016
BASF Q4 FY2016BASF
 
celanese q2_2005_e
celanese q2_2005_ecelanese q2_2005_e
celanese q2_2005_efinance44
 

What's hot (17)

Tereos apresentacao 3_t13_eng
Tereos apresentacao 3_t13_engTereos apresentacao 3_t13_eng
Tereos apresentacao 3_t13_eng
 
Tereos 1T 2015/16 Presentation EN
Tereos 1T 2015/16 Presentation ENTereos 1T 2015/16 Presentation EN
Tereos 1T 2015/16 Presentation EN
 
Q1 1314 earnings release
Q1 1314 earnings releaseQ1 1314 earnings release
Q1 1314 earnings release
 
Acucar Guarani Q3 09/10 Earnings Presentation
Acucar Guarani Q3 09/10 Earnings PresentationAcucar Guarani Q3 09/10 Earnings Presentation
Acucar Guarani Q3 09/10 Earnings Presentation
 
Tereos Internacional Q1 10/11 Earnings Presentation
Tereos Internacional Q1 10/11 Earnings PresentationTereos Internacional Q1 10/11 Earnings Presentation
Tereos Internacional Q1 10/11 Earnings Presentation
 
Acucar Guarani Q1 09/10 Earnings Presentation
Acucar Guarani Q1 09/10 Earnings PresentationAcucar Guarani Q1 09/10 Earnings Presentation
Acucar Guarani Q1 09/10 Earnings Presentation
 
Tereos apresentacao 1_t13_eng
Tereos apresentacao 1_t13_engTereos apresentacao 1_t13_eng
Tereos apresentacao 1_t13_eng
 
CMD 2013 with notes
CMD 2013 with notesCMD 2013 with notes
CMD 2013 with notes
 
Ethanol production costs
Ethanol production costsEthanol production costs
Ethanol production costs
 
2014 06-18 2Q web report
2014 06-18 2Q web report2014 06-18 2Q web report
2014 06-18 2Q web report
 
BASF analyst conference call Q1 2016
BASF analyst conference call Q1 2016BASF analyst conference call Q1 2016
BASF analyst conference call Q1 2016
 
Cmd 2013 slides only
Cmd 2013 slides onlyCmd 2013 slides only
Cmd 2013 slides only
 
Speech BASF analyst conference FY-2019
Speech BASF analyst conference FY-2019Speech BASF analyst conference FY-2019
Speech BASF analyst conference FY-2019
 
20110523 ti conf_call_presentation_q4_engl_v2
20110523 ti conf_call_presentation_q4_engl_v220110523 ti conf_call_presentation_q4_engl_v2
20110523 ti conf_call_presentation_q4_engl_v2
 
2015 07-29 - Yara International ASA Q2 2015 Report
2015 07-29 - Yara International ASA Q2 2015 Report2015 07-29 - Yara International ASA Q2 2015 Report
2015 07-29 - Yara International ASA Q2 2015 Report
 
BASF Q4 FY2016
BASF Q4 FY2016BASF Q4 FY2016
BASF Q4 FY2016
 
celanese q2_2005_e
celanese q2_2005_ecelanese q2_2005_e
celanese q2_2005_e
 

Similar to 4Q 13/14 Earnings

Tereos apresentacao 4_t12_2013_eng
Tereos apresentacao 4_t12_2013_engTereos apresentacao 4_t12_2013_eng
Tereos apresentacao 4_t12_2013_engTereosri
 
2 q 1213 presentation
2 q 1213 presentation2 q 1213 presentation
2 q 1213 presentationTereosri
 
3 q 1112 presentation
3 q 1112 presentation3 q 1112 presentation
3 q 1112 presentationTereosri
 
Tereos apresentacao 3_t12_eng
Tereos apresentacao 3_t12_engTereos apresentacao 3_t12_eng
Tereos apresentacao 3_t12_engTereosri
 
Confcall earnings release presentation 1 q 1011
Confcall earnings release presentation 1 q 1011Confcall earnings release presentation 1 q 1011
Confcall earnings release presentation 1 q 1011Tereosri
 
3 q 0910 conference call presentation
3 q 0910 conference call presentation3 q 0910 conference call presentation
3 q 0910 conference call presentationTereosri
 
20111115 q2 201112_eng_final
20111115 q2 201112_eng_final20111115 q2 201112_eng_final
20111115 q2 201112_eng_finalTereosri
 
Confcall earnings release presentation 2 q 1112
Confcall earnings release presentation 2 q 1112Confcall earnings release presentation 2 q 1112
Confcall earnings release presentation 2 q 1112Tereosri
 
1 q 0910 conference call presentation
1 q 0910 conference call presentation1 q 0910 conference call presentation
1 q 0910 conference call presentationTereosri
 
2 q 0910 conference call presentation
2 q 0910 conference call presentation2 q 0910 conference call presentation
2 q 0910 conference call presentationTereosri
 
4 q 1112 presentation
4 q 1112 presentation4 q 1112 presentation
4 q 1112 presentationTereosri
 
Conference call presentation 200809
Conference call presentation 200809Conference call presentation 200809
Conference call presentation 200809Tereosri
 
Confcall earnings release presentation 2 q 1011
Confcall earnings release presentation 2 q 1011Confcall earnings release presentation 2 q 1011
Confcall earnings release presentation 2 q 1011Tereosri
 
Confcall earnings release presentation 4 q 1011
Confcall earnings release presentation 4 q 1011Confcall earnings release presentation 4 q 1011
Confcall earnings release presentation 4 q 1011Tereosri
 
20110215 ti conf_call_presentation_q3_engl
20110215 ti conf_call_presentation_q3_engl20110215 ti conf_call_presentation_q3_engl
20110215 ti conf_call_presentation_q3_englTereosri
 
Confcall earnings release presentation 3 q 1011
Confcall earnings release presentation 3 q 1011Confcall earnings release presentation 3 q 1011
Confcall earnings release presentation 3 q 1011Tereosri
 
2015 First Quarter Results - The slides for the analyst presentation
2015 First Quarter Results - The slides for the analyst presentation 2015 First Quarter Results - The slides for the analyst presentation
2015 First Quarter Results - The slides for the analyst presentation Lafarge
 
Edita Food Industries - Results Commentary - 1H2016
Edita Food Industries - Results Commentary  - 1H2016Edita Food Industries - Results Commentary  - 1H2016
Edita Food Industries - Results Commentary - 1H2016Omneya El Hammamy
 
2014 Half-Year Results - The slides for the analyst presentation
2014 Half-Year Results - The slides for the analyst presentation2014 Half-Year Results - The slides for the analyst presentation
2014 Half-Year Results - The slides for the analyst presentationLafarge
 

Similar to 4Q 13/14 Earnings (20)

Tereos apresentacao 4_t12_2013_eng
Tereos apresentacao 4_t12_2013_engTereos apresentacao 4_t12_2013_eng
Tereos apresentacao 4_t12_2013_eng
 
2 q 1213 presentation
2 q 1213 presentation2 q 1213 presentation
2 q 1213 presentation
 
3 q 1112 presentation
3 q 1112 presentation3 q 1112 presentation
3 q 1112 presentation
 
Tereos apresentacao 3_t12_eng
Tereos apresentacao 3_t12_engTereos apresentacao 3_t12_eng
Tereos apresentacao 3_t12_eng
 
Confcall earnings release presentation 1 q 1011
Confcall earnings release presentation 1 q 1011Confcall earnings release presentation 1 q 1011
Confcall earnings release presentation 1 q 1011
 
3 q 0910 conference call presentation
3 q 0910 conference call presentation3 q 0910 conference call presentation
3 q 0910 conference call presentation
 
20111115 q2 201112_eng_final
20111115 q2 201112_eng_final20111115 q2 201112_eng_final
20111115 q2 201112_eng_final
 
Confcall earnings release presentation 2 q 1112
Confcall earnings release presentation 2 q 1112Confcall earnings release presentation 2 q 1112
Confcall earnings release presentation 2 q 1112
 
1 q 0910 conference call presentation
1 q 0910 conference call presentation1 q 0910 conference call presentation
1 q 0910 conference call presentation
 
2 q 0910 conference call presentation
2 q 0910 conference call presentation2 q 0910 conference call presentation
2 q 0910 conference call presentation
 
4 q 1112 presentation
4 q 1112 presentation4 q 1112 presentation
4 q 1112 presentation
 
Conference call presentation 200809
Conference call presentation 200809Conference call presentation 200809
Conference call presentation 200809
 
Confcall earnings release presentation 2 q 1011
Confcall earnings release presentation 2 q 1011Confcall earnings release presentation 2 q 1011
Confcall earnings release presentation 2 q 1011
 
Confcall earnings release presentation 4 q 1011
Confcall earnings release presentation 4 q 1011Confcall earnings release presentation 4 q 1011
Confcall earnings release presentation 4 q 1011
 
20110215 ti conf_call_presentation_q3_engl
20110215 ti conf_call_presentation_q3_engl20110215 ti conf_call_presentation_q3_engl
20110215 ti conf_call_presentation_q3_engl
 
Confcall earnings release presentation 3 q 1011
Confcall earnings release presentation 3 q 1011Confcall earnings release presentation 3 q 1011
Confcall earnings release presentation 3 q 1011
 
Rpc halfyear pres_2013
Rpc halfyear pres_2013Rpc halfyear pres_2013
Rpc halfyear pres_2013
 
2015 First Quarter Results - The slides for the analyst presentation
2015 First Quarter Results - The slides for the analyst presentation 2015 First Quarter Results - The slides for the analyst presentation
2015 First Quarter Results - The slides for the analyst presentation
 
Edita Food Industries - Results Commentary - 1H2016
Edita Food Industries - Results Commentary  - 1H2016Edita Food Industries - Results Commentary  - 1H2016
Edita Food Industries - Results Commentary - 1H2016
 
2014 Half-Year Results - The slides for the analyst presentation
2014 Half-Year Results - The slides for the analyst presentation2014 Half-Year Results - The slides for the analyst presentation
2014 Half-Year Results - The slides for the analyst presentation
 

More from Tereosri

Apresentação Tereos 1T 2015/16
Apresentação Tereos 1T 2015/16Apresentação Tereos 1T 2015/16
Apresentação Tereos 1T 2015/16Tereosri
 
20150213 tereos internacional_presentation_q3_por_final
20150213 tereos internacional_presentation_q3_por_final20150213 tereos internacional_presentation_q3_por_final
20150213 tereos internacional_presentation_q3_por_finalTereosri
 
Conferência Morgan Stanley - Londres
Conferência Morgan Stanley  - LondresConferência Morgan Stanley  - Londres
Conferência Morgan Stanley - LondresTereosri
 
APIMEC 2014
APIMEC 2014APIMEC 2014
APIMEC 2014Tereosri
 
Resultados do 2T 14/15
Resultados do 2T 14/15Resultados do 2T 14/15
Resultados do 2T 14/15Tereosri
 
Resultados do 4T 2013/14
Resultados do 4T 2013/14Resultados do 4T 2013/14
Resultados do 4T 2013/14Tereosri
 
Tereos internacional presentation_port_3_m
Tereos internacional presentation_port_3_mTereos internacional presentation_port_3_m
Tereos internacional presentation_port_3_mTereosri
 
20131113 tereos internacional_presentation_port_final
20131113 tereos internacional_presentation_port_final20131113 tereos internacional_presentation_port_final
20131113 tereos internacional_presentation_port_finalTereosri
 
20131212 reuniao apimec_2013
20131212 reuniao apimec_201320131212 reuniao apimec_2013
20131212 reuniao apimec_2013Tereosri
 
20131113 tereos internacional_presentation_port_final
20131113 tereos internacional_presentation_port_final20131113 tereos internacional_presentation_port_final
20131113 tereos internacional_presentation_port_finalTereosri
 
2 q08 earnings release eng (apresentação)
2 q08 earnings release eng (apresentação)2 q08 earnings release eng (apresentação)
2 q08 earnings release eng (apresentação)Tereosri
 
Divulgação de resultados 2 t08 port (apresentação)
Divulgação de resultados 2 t08 port (apresentação)Divulgação de resultados 2 t08 port (apresentação)
Divulgação de resultados 2 t08 port (apresentação)Tereosri
 
Tereos apresentacao 1_t14_port
Tereos apresentacao 1_t14_portTereos apresentacao 1_t14_port
Tereos apresentacao 1_t14_portTereosri
 
Apresentação teleconferência 200809
Apresentação teleconferência 200809Apresentação teleconferência 200809
Apresentação teleconferência 200809Tereosri
 
Apresentação teleconferência 1 t 0910
Apresentação teleconferência 1 t 0910Apresentação teleconferência 1 t 0910
Apresentação teleconferência 1 t 0910Tereosri
 
Apresentação teleconferência 2 t 0910
Apresentação teleconferência 2 t 0910Apresentação teleconferência 2 t 0910
Apresentação teleconferência 2 t 0910Tereosri
 
Apresentação teleconferência 3 t 0910
Apresentação teleconferência 3 t 0910Apresentação teleconferência 3 t 0910
Apresentação teleconferência 3 t 0910Tereosri
 
Apresentação teleconferência 200910
Apresentação teleconferência 200910Apresentação teleconferência 200910
Apresentação teleconferência 200910Tereosri
 
200910 conference call presentation
200910 conference call presentation200910 conference call presentation
200910 conference call presentationTereosri
 
Apresentação teleconferência resultados 1 t 1011
Apresentação teleconferência resultados 1 t 1011Apresentação teleconferência resultados 1 t 1011
Apresentação teleconferência resultados 1 t 1011Tereosri
 

More from Tereosri (20)

Apresentação Tereos 1T 2015/16
Apresentação Tereos 1T 2015/16Apresentação Tereos 1T 2015/16
Apresentação Tereos 1T 2015/16
 
20150213 tereos internacional_presentation_q3_por_final
20150213 tereos internacional_presentation_q3_por_final20150213 tereos internacional_presentation_q3_por_final
20150213 tereos internacional_presentation_q3_por_final
 
Conferência Morgan Stanley - Londres
Conferência Morgan Stanley  - LondresConferência Morgan Stanley  - Londres
Conferência Morgan Stanley - Londres
 
APIMEC 2014
APIMEC 2014APIMEC 2014
APIMEC 2014
 
Resultados do 2T 14/15
Resultados do 2T 14/15Resultados do 2T 14/15
Resultados do 2T 14/15
 
Resultados do 4T 2013/14
Resultados do 4T 2013/14Resultados do 4T 2013/14
Resultados do 4T 2013/14
 
Tereos internacional presentation_port_3_m
Tereos internacional presentation_port_3_mTereos internacional presentation_port_3_m
Tereos internacional presentation_port_3_m
 
20131113 tereos internacional_presentation_port_final
20131113 tereos internacional_presentation_port_final20131113 tereos internacional_presentation_port_final
20131113 tereos internacional_presentation_port_final
 
20131212 reuniao apimec_2013
20131212 reuniao apimec_201320131212 reuniao apimec_2013
20131212 reuniao apimec_2013
 
20131113 tereos internacional_presentation_port_final
20131113 tereos internacional_presentation_port_final20131113 tereos internacional_presentation_port_final
20131113 tereos internacional_presentation_port_final
 
2 q08 earnings release eng (apresentação)
2 q08 earnings release eng (apresentação)2 q08 earnings release eng (apresentação)
2 q08 earnings release eng (apresentação)
 
Divulgação de resultados 2 t08 port (apresentação)
Divulgação de resultados 2 t08 port (apresentação)Divulgação de resultados 2 t08 port (apresentação)
Divulgação de resultados 2 t08 port (apresentação)
 
Tereos apresentacao 1_t14_port
Tereos apresentacao 1_t14_portTereos apresentacao 1_t14_port
Tereos apresentacao 1_t14_port
 
Apresentação teleconferência 200809
Apresentação teleconferência 200809Apresentação teleconferência 200809
Apresentação teleconferência 200809
 
Apresentação teleconferência 1 t 0910
Apresentação teleconferência 1 t 0910Apresentação teleconferência 1 t 0910
Apresentação teleconferência 1 t 0910
 
Apresentação teleconferência 2 t 0910
Apresentação teleconferência 2 t 0910Apresentação teleconferência 2 t 0910
Apresentação teleconferência 2 t 0910
 
Apresentação teleconferência 3 t 0910
Apresentação teleconferência 3 t 0910Apresentação teleconferência 3 t 0910
Apresentação teleconferência 3 t 0910
 
Apresentação teleconferência 200910
Apresentação teleconferência 200910Apresentação teleconferência 200910
Apresentação teleconferência 200910
 
200910 conference call presentation
200910 conference call presentation200910 conference call presentation
200910 conference call presentation
 
Apresentação teleconferência resultados 1 t 1011
Apresentação teleconferência resultados 1 t 1011Apresentação teleconferência resultados 1 t 1011
Apresentação teleconferência resultados 1 t 1011
 

Recently uploaded

Kenya Coconut Production Presentation by Dr. Lalith Perera
Kenya Coconut Production Presentation by Dr. Lalith PereraKenya Coconut Production Presentation by Dr. Lalith Perera
Kenya Coconut Production Presentation by Dr. Lalith Pereraictsugar
 
Investment in The Coconut Industry by Nancy Cheruiyot
Investment in The Coconut Industry by Nancy CheruiyotInvestment in The Coconut Industry by Nancy Cheruiyot
Investment in The Coconut Industry by Nancy Cheruiyotictsugar
 
Cybersecurity Awareness Training Presentation v2024.03
Cybersecurity Awareness Training Presentation v2024.03Cybersecurity Awareness Training Presentation v2024.03
Cybersecurity Awareness Training Presentation v2024.03DallasHaselhorst
 
Buy gmail accounts.pdf Buy Old Gmail Accounts
Buy gmail accounts.pdf Buy Old Gmail AccountsBuy gmail accounts.pdf Buy Old Gmail Accounts
Buy gmail accounts.pdf Buy Old Gmail AccountsBuy Verified Accounts
 
Contemporary Economic Issues Facing the Filipino Entrepreneur (1).pptx
Contemporary Economic Issues Facing the Filipino Entrepreneur (1).pptxContemporary Economic Issues Facing the Filipino Entrepreneur (1).pptx
Contemporary Economic Issues Facing the Filipino Entrepreneur (1).pptxMarkAnthonyAurellano
 
Call Girls In Connaught Place Delhi ❤️88604**77959_Russian 100% Genuine Escor...
Call Girls In Connaught Place Delhi ❤️88604**77959_Russian 100% Genuine Escor...Call Girls In Connaught Place Delhi ❤️88604**77959_Russian 100% Genuine Escor...
Call Girls In Connaught Place Delhi ❤️88604**77959_Russian 100% Genuine Escor...lizamodels9
 
Flow Your Strategy at Flight Levels Day 2024
Flow Your Strategy at Flight Levels Day 2024Flow Your Strategy at Flight Levels Day 2024
Flow Your Strategy at Flight Levels Day 2024Kirill Klimov
 
8447779800, Low rate Call girls in Uttam Nagar Delhi NCR
8447779800, Low rate Call girls in Uttam Nagar Delhi NCR8447779800, Low rate Call girls in Uttam Nagar Delhi NCR
8447779800, Low rate Call girls in Uttam Nagar Delhi NCRashishs7044
 
BEST Call Girls In Greater Noida ✨ 9773824855 ✨ Escorts Service In Delhi Ncr,
BEST Call Girls In Greater Noida ✨ 9773824855 ✨ Escorts Service In Delhi Ncr,BEST Call Girls In Greater Noida ✨ 9773824855 ✨ Escorts Service In Delhi Ncr,
BEST Call Girls In Greater Noida ✨ 9773824855 ✨ Escorts Service In Delhi Ncr,noida100girls
 
Marketplace and Quality Assurance Presentation - Vincent Chirchir
Marketplace and Quality Assurance Presentation - Vincent ChirchirMarketplace and Quality Assurance Presentation - Vincent Chirchir
Marketplace and Quality Assurance Presentation - Vincent Chirchirictsugar
 
BEST Call Girls In Old Faridabad ✨ 9773824855 ✨ Escorts Service In Delhi Ncr,
BEST Call Girls In Old Faridabad ✨ 9773824855 ✨ Escorts Service In Delhi Ncr,BEST Call Girls In Old Faridabad ✨ 9773824855 ✨ Escorts Service In Delhi Ncr,
BEST Call Girls In Old Faridabad ✨ 9773824855 ✨ Escorts Service In Delhi Ncr,noida100girls
 
International Business Environments and Operations 16th Global Edition test b...
International Business Environments and Operations 16th Global Edition test b...International Business Environments and Operations 16th Global Edition test b...
International Business Environments and Operations 16th Global Edition test b...ssuserf63bd7
 
Market Sizes Sample Report - 2024 Edition
Market Sizes Sample Report - 2024 EditionMarket Sizes Sample Report - 2024 Edition
Market Sizes Sample Report - 2024 EditionMintel Group
 
/:Call Girls In Indirapuram Ghaziabad ➥9990211544 Independent Best Escorts In...
/:Call Girls In Indirapuram Ghaziabad ➥9990211544 Independent Best Escorts In.../:Call Girls In Indirapuram Ghaziabad ➥9990211544 Independent Best Escorts In...
/:Call Girls In Indirapuram Ghaziabad ➥9990211544 Independent Best Escorts In...lizamodels9
 
8447779800, Low rate Call girls in Kotla Mubarakpur Delhi NCR
8447779800, Low rate Call girls in Kotla Mubarakpur Delhi NCR8447779800, Low rate Call girls in Kotla Mubarakpur Delhi NCR
8447779800, Low rate Call girls in Kotla Mubarakpur Delhi NCRashishs7044
 
Annual General Meeting Presentation Slides
Annual General Meeting Presentation SlidesAnnual General Meeting Presentation Slides
Annual General Meeting Presentation SlidesKeppelCorporation
 
Call Girls In Sikandarpur Gurgaon ❤️8860477959_Russian 100% Genuine Escorts I...
Call Girls In Sikandarpur Gurgaon ❤️8860477959_Russian 100% Genuine Escorts I...Call Girls In Sikandarpur Gurgaon ❤️8860477959_Russian 100% Genuine Escorts I...
Call Girls In Sikandarpur Gurgaon ❤️8860477959_Russian 100% Genuine Escorts I...lizamodels9
 
Future Of Sample Report 2024 | Redacted Version
Future Of Sample Report 2024 | Redacted VersionFuture Of Sample Report 2024 | Redacted Version
Future Of Sample Report 2024 | Redacted VersionMintel Group
 
8447779800, Low rate Call girls in Shivaji Enclave Delhi NCR
8447779800, Low rate Call girls in Shivaji Enclave Delhi NCR8447779800, Low rate Call girls in Shivaji Enclave Delhi NCR
8447779800, Low rate Call girls in Shivaji Enclave Delhi NCRashishs7044
 

Recently uploaded (20)

Kenya Coconut Production Presentation by Dr. Lalith Perera
Kenya Coconut Production Presentation by Dr. Lalith PereraKenya Coconut Production Presentation by Dr. Lalith Perera
Kenya Coconut Production Presentation by Dr. Lalith Perera
 
Investment in The Coconut Industry by Nancy Cheruiyot
Investment in The Coconut Industry by Nancy CheruiyotInvestment in The Coconut Industry by Nancy Cheruiyot
Investment in The Coconut Industry by Nancy Cheruiyot
 
Cybersecurity Awareness Training Presentation v2024.03
Cybersecurity Awareness Training Presentation v2024.03Cybersecurity Awareness Training Presentation v2024.03
Cybersecurity Awareness Training Presentation v2024.03
 
Buy gmail accounts.pdf Buy Old Gmail Accounts
Buy gmail accounts.pdf Buy Old Gmail AccountsBuy gmail accounts.pdf Buy Old Gmail Accounts
Buy gmail accounts.pdf Buy Old Gmail Accounts
 
Contemporary Economic Issues Facing the Filipino Entrepreneur (1).pptx
Contemporary Economic Issues Facing the Filipino Entrepreneur (1).pptxContemporary Economic Issues Facing the Filipino Entrepreneur (1).pptx
Contemporary Economic Issues Facing the Filipino Entrepreneur (1).pptx
 
Call Girls In Connaught Place Delhi ❤️88604**77959_Russian 100% Genuine Escor...
Call Girls In Connaught Place Delhi ❤️88604**77959_Russian 100% Genuine Escor...Call Girls In Connaught Place Delhi ❤️88604**77959_Russian 100% Genuine Escor...
Call Girls In Connaught Place Delhi ❤️88604**77959_Russian 100% Genuine Escor...
 
Flow Your Strategy at Flight Levels Day 2024
Flow Your Strategy at Flight Levels Day 2024Flow Your Strategy at Flight Levels Day 2024
Flow Your Strategy at Flight Levels Day 2024
 
8447779800, Low rate Call girls in Uttam Nagar Delhi NCR
8447779800, Low rate Call girls in Uttam Nagar Delhi NCR8447779800, Low rate Call girls in Uttam Nagar Delhi NCR
8447779800, Low rate Call girls in Uttam Nagar Delhi NCR
 
BEST Call Girls In Greater Noida ✨ 9773824855 ✨ Escorts Service In Delhi Ncr,
BEST Call Girls In Greater Noida ✨ 9773824855 ✨ Escorts Service In Delhi Ncr,BEST Call Girls In Greater Noida ✨ 9773824855 ✨ Escorts Service In Delhi Ncr,
BEST Call Girls In Greater Noida ✨ 9773824855 ✨ Escorts Service In Delhi Ncr,
 
Marketplace and Quality Assurance Presentation - Vincent Chirchir
Marketplace and Quality Assurance Presentation - Vincent ChirchirMarketplace and Quality Assurance Presentation - Vincent Chirchir
Marketplace and Quality Assurance Presentation - Vincent Chirchir
 
Corporate Profile 47Billion Information Technology
Corporate Profile 47Billion Information TechnologyCorporate Profile 47Billion Information Technology
Corporate Profile 47Billion Information Technology
 
BEST Call Girls In Old Faridabad ✨ 9773824855 ✨ Escorts Service In Delhi Ncr,
BEST Call Girls In Old Faridabad ✨ 9773824855 ✨ Escorts Service In Delhi Ncr,BEST Call Girls In Old Faridabad ✨ 9773824855 ✨ Escorts Service In Delhi Ncr,
BEST Call Girls In Old Faridabad ✨ 9773824855 ✨ Escorts Service In Delhi Ncr,
 
International Business Environments and Operations 16th Global Edition test b...
International Business Environments and Operations 16th Global Edition test b...International Business Environments and Operations 16th Global Edition test b...
International Business Environments and Operations 16th Global Edition test b...
 
Market Sizes Sample Report - 2024 Edition
Market Sizes Sample Report - 2024 EditionMarket Sizes Sample Report - 2024 Edition
Market Sizes Sample Report - 2024 Edition
 
/:Call Girls In Indirapuram Ghaziabad ➥9990211544 Independent Best Escorts In...
/:Call Girls In Indirapuram Ghaziabad ➥9990211544 Independent Best Escorts In.../:Call Girls In Indirapuram Ghaziabad ➥9990211544 Independent Best Escorts In...
/:Call Girls In Indirapuram Ghaziabad ➥9990211544 Independent Best Escorts In...
 
8447779800, Low rate Call girls in Kotla Mubarakpur Delhi NCR
8447779800, Low rate Call girls in Kotla Mubarakpur Delhi NCR8447779800, Low rate Call girls in Kotla Mubarakpur Delhi NCR
8447779800, Low rate Call girls in Kotla Mubarakpur Delhi NCR
 
Annual General Meeting Presentation Slides
Annual General Meeting Presentation SlidesAnnual General Meeting Presentation Slides
Annual General Meeting Presentation Slides
 
Call Girls In Sikandarpur Gurgaon ❤️8860477959_Russian 100% Genuine Escorts I...
Call Girls In Sikandarpur Gurgaon ❤️8860477959_Russian 100% Genuine Escorts I...Call Girls In Sikandarpur Gurgaon ❤️8860477959_Russian 100% Genuine Escorts I...
Call Girls In Sikandarpur Gurgaon ❤️8860477959_Russian 100% Genuine Escorts I...
 
Future Of Sample Report 2024 | Redacted Version
Future Of Sample Report 2024 | Redacted VersionFuture Of Sample Report 2024 | Redacted Version
Future Of Sample Report 2024 | Redacted Version
 
8447779800, Low rate Call girls in Shivaji Enclave Delhi NCR
8447779800, Low rate Call girls in Shivaji Enclave Delhi NCR8447779800, Low rate Call girls in Shivaji Enclave Delhi NCR
8447779800, Low rate Call girls in Shivaji Enclave Delhi NCR
 

4Q 13/14 Earnings

  • 1. Tereos Internacional 2013/14 Year End Results São Paulo – June 11th, 2014
  • 2. Key initiatives and major developments in FY 2013/14 Progress in Operational performance Brazil: Already reaping the benefits of the multi-year investment and efficiency program (Guarani2016): Agriculture: +8% in volumes at 19.7 million tonnes (full consolidation) driven by strong yields (92 t/ha or +10% above the average in the Center South region) Co-generation: +38% in energy sales to 711 GWh, due to the ramp up of cogeneration, particularly at São Jose and Mandu mills Cereals Europe: ”Performance 2015 “ cost & efficiency program progressing Major headways in International development and product portfolio diversification Cereals Europe: Lillebonne at normalized utilization rates with more diversified mix of products (protein/sweeteners) 2 Cereals Brazil: Sweeteners sales ramping up at Palmital corn-based starch facility and client portfolio developing Cereals Asia: Dongguan construction and Tieling improvement and diversification plan in China advancing. Establishing presence in Indonesia with closing of 50% acquisition of Redwood on May 28th, 2014 Strengthening of financial situation Capital injection from PBio at Guarani in October 2013: R$225 million (TI at 60.4% stake) Refinancing: Guarani: improvement in debt maturity profile with close to USD 300 million of refinancing in the last 12 months, including USD190 million of export notes in October 2013 (duration of 5 years at lower rates) Deleverage process under way as multi-year investment program is largely completed: net debt/EBITDA ratio down to 3.7x in March 2014 vs. 4.2x in March 2013
  • 3. Sugar: Since January’s low, raw sugar prices have increased 21% to 17.8 USD cents/lb in March 31st, mainly on the back of the severe drought that affected sugarcane fields in Center-South of Brazil. Since then prices hovering around 18.0-18.5 USD cents/lb BRL/USD devaluation during the quarter (-5%) improved Brazilian producers’ remuneration Starch: Tensions in Ukraine pushed Matif cereal prices up in Feb/Mar Q4 2013/14 Market Highlights 14 15 16 17 18 19 20 21 380 410 440 470 500 530 560 590 Apr-13 Jul-13 Oct-13 Jan-14 LIFFE#5 NY#11 US$/MT USD Cts/lb 230 250 270 €/MT Market demand for both starch and liquid sweeteners slightly better last quarter but competition in Europe remains fierce High volatility of cereal prices maintained margins under pressure during the period Ethanol: In Brazil, anhydrous and hydrous ethanol prices increased 10% and 8% in the quarter on tighter stock as the Center-South region entered into the intercrop period. Concerns over the 2014/15 crop also contributed to sustain prices In Europe, FOB Rotterdam prices rebounded 9% during March from EUR460/m3 to EUR502/m3, on increasing US ethanol prices, higher feedstock costs and stronger demand 3 Source: Bloomberg 150 170 190 210 230 Apr-13 Jul-13 Oct-13 Jan-14 Corn MATIF Wheat MATIF 400 450 500 550 600 650 700 700 900 1100 1300 1500 1700 1900 Apr-13 Jul-13 Oct-13 Jan-14 Brazil ESALQ Europe Rotterdam R$/m³ €/m³
  • 4. 941 1.063 1.957 2.115 2.008 2.217 7,402 Net Revenues Evolution 5,688 5,011 6,876 R$ MM +10% +13% Y-o-Y growth8,339 752 678 779 1.056 848 2.701 2.511 3.156 3.396 4.211 239 540 826 941 1.319 1.957 2009/10 2010/11 2011/12 2012/13(1) 2013/14(1) Alcohol & Ethanol Europe Starch & Sweeteners Africa/Indian Ocean Brazil Note: (1) Figures are in accordance with IFRS 11 (JV contribution) and Group's new segmentation 4 +24% -20%
  • 5. 281 428 424 373 518 959 850 786 Adjusted EBITDA Evolution 771 R$ MM +39% Y-o-Y growth962 81 51 94 28 75 395 292 302 205 193 13 93 158 190 184 373 -14 -19 -9 -9 2009/10 2010/11 2011/12 2012/13(1) 2013/14(1) Alcohol & Ethanol Europe Starch & Sweeteners Africa/Indian Ocean Brazil Other 5 -3% -6% +173% Note: (1) Figures are in accordance with IFRS 11 (JV contribution) and Group's new segmentation
  • 6. 0 01.056 3.396 4.211 941 1.063 2.008 2.217 Brazil Africa/Indian Ocean Starch & Sweeteners Alcohol & Ethanol Europe Holding Revenues Better volumes and positive FX effect supporting revenues growth Net Revenues (R$ MM) 7,402 8,339 7402 8339 +874 +227 (131) (32) 0 01.056 848 2012/13 2013/14 Holding 6 Revenue growth supported by: Higher sales volumes for all segments, except for A&E Europe, with particularly strong growth in the year in Brazil ethanol volumes (+18%). Ethanol trading sales for Tereos Group are no longer consolidated in this segment since October 2013 Better ethanol prices in Brazil and positive mix effect with increased volumes of protein in S&S Positive currency translation effect due to Real depreciation vs. Euro But partially offset by: Negative year-on-year price evolution in sugar, as well as in S&S and ethanol in Europe (following declining cereal prices and weak demand in EU) 2012/13 Currency Volume Price & Mix Others 2013/14
  • 7. Net Revenues Evolution by Product March 2013 – 12 Months March 2014 – 12 Months Sugar 24% Starch & Co-products Alcohol & Ethanol 20% Energy 2% Others 11% Sugar 22% Starch & SweetenersCo-products Alcohol & Ethanol 18% Energy 2% Others 10% 7 Well-diversified portfolio with relatively stable breakdown Sugar and Sweeteners remain the major source of revenues for Tereos Internacional Alcohol & Ethanol remains as the second major activity backed by increased volumes & prices in Brazil Co-products revenues had a higher contribution in 2013/14 mainly on the back of positive mix effect with the diversification of production at Lillebonne and the development of protein sales Energy sales increasing due to the higher co-generation in Brazil Starch & Sweeteners 31% Co-products 12% Sweeteners 32% Co-products 16%
  • 8. 786 962 +146 (5) (12) +48 (0) 28 75 205 193 190 184 373 518 Brazil Africa/Indian Ocean Starch & Sweeteners Alcohol & Ethanol Europe Holding Adjusted EBITDA Sugarcane Brazil and improvement in A&E Europe setting the tone for higher profitability Adjusted EBITDA (R$ MM) 786 962 2012/13 Brazil Africa/IO S&S A&E Europe Holding 2013/14-9 -9 28 75 2012/13 2013/14 8 Adjusted EBITDA up year-on-year as a consequence of: Cost dilution in Sugarcane Brazil on higher volumes crushed and benefits from the efficiency plan Positive contribution of A&E Europe on normalization of production and lower input costs, due notably to ramp up of protein volumes and improved operational performance, compensating for the drop in ethanol prices Positive Forex impact on steady Indian Ocean performance But partially offset by: Tough market conditions in Europe allowing only for a partial pass-through of costs to clients Lower production in Mozambique Margin 11.5%Margin 10.6%
  • 9. 43 514 16 711 Q4 12/13 FY 12/13 Q4 13/14 FY 13/14 143 477 208 563 Q4 12/13 FY 12/13 Q4 13/14 FY 13/14 363 1.357 374 1.482 Q4 12/13 FY 12/13 Q4 13/14 FY 13/14 4,9 16.5 0 18.3 Q4 12/13 FY 12/13 Q4 13/14 FY 13/14 Ethanol Sales (‘000 m³)Sugarcane Crushing (MM t) Sugar Sales (‘000 t) +9.2% YoY +18.1% YoY Sugarcane Brazil – Production & Sales Record Sugarcane Crushing at 19.7 million tonnes Energy Sales (‘000 MWh) +38.3% YoY Crushing +10.6% YoY 9 Crushing Higher crushing in 2013/14: 19.7 million tonnes or +8% y-o-y (full consolidation) and 18.3 million tonnes or +11% y-o-y (without Vertente, on equity consolidation) Better-than-expected agricultural yields at 92 t/ha vs. 84 t/ha in 2012/13 Improvement in production Overall production up 10% to 2.5 Mt (expressed in TRS) Mix: 63% sugar, 37% ethanol vs. 64% / 36% last year Sugar: 1.5 Mt +9% YoY Ethanol: 535 k m³ +13% YoY Progress on cogeneration Energy sales (including trading) up 38% to 711 GWh, due to the ramp up of cogeneration, particularly at São Jose and Mandu mills
  • 10. 2008 2217 (59) +121 +73 +97 (23) 2012/13 Price & Volume Price & Volume Others 2013/14 Sugarcane Brazil – Financials Positive volume impact and ethanol price effect together with higher cogeneration revenues Net Revenues (R$ MM) Sugar Ethanol Key Figures In R$ Million 2013/14 2012/13 Change Revenues 2,217 2,008 +10% Gross Profit 429 304 +41% Margin 19.4% 15.1% EBIT 132 35 +275% Margin 5.9% 1.7% Adjusted EBITDA 518 373 +39% 2012/13 Price & Mix Volume Price & Mix Volume Others 2013/14 * includes Cogeneration, Agricultural Products, Hedging and Ethanol Resale 10 (1) Tereos Internacional allocates tilling expenses as cost. If tilling expenses were allocated as investment, Adjusted EBITDA for fiscal year 2013/14 would have reached R$623 million. Sugar: 58% of total net revenues Volumes increased 9% to 1.482 million tonnes Prices down 5% Y-o-Y at 873 R$/tonne Ethanol: 32% of total net revenues Volume sold up 18% to 563,000 m3 Prices up 12% Y-o-Y at 1,251 R$/m3 Cogeneration: R$101 million vs. R$80 million Adjusted EBITDA: R$518 million, +39% • Lower unitary costs coupled with better ethanol prices and first benefits of Guarani 2016 program • Adjusted EBITDA margin up nearly 5ppts • Adjusted EBITDA Margin1 for fiscal year 2013/14 including tilling as depreciation: 28.1% Margin 23.4% 18.5%
  • 11. 63 290 68 286 Q4 12/13 FY 12/13 Q4 13/14 FY 13/14 6 2.566 0 2.188 Q4 12/13 FY 12/13 Q4 13/14 FY 13/14 -14.7% YoY Sugarcane Indian Ocean/Africa – Production and Financials Indian Ocean operations continue to deliver steady performance Sugarcane Crushing (’000 t) Sugar sales (‘000 t) -1.4% YoY Key Figures In R$ Million 2013/14 2012/13 Change Revenues 1,063 941 +13% Gross Profit 197 222 -11% Margin 18.5% 23.6% EBIT 66 84 -22% Margin 6.2% 8.9% Adjusted EBITDA 184 190 -3% Margin 17.3% 20.1% 11 2013/14 Revenue Breakdown by Product Sugarcane crushing Indian Ocean: slight reduction (-7% in sugarcane crushing to 1.72 million tonnes) Africa: unfavorable weather conditions and technical issues with irrigation resulted in a 36% reduction in sugarcane crushing to 470,000 tonnes Revenues: +13% Y-o-Y Positive volume and FX impact in Indian Ocean more than offset the negative price effect for the segment and volume drop in Mozambique Adjusted EBITDA: -3% Y-o-Y Positive Forex impact on steady Indian Ocean performance did not fully compensate the drop in results for Mozambique Sugar Indian Ocean 44% Sugar Africa 8% Trading and others 48%
  • 12. 129 535 79 423 Q4 12/13 FY 12/13 Q4 13/14 FY 13/14 432 1.738 451 1.772 Q4 12/13 FY 12/13 Q4 13/14 FY 13/14 764 3.151 839 3.298 Q4 12/13 FY 12/13 Q4 13/14 FY 13/14 Cereal Segment - Production and Sales Higher Grinding on Recovery of Lillebonne Production and Palmital Ramp-up Cereal Grinding (‘000 t) Starch & Sweeteners Sales (‘000 t) +4.7% YoY +2.0% YoY Alcohol & Ethanol Sales (‘000 m3) -20.9% YoY 289 1.166 282 1.162 4T 12/13 12M 12/13 4T 13/14 12M 13/14 Co-products Sales (‘000 t) -0.3% YoY Q4 12/13 FY 12/13 Q4 13/14 FY 13/14 Q4 12/13 FY 12/13 Q4 13/14 FY 13/14 Q4 12/13 FY 12/13 Q4 13/14 FY 13/14 12 Grinding in 2013/14: +5% to 3.3 million tonnes, mostly driven by better capacity utilization at Lillebonne, investments in Marckolsheim and ramp-up of Palmital corn factory in Brazil Starch & Sweeteners sales: +2% Slight increase in the volume of starch products sold in a sluggish EU market with strong pressure on prices for some segments Alcohol & Ethanol sales: -21% Mostly end of ethanol trading sales for Tereos Group in the 2nd half 4T 12/13 12M 12/13 4T 13/14 12M 13/14
  • 13. 3396 4211 +567 +282 (70) +36 Starch & Sweeteners – Financials Revenue increase, although profitability remains pressured by cost pass-through Net Revenues (R$ MM) Key Figures In R$ Million 2013/14 2012/13 Change Revenues 4,211 3,396 +24% Gross Profit 664 611 +9% Margin 15.8% 18.0% EBIT 14 75 -81% Margin 0.3% 2.2% Adjusted EBITDA 193 205 -6% 2012/13 Currency Volume Price & Mix Others 2013/14 13 Revenues: R$4,211 million, up 24% Positive volume impact mainly on the back of higher protein sales Better prices for co-products (mix effect of protein) were offset by lower prices for starches and sweeteners Adjusted EBITDA: R$193 million, down 6% Tough market conditions in Europe maintained pressure on margins year-on-year Benefit of recent investments expanding product portfolio not yet fully obtained Adjusted EBITDA 193 205 -6% Margin 4.6% 6.0%
  • 14. Alcohol & Ethanol Europe – Financials Positive performance in the 2nd half led to better results y-o-y. End of trading activity Net Revenues (R$ MM) Key Figures In R$ Million 2013/14 2012/13 Change Revenues 848 1,056 -20% Gross Profit 69 51 +36% Margin 8.1% 4.8% EBIT 31 (17) -282% Margin 3.7% (1.6%) Adjusted EBITDA 75 28 +173% 1056 848 +161 (311) (38) (20) Revenues: R$848 million, down 20% Prices: -3.6% for the segment Lower ethanol trading sales y-o-y Adjusted EBITDA: R$75 million, up 173% Lower input prices, due notably to ramp up of gluten volumes and improved operational performance, more than offsetting the lower Rotterdam prices 14 2013/14 Revenue Breakdown by Product Margin 8.9% 2.6% Alcohol & ethanol own sales 66% Trading of ethanol 29% Others 5% 2012/13 Currency Volume Price & Mix Others 2013/14
  • 15. Capital Expenditures Significant CAPEX reduction with the finalization of several investment programs CAPEX (R$ MM)2013/14 CAPEX Breakdown Starch & Sweeteners 21% Alcohol & Ethanol Europe 4% Africa/Indian Brazil 63% 1111 885 +24 +8 (149) (109) 15 Brazil: R$561 million • Combination of plantation, intercrop costs, and multi-year investment plan in capacity and cogeneration (Tanabi) • 86% of the expansion program completed Africa/Indian Ocean: R$110 million • Primarily maintenance for the segment and plantation in Mozambique Starch & Sweeteners: R$182 million • Focused on maintenance of European facilities and finalization of 1st phase of investments of Palmital starch facility Alcohol & Ethanol Europe: R$31 million • Maintenance of current operations Africa/Indian Ocean 12% 2012/13 Brazil Africa/IO S&S A&E Europe 2013/14
  • 16. Cash Flow Reconciliation & Debt Composition Strong deleverage: 3.7x in March 2014 vs. 4.9x in December 2013 Cash Flow In R$ Million 2013/14 Adjusted EBITDA 962 Working capital variance 288 Financial interests (197) Others (119) Operating Cash Flow 934 Recurring Capex (530) Recurring Cash Flow 404 Debt In R$ Million March 31st, 2014 March 31st, 2013 ∆ Current 1,522 1,829 -16.8% Non-current 2,734 2,399 +14.0% Amortized cost (23) (26) Total Gross Debt 4,233 4,202 +0.7% In € 1,413 1,596 -11.5% In USD 1,890 1,688 +12.0% In R$ 935 882 +6.0% 16 Net Debt/Adjusted EBITDA: 3.7x vs. 4.2x on March 31st, 2013 and 4.9x sequentially Refinancing of USD190 million notes at Guarani Working capital efforts Currency Effect on Debt: Devaluation of the Real against Euro and USD Growth Capex (360) Dividends paid and received 9 Capital increase 225 Others (78) Free Cash Flow 200 Others (inc. Forex impact) (444) Net Debt Variation (244) In R$ 935 882 +6.0% Other currencies 19 62 -69.3% Cash and Cash Equivalent (682) (892) -23.5% Total Net Debt 3,551 3,310 +7.3% Related Parties Net Debt 15 13 - Total Net Debt + Related Parties 3,566 3,322 +7.3%
  • 17. Sugarcane Brazil: Crushing volumes in the next crop expected to be up again, by some 4%, to c. 20.5 million tonnes (full consolidation basis) to further increase industrial utilization rates, in contrast to Center-South region which is expected to crush less than last year (current estimates hovering around a 5-10% drop) Electricity volume to further grow next year, with Tanabi coming on stream Further unitary cost reduction expected due to the “Guarani 2016” efficiency program and higher crushing Multi-year investment program in Brazil nearing completion to further reduce Capex level next year Sugarcane Africa/Indian Ocean: Sugarcane crushing in Mozambique to recover on the back of higher replanted area in irrigated fields Cereals: Outlook Cereals: Europe: “Performance 2015”: progress to continue on the multi-year performance improvement program; economic conditions expected to remain challenging in the EU and cereal prices to remain volatile Major development projects completed in Europe, Capex reduced and oriented to energy saving programs/ sustaining activity Alcohol & Ethanol segment operational performance stabilized at Lillebonne. Normalization of margins with the end of trading sales activity for Tereos Group. Negative impact of lower ethanol price to remain International: Brazil: full year-consolidation of Palmital as sweeteners sales ramp up to improve the product mix, helping as well to dilute fixed costs China: Dongguan facility to start ramping up in the second semester Indonesia: Operational performance improvement and product diversification plan at Redwood to be finalized, and implementation to begin in the year 17
  • 18. 18