SlideShare a Scribd company logo
1 of 15
Download to read offline
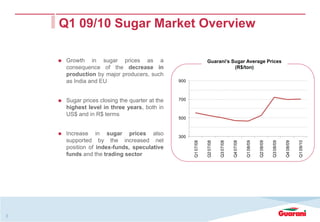
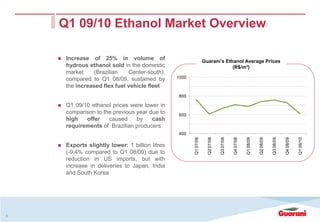
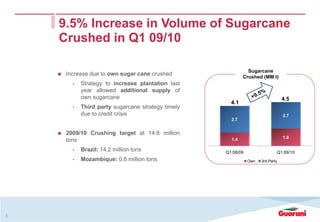
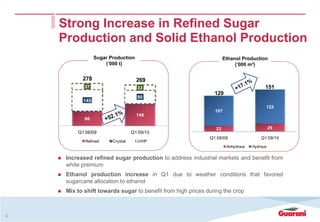
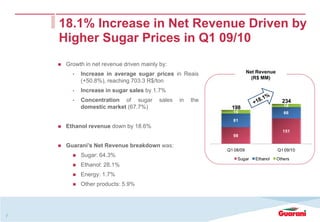
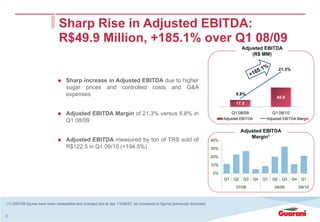
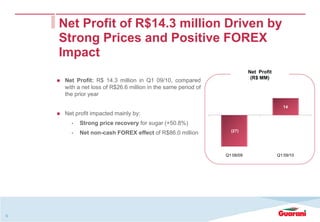
Q1 09/10 Results
August 18th, 2009
Disclaimer
    This presentation contains forward-looking statements related to the prospects of our
    business and estimates for operating and financial results. Those related to growth
    prospects of Açúcar Guarani S.A. are merely projections and, as such, based exclusively on
    the expectations of the management concerning the future of the business. Such forward-
    looking statements depend substantially on changes in market conditions, government
    regulations, competitive pressures, the performance of the Brazilian and international
    economies and the industry and are therefore subject to change without prior notice.


2
Q1 09/10 Sugar Market Overview

     Growth in sugar prices as a                                Guarani’s Sugar Average Prices
     consequence of the decrease in                                        (R$/ton)
     production by major producers, such
     as India and EU                           900


     Sugar prices closing the quarter at the   700
     highest level in three years, both in
     US$ and in R$ terms
                                               500


     Increase in sugar prices also             300
     supported by the increased net


                                                     Q1 07/08


                                                                Q2 07/08


                                                                           Q3 07/08


                                                                                      Q4 07/08


                                                                                                 Q1 08/09


                                                                                                            Q2 08/09


                                                                                                                       Q3 08/09


                                                                                                                                  Q4 08/09


                                                                                                                                             Q1 09/10
     position of index-funds, speculative
     funds and the trading sector


3
Q1 09/10 Ethanol Market Overview

     Increase of 25% in volume of                                 Guarani’s Ethanol Average Prices
     hydrous ethanol sold in the domestic                                      (R$/m³)
     market     (Brazilian   Center-south),
     compared to Q1 08/09, sustained by         1000

     the increased flex fuel vehicle fleet
                                                800

     Q1 09/10 ethanol prices were lower in
     comparison to the previous year due to     600
     high   offer    caused     by    cash
     requirements of Brazilian producers
                                                400


                                                       Q1 07/08


                                                                    Q2 07/08


                                                                               Q3 07/08


                                                                                          Q4 07/08


                                                                                                     Q1 08/09


                                                                                                                Q2 08/09


                                                                                                                           Q3 08/09


                                                                                                                                      Q4 08/09


                                                                                                                                                 Q1 09/10
     Exports slightly lower: 1 billion litres
     (-9.4% compared to Q1 08/09) due to
     reduction in US imports, but with
     increase in deliveries to Japan, India
     and South Korea


4
9.5% Increase in Volume of Sugarcane
    Crushed in Q1 09/10

                                                             Sugarcane
     Increase due to own sugar cane crushed
                                                           Crushed (MM t)
       •   Strategy to increase plantation last
           year allowed additional supply of
           own sugarcane                                                        4.5
                                                     4.1
       •   Third party sugarcane strategy timely
           due to credit crisis                                                 2.7
                                                     2.7


     2009/10 Crushing target at 14.8 million
                                                                                1.8
     tons                                            1.4

       •   Brazil: 14.2 million tons               Q1 08/09                 Q1 09/10
       •   Mozambique: 0.6 million tons                       Own   3rd Party


5
Strong Increase in Refined Sugar
    Production and Solid Ethanol Production
                 Sugar Production                                    Ethanol Production
                     (‘000 t)                                             (‘000 m³)

           278                      269
            37                      33                                                  151
                                                               129
                                    90
           145
                                                                                        122
                                                               107
                                    146
            96

                                                                22                          29
         Q1 08/09                 Q1 09/10
                                                             Q1 08/09                 Q1 09/10
            Refined     Crystal      VHP
                                                                      Anhydrous   Hydrous


     Increased refined sugar production to address industrial markets and benefit from
     white premium
     Ethanol production increase in Q1 due to weather conditions that favored
     sugarcane allocation to ethanol
     Mix to shift towards sugar to benefit from high prices during the crop


6
18.1% Increase in Net Revenue Driven by
    Higher Sugar Prices in Q1 09/10
     Growth in net revenue driven mainly by:
       •   Increase in average sugar prices in Reais                   Net Revenue
                                                                         (R$ MM)
           (+50.8%), reaching 703.3 R$/ton
       •   Increase in sugar sales by 1.7%
       •   Concentration of sugar        sales   in   the                              234
           domestic market (67.7%)                                                      18
                                                              198
                                                              19                        66
                                                              81
     Ethanol revenue down by 18.6%
                                                                                       151
                                                              98

     Guarani’s Net Revenue breakdown was:
                                                            Q1 08/09                 Q1 09/10
           Sugar: 64.3%
                                                                Sugar     Ethanol    Others
           Ethanol: 28.1%
           Energy: 1.7%
           Other products: 5.9%


7
Sharp Rise in Adjusted EBITDA:
                               R$49.9 Million, +185.1% over Q1 08/09
                                                                                                                                           Adjusted EBITDA
                                                                                                                                               (R$ MM)

                                                                                                                           100                                    21.3%          23,0%
                                                                                                                                                                                 21,0%
                                                                                                                            80                                                   19,0%
                                   Sharp increase in Adjusted EBITDA due to higher                                          60
                                                                                                                                                                                 17,0%
                                                                                                                                                                                 15,0%
                                   sugar prices and controlled costs and G&A                                                                                                     13,0%
                                                                                                                            40
                                   expenses                                                                                             8.8%
                                                                                                                                                               49.9
                                                                                                                                                                                 11,0%
                                                                                                                            20                                                   9,0%
                                                                                                                                        17.5                                     7,0%
                                                                                                                             0                                                   5,0%

                                   Adjusted EBITDA Margin of 21.3% versus 8.8% in                                                     Q1 08/09               Q1 09/10
                                                                                                                                 Adjusted EBITDA         Adjusted EBITDA Margin
                                   Q1 08/09
                                                                                                                                           Adjusted EBITDA
                                                                                                                                               Margin1
                                   Adjusted EBITDA measured by ton of TRS sold of                                          40%
                                   R$122.5 in Q1 09/10 (+194.5%)                                                           30%

                                                                                                                           20%

                                                                                                                           10%

                                                                                                                           0%
                                                                                                                                 Q1   Q2    Q3     Q4   Q1   Q2    Q3     Q4    Q1

                                                                                                                                        07/08                 08/09            09/10


(1) 2007/08 figures have been reclassified and changed due to law 11638/07, as compared to figures previously disclosed.


8
Net Profit of R$14.3 million Driven by
    Strong Prices and Positive FOREX
    Impact
                                                                          Net Profit
                                                                           (R$ MM)
     Net Profit: R$ 14.3 million in Q1 09/10, compared
     with a net loss of R$26.6 million in the same period of
     the prior year

                                                                                         14
     Net profit impacted mainly by:
       •   Strong price recovery for sugar (+50.8%)
                                                                 (27)
       •   Net non-cash FOREX effect of R$86.0 million


                                                               Q1 08/09                Q1 09/10


9
Net Debt Up but Improved Indebtedness
     Ratios                                                                     Net Debt
                                                                              per Currency1


     Net debt at R$ 1.1 billion, up 6.4% over the                                BRL
     previous quarter, due to working capital                                    39%

     requirements                                                                            Foreign
                                                                                            Currency
                                                                                              61%
     Short-term debt net of cash and cash-equivalents
     totaled R$ 233.5 million, representing 37% of total
     Net Debt, excluding intercompany loans
                                                           (1) Includes R$112.1 million related to SHL in Mozambique

                                                                                 Net Debt
     The increase in Guarani’s net debt is mainly due to                         per Term1
     increased finished products inventories


     Net Debt/Adjusted EBTIDA ratio at 4.1x in June,                                         Current
                                                                                              37%
     2009 versus 4.3x in March, 09. Excluding                                  Non-
                                                                              Current
     intercompany loans, Net Debt/Adjusted EBITDA                              63%
     ratio stood at 2.4x

                                                           (1) Excludes intercompany loans and cash & cash equivalent


10
CAPEX: Focus on Sugarcane Plantation,
                             Cost Reduction and Efficiency Programs

                                 Continued selectivity on CAPEX: R$52 million in
                                                                                                      CAPEX
                                 Q1 09/10 compared to R$91 million in Q1 08/09                       (R$ MM)1


                                 Focus on plantation CAPEX (R$30 million) to              91
                                 ensure adequate raw material availability and            30
                                 productivity for next crop                                                           52
                                                                                                                      30
                                                                                          61
                                                                                                                      22
                                 Selective industrial CAPEX (R$22 million) to
                                 eliminate bottlenecks and further develop marginal     Q1 08/09                  Q1 09/10
                                 capacity to lower fixed costs at São José and Tanabi          PPE              Planting

                                 plants


                                 CAPEX approved to allow sugar production in
                                 Tanabi as from next crop


1) CAPEX does not consider maintenance.


11
Sugar Market Outlook: Positive Trend in
     08/09 and 09/10 World Crops                                                                                 Raw Sugar Prices
                                                                                                                     (NY 11)
                                                                                                                      cents US$/lb                               cents R$/lb
                                                                               18                                                                                                                                         36
                                                                                                Q109                  Q209                    Q309                        Q409                  Q110
                                                                                                                                                                                                                          33
                                                                               16


                                                       cents US$/lb


                                                                                                                                                                                                                                cents R$/lb
                                                                                                                                                                                                                          30
                                                                               14                                                                                                                                         27
      Global sugar deficit expected    to   continue                           12                                                                                                                                         24
      supporting sugar prices                                                                                                                                                                                             21
                                                                               10
                                                                                                                                                                                                                          18
                                                                                8                                                                                                                                         15


                                                                                    01-Apr-08


                                                                                                                                  01-Oct-08


                                                                                                                                                                                    01-Apr-09
                                                                                                          01-Jul-08


                                                                                                                                                                                                              01-Jul-09
                                                                                                                                                              01-Jan-09
      Brazilian position favoured by lower output of
      major producers such as India, China and EU
                                                       Source: ICE

      Weather driving crop yields in India (drought                                                       World Sugar Balance
      caused by weak Monsoons) and in Brazil (heavy
                                                                                                      Inventories                             Production                       Consumption
      rains during winter)


                                                                                                                                                                                                                                     Production/Consumption (MM ton)
                                                                               60                                                                                                                                         180


                                                        Inventories (MM ton)
                                                                                                                                                                                                                          160
      Strong growth in global demand, unaffected by                            50

      crisis                                                                                                                                                                                                              140

                                                                               40
                                                                                                                                                                                                                          120


                                                                               30                                                                                                                                         100


                                                                                          98/99

                                                                                                  99/00

                                                                                                          00/01

                                                                                                                       01/02

                                                                                                                               02/03

                                                                                                                                              03/04

                                                                                                                                                      04/05

                                                                                                                                                                   05/06

                                                                                                                                                                            06/07

                                                                                                                                                                                    07/08

                                                                                                                                                                                                 08/09E

                                                                                                                                                                                                          09/10E
                                                       Source: LMC


12
Ethanol Market Outlook: Consumption
     Growth Supported by Higher Sales of
     Flex-Fuel Vehicles
     Domestic Market
                                                                               Vehicles Sales per Fuel Type
                                                                                         (Brazil)
        Sustained demand from strong sales of flex fuel                                 Ethanol + Flex-Fuel       Gas + Diesel
     vehicles                                                            350
                                                                                  Q109           Q209      Q309        Q409      Q110
                                                                         300
        Increased hydrous ethanol consumption due to                     250


                                                            '000 units
     the competitive price parity to gasoline at the pump                200
                                                                         150
                                                                         100
       Prices expected to recover beginning in Q2 09/10
                                                                          50
                                                                          0


                                                                               Apr-08


                                                                                                        Oct-08


                                                                                                                              Apr-09
                                                                                             Jul-08


                                                                                                                   Jan-09
     International Market
                                                                               Source: Anfavea


         Increased ethanol prices in the US market due to
     stronger corn, gasoline and oil prices

        Increased exports to Asia and stable sales to the
     European market


13
Outlook: Guarani Solidly Positioned to Seize
     Opportunities and Benefit from a Market Upturn
       Sugarcane crushed expected to reach 14.8 million tons in 2009/10 crop versus 14.4
       million tons in previous crop

       Production mix geared towards sugar to allow Guarani to take advantage of the upturn in
       sugar prices

       Increased demand for ethanol due to attractive ratio between ethanol and gasoline
       prices at the pump. Positive price outlook as of second half of 09/10

       Plants to take advantage of increased volumes and lower fixed costs per ton produced

       Disciplined CAPEX allocation in order to ensure expected sugarcane availability and
       profit from rapid pay-back programs

       Continued focus on balance sheet strengthening

       Positive non-cash effect in P&L of Brazilian Real appreciation vis-à-vis the US Dollar

       Strong commitment and support from Tereos, Guarani’s controlling shareholder, to
       seize opportunities


14
Thank You!

Reynaldo F. Benitez
CFO and Investor Relations Officer

Alexandre L. Menezio
Investor Relations Manager
                                     phone: +55 (11) 3544-4900
Felipe F. Mendes                     e-mail: ri@aguarani.com.br
Investor Relations Analyst
                                     website:www.acucarguarani.com.br/ir
Renato N. Zanetti Neto
Investor Relations Analyst

Leonardo T. Goes
Investor Relations Assistant

More Related Content

Similar to Acucar Guarani Q1 09/10 Earnings Presentation

RIB Report "A Recruiters Guide to Surviving the Downturn"
RIB Report "A Recruiters Guide to Surviving the Downturn"RIB Report "A Recruiters Guide to Surviving the Downturn"
RIB Report "A Recruiters Guide to Surviving the Downturn"tarao
 
Don Roberts: A Global View of Bioenergy Markets and Trends
Don Roberts: A Global View of Bioenergy Markets and TrendsDon Roberts: A Global View of Bioenergy Markets and Trends
Don Roberts: A Global View of Bioenergy Markets and TrendsRights and Resources
 
Iochpe-Maxion - 1Q09 Results Presentation
Iochpe-Maxion - 1Q09 Results PresentationIochpe-Maxion - 1Q09 Results Presentation
Iochpe-Maxion - 1Q09 Results PresentationIochpe-Maxion
 
2 q 0910 conference call presentation
2 q 0910 conference call presentation2 q 0910 conference call presentation
2 q 0910 conference call presentationTereosri
 
Iochpe-Maxion - 3Q09 Presentation
Iochpe-Maxion - 3Q09 PresentationIochpe-Maxion - 3Q09 Presentation
Iochpe-Maxion - 3Q09 PresentationIochpe-Maxion
 
Braskem 2009 results
Braskem 2009 resultsBraskem 2009 results
Braskem 2009 resultsajagger
 
Presentation 2 q10 results
Presentation   2 q10 resultsPresentation   2 q10 results
Presentation 2 q10 resultsBraskem_RI
 
Q1 2009 Earning Report of Occidental Petroleum Corporation
Q1 2009 Earning Report of Occidental Petroleum CorporationQ1 2009 Earning Report of Occidental Petroleum Corporation
Q1 2009 Earning Report of Occidental Petroleum Corporationearningreport earningreport
 
Webcast 1Q09 BR GAAP
Webcast 1Q09 BR GAAPWebcast 1Q09 BR GAAP
Webcast 1Q09 BR GAAPPetrobras
 
1235994360125 02032009
1235994360125 020320091235994360125 02032009
1235994360125 02032009Kaushik Bose
 
Eni Interim Update and 2010 Q2 Results, July 28th 2010
Eni Interim Update and 2010 Q2 Results, July 28th 2010Eni Interim Update and 2010 Q2 Results, July 28th 2010
Eni Interim Update and 2010 Q2 Results, July 28th 2010Eni
 
01 04 2009 I Embraer Day Ny 2009 ApresentaçãO AviaçãO Executiva
01 04 2009 I Embraer Day Ny 2009   ApresentaçãO AviaçãO Executiva01 04 2009 I Embraer Day Ny 2009   ApresentaçãO AviaçãO Executiva
01 04 2009 I Embraer Day Ny 2009 ApresentaçãO AviaçãO ExecutivaEmbraer RI
 
04 01 2009 I Embraer Day 2009 Ny Executive Jets Presentation
04 01 2009 I Embraer Day 2009 Ny   Executive Jets Presentation04 01 2009 I Embraer Day 2009 Ny   Executive Jets Presentation
04 01 2009 I Embraer Day 2009 Ny Executive Jets PresentationEmbraer RI
 
Eni 2008 Results and Strategy Presentation
Eni 2008 Results and Strategy PresentationEni 2008 Results and Strategy Presentation
Eni 2008 Results and Strategy PresentationEni
 
Eni 2010 4Q and Full Year Preliminary Results
Eni 2010 4Q and Full Year Preliminary ResultsEni 2010 4Q and Full Year Preliminary Results
Eni 2010 4Q and Full Year Preliminary ResultsEni
 
newmont mining may_ML_Global_Metals_Mining_Steel_final
newmont mining may_ML_Global_Metals_Mining_Steel_finalnewmont mining may_ML_Global_Metals_Mining_Steel_final
newmont mining may_ML_Global_Metals_Mining_Steel_finalfinance37
 
Webcast 4Q09
Webcast 4Q09Webcast 4Q09
Webcast 4Q09Petrobras
 

Similar to Acucar Guarani Q1 09/10 Earnings Presentation (20)

RIB Report "A Recruiters Guide to Surviving the Downturn"
RIB Report "A Recruiters Guide to Surviving the Downturn"RIB Report "A Recruiters Guide to Surviving the Downturn"
RIB Report "A Recruiters Guide to Surviving the Downturn"
 
Don Roberts: A Global View of Bioenergy Markets and Trends
Don Roberts: A Global View of Bioenergy Markets and TrendsDon Roberts: A Global View of Bioenergy Markets and Trends
Don Roberts: A Global View of Bioenergy Markets and Trends
 
Iochpe-Maxion - 1Q09 Results Presentation
Iochpe-Maxion - 1Q09 Results PresentationIochpe-Maxion - 1Q09 Results Presentation
Iochpe-Maxion - 1Q09 Results Presentation
 
Infinity case study
Infinity case studyInfinity case study
Infinity case study
 
Q1 2009 Earning Report of Eni S.p.A.
Q1 2009 Earning Report of Eni S.p.A.Q1 2009 Earning Report of Eni S.p.A.
Q1 2009 Earning Report of Eni S.p.A.
 
2 q 0910 conference call presentation
2 q 0910 conference call presentation2 q 0910 conference call presentation
2 q 0910 conference call presentation
 
Iochpe-Maxion - 3Q09 Presentation
Iochpe-Maxion - 3Q09 PresentationIochpe-Maxion - 3Q09 Presentation
Iochpe-Maxion - 3Q09 Presentation
 
Braskem 2009 results
Braskem 2009 resultsBraskem 2009 results
Braskem 2009 results
 
Presentation 2 q10 results
Presentation   2 q10 resultsPresentation   2 q10 results
Presentation 2 q10 results
 
Q1 2009 Earning Report of Occidental Petroleum Corporation
Q1 2009 Earning Report of Occidental Petroleum CorporationQ1 2009 Earning Report of Occidental Petroleum Corporation
Q1 2009 Earning Report of Occidental Petroleum Corporation
 
Webcast 1Q09 BR GAAP
Webcast 1Q09 BR GAAPWebcast 1Q09 BR GAAP
Webcast 1Q09 BR GAAP
 
1235994360125 02032009
1235994360125 020320091235994360125 02032009
1235994360125 02032009
 
Eni Interim Update and 2010 Q2 Results, July 28th 2010
Eni Interim Update and 2010 Q2 Results, July 28th 2010Eni Interim Update and 2010 Q2 Results, July 28th 2010
Eni Interim Update and 2010 Q2 Results, July 28th 2010
 
01 04 2009 I Embraer Day Ny 2009 ApresentaçãO AviaçãO Executiva
01 04 2009 I Embraer Day Ny 2009   ApresentaçãO AviaçãO Executiva01 04 2009 I Embraer Day Ny 2009   ApresentaçãO AviaçãO Executiva
01 04 2009 I Embraer Day Ny 2009 ApresentaçãO AviaçãO Executiva
 
04 01 2009 I Embraer Day 2009 Ny Executive Jets Presentation
04 01 2009 I Embraer Day 2009 Ny   Executive Jets Presentation04 01 2009 I Embraer Day 2009 Ny   Executive Jets Presentation
04 01 2009 I Embraer Day 2009 Ny Executive Jets Presentation
 
Eni 2008 Results and Strategy Presentation
Eni 2008 Results and Strategy PresentationEni 2008 Results and Strategy Presentation
Eni 2008 Results and Strategy Presentation
 
OTN - Private Sector Trade Note - vol 6 2011
OTN - Private Sector Trade Note - vol 6 2011OTN - Private Sector Trade Note - vol 6 2011
OTN - Private Sector Trade Note - vol 6 2011
 
Eni 2010 4Q and Full Year Preliminary Results
Eni 2010 4Q and Full Year Preliminary ResultsEni 2010 4Q and Full Year Preliminary Results
Eni 2010 4Q and Full Year Preliminary Results
 
newmont mining may_ML_Global_Metals_Mining_Steel_final
newmont mining may_ML_Global_Metals_Mining_Steel_finalnewmont mining may_ML_Global_Metals_Mining_Steel_final
newmont mining may_ML_Global_Metals_Mining_Steel_final
 
Webcast 4Q09
Webcast 4Q09Webcast 4Q09
Webcast 4Q09
 

Acucar Guarani Q1 09/10 Earnings Presentation

  • 2. Disclaimer This presentation contains forward-looking statements related to the prospects of our business and estimates for operating and financial results. Those related to growth prospects of Açúcar Guarani S.A. are merely projections and, as such, based exclusively on the expectations of the management concerning the future of the business. Such forward- looking statements depend substantially on changes in market conditions, government regulations, competitive pressures, the performance of the Brazilian and international economies and the industry and are therefore subject to change without prior notice. 2
  • 3. Q1 09/10 Sugar Market Overview Growth in sugar prices as a Guarani’s Sugar Average Prices consequence of the decrease in (R$/ton) production by major producers, such as India and EU 900 Sugar prices closing the quarter at the 700 highest level in three years, both in US$ and in R$ terms 500 Increase in sugar prices also 300 supported by the increased net Q1 07/08 Q2 07/08 Q3 07/08 Q4 07/08 Q1 08/09 Q2 08/09 Q3 08/09 Q4 08/09 Q1 09/10 position of index-funds, speculative funds and the trading sector 3
  • 4. Q1 09/10 Ethanol Market Overview Increase of 25% in volume of Guarani’s Ethanol Average Prices hydrous ethanol sold in the domestic (R$/m³) market (Brazilian Center-south), compared to Q1 08/09, sustained by 1000 the increased flex fuel vehicle fleet 800 Q1 09/10 ethanol prices were lower in comparison to the previous year due to 600 high offer caused by cash requirements of Brazilian producers 400 Q1 07/08 Q2 07/08 Q3 07/08 Q4 07/08 Q1 08/09 Q2 08/09 Q3 08/09 Q4 08/09 Q1 09/10 Exports slightly lower: 1 billion litres (-9.4% compared to Q1 08/09) due to reduction in US imports, but with increase in deliveries to Japan, India and South Korea 4
  • 5. 9.5% Increase in Volume of Sugarcane Crushed in Q1 09/10 Sugarcane Increase due to own sugar cane crushed Crushed (MM t) • Strategy to increase plantation last year allowed additional supply of own sugarcane 4.5 4.1 • Third party sugarcane strategy timely due to credit crisis 2.7 2.7 2009/10 Crushing target at 14.8 million 1.8 tons 1.4 • Brazil: 14.2 million tons Q1 08/09 Q1 09/10 • Mozambique: 0.6 million tons Own 3rd Party 5
  • 6. Strong Increase in Refined Sugar Production and Solid Ethanol Production Sugar Production Ethanol Production (‘000 t) (‘000 m³) 278 269 37 33 151 129 90 145 122 107 146 96 22 29 Q1 08/09 Q1 09/10 Q1 08/09 Q1 09/10 Refined Crystal VHP Anhydrous Hydrous Increased refined sugar production to address industrial markets and benefit from white premium Ethanol production increase in Q1 due to weather conditions that favored sugarcane allocation to ethanol Mix to shift towards sugar to benefit from high prices during the crop 6
  • 7. 18.1% Increase in Net Revenue Driven by Higher Sugar Prices in Q1 09/10 Growth in net revenue driven mainly by: • Increase in average sugar prices in Reais Net Revenue (R$ MM) (+50.8%), reaching 703.3 R$/ton • Increase in sugar sales by 1.7% • Concentration of sugar sales in the 234 domestic market (67.7%) 18 198 19 66 81 Ethanol revenue down by 18.6% 151 98 Guarani’s Net Revenue breakdown was: Q1 08/09 Q1 09/10 Sugar: 64.3% Sugar Ethanol Others Ethanol: 28.1% Energy: 1.7% Other products: 5.9% 7
  • 8. Sharp Rise in Adjusted EBITDA: R$49.9 Million, +185.1% over Q1 08/09 Adjusted EBITDA (R$ MM) 100 21.3% 23,0% 21,0% 80 19,0% Sharp increase in Adjusted EBITDA due to higher 60 17,0% 15,0% sugar prices and controlled costs and G&A 13,0% 40 expenses 8.8% 49.9 11,0% 20 9,0% 17.5 7,0% 0 5,0% Adjusted EBITDA Margin of 21.3% versus 8.8% in Q1 08/09 Q1 09/10 Adjusted EBITDA Adjusted EBITDA Margin Q1 08/09 Adjusted EBITDA Margin1 Adjusted EBITDA measured by ton of TRS sold of 40% R$122.5 in Q1 09/10 (+194.5%) 30% 20% 10% 0% Q1 Q2 Q3 Q4 Q1 Q2 Q3 Q4 Q1 07/08 08/09 09/10 (1) 2007/08 figures have been reclassified and changed due to law 11638/07, as compared to figures previously disclosed. 8
  • 9. Net Profit of R$14.3 million Driven by Strong Prices and Positive FOREX Impact Net Profit (R$ MM) Net Profit: R$ 14.3 million in Q1 09/10, compared with a net loss of R$26.6 million in the same period of the prior year 14 Net profit impacted mainly by: • Strong price recovery for sugar (+50.8%) (27) • Net non-cash FOREX effect of R$86.0 million Q1 08/09 Q1 09/10 9
  • 10. Net Debt Up but Improved Indebtedness Ratios Net Debt per Currency1 Net debt at R$ 1.1 billion, up 6.4% over the BRL previous quarter, due to working capital 39% requirements Foreign Currency 61% Short-term debt net of cash and cash-equivalents totaled R$ 233.5 million, representing 37% of total Net Debt, excluding intercompany loans (1) Includes R$112.1 million related to SHL in Mozambique Net Debt The increase in Guarani’s net debt is mainly due to per Term1 increased finished products inventories Net Debt/Adjusted EBTIDA ratio at 4.1x in June, Current 37% 2009 versus 4.3x in March, 09. Excluding Non- Current intercompany loans, Net Debt/Adjusted EBITDA 63% ratio stood at 2.4x (1) Excludes intercompany loans and cash & cash equivalent 10
  • 11. CAPEX: Focus on Sugarcane Plantation, Cost Reduction and Efficiency Programs Continued selectivity on CAPEX: R$52 million in CAPEX Q1 09/10 compared to R$91 million in Q1 08/09 (R$ MM)1 Focus on plantation CAPEX (R$30 million) to 91 ensure adequate raw material availability and 30 productivity for next crop 52 30 61 22 Selective industrial CAPEX (R$22 million) to eliminate bottlenecks and further develop marginal Q1 08/09 Q1 09/10 capacity to lower fixed costs at São José and Tanabi PPE Planting plants CAPEX approved to allow sugar production in Tanabi as from next crop 1) CAPEX does not consider maintenance. 11
  • 12. Sugar Market Outlook: Positive Trend in 08/09 and 09/10 World Crops Raw Sugar Prices (NY 11) cents US$/lb cents R$/lb 18 36 Q109 Q209 Q309 Q409 Q110 33 16 cents US$/lb cents R$/lb 30 14 27 Global sugar deficit expected to continue 12 24 supporting sugar prices 21 10 18 8 15 01-Apr-08 01-Oct-08 01-Apr-09 01-Jul-08 01-Jul-09 01-Jan-09 Brazilian position favoured by lower output of major producers such as India, China and EU Source: ICE Weather driving crop yields in India (drought World Sugar Balance caused by weak Monsoons) and in Brazil (heavy Inventories Production Consumption rains during winter) Production/Consumption (MM ton) 60 180 Inventories (MM ton) 160 Strong growth in global demand, unaffected by 50 crisis 140 40 120 30 100 98/99 99/00 00/01 01/02 02/03 03/04 04/05 05/06 06/07 07/08 08/09E 09/10E Source: LMC 12
  • 13. Ethanol Market Outlook: Consumption Growth Supported by Higher Sales of Flex-Fuel Vehicles Domestic Market Vehicles Sales per Fuel Type (Brazil) Sustained demand from strong sales of flex fuel Ethanol + Flex-Fuel Gas + Diesel vehicles 350 Q109 Q209 Q309 Q409 Q110 300 Increased hydrous ethanol consumption due to 250 '000 units the competitive price parity to gasoline at the pump 200 150 100 Prices expected to recover beginning in Q2 09/10 50 0 Apr-08 Oct-08 Apr-09 Jul-08 Jan-09 International Market Source: Anfavea Increased ethanol prices in the US market due to stronger corn, gasoline and oil prices Increased exports to Asia and stable sales to the European market 13
  • 14. Outlook: Guarani Solidly Positioned to Seize Opportunities and Benefit from a Market Upturn Sugarcane crushed expected to reach 14.8 million tons in 2009/10 crop versus 14.4 million tons in previous crop Production mix geared towards sugar to allow Guarani to take advantage of the upturn in sugar prices Increased demand for ethanol due to attractive ratio between ethanol and gasoline prices at the pump. Positive price outlook as of second half of 09/10 Plants to take advantage of increased volumes and lower fixed costs per ton produced Disciplined CAPEX allocation in order to ensure expected sugarcane availability and profit from rapid pay-back programs Continued focus on balance sheet strengthening Positive non-cash effect in P&L of Brazilian Real appreciation vis-à-vis the US Dollar Strong commitment and support from Tereos, Guarani’s controlling shareholder, to seize opportunities 14
  • 15. Thank You! Reynaldo F. Benitez CFO and Investor Relations Officer Alexandre L. Menezio Investor Relations Manager phone: +55 (11) 3544-4900 Felipe F. Mendes e-mail: ri@aguarani.com.br Investor Relations Analyst website:www.acucarguarani.com.br/ir Renato N. Zanetti Neto Investor Relations Analyst Leonardo T. Goes Investor Relations Assistant