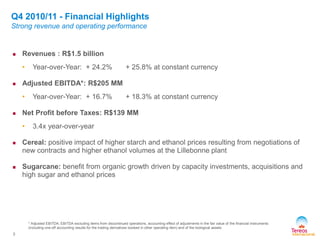
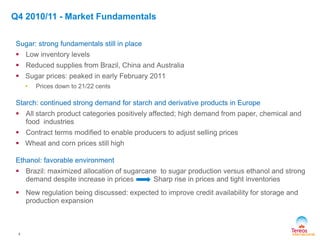
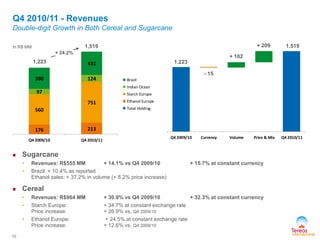
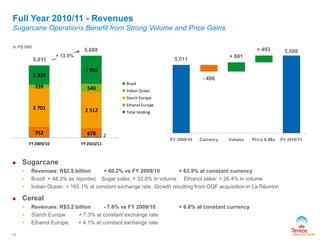
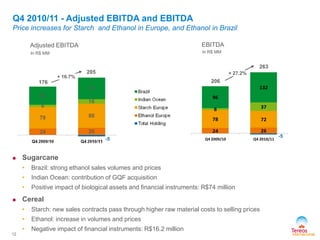
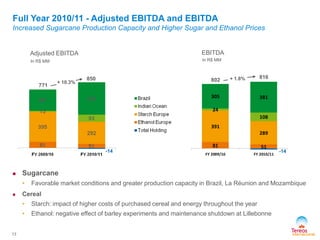
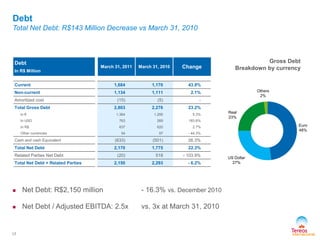
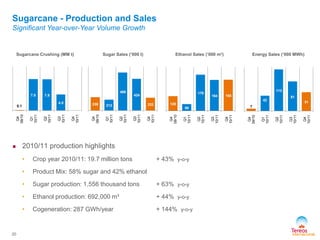
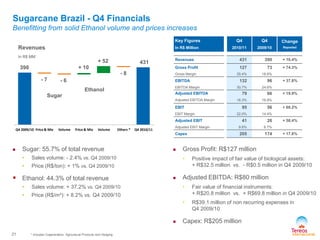
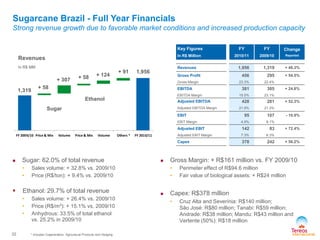
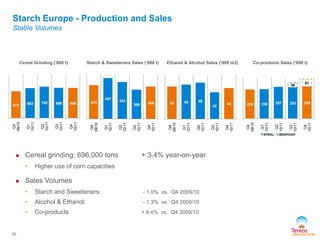
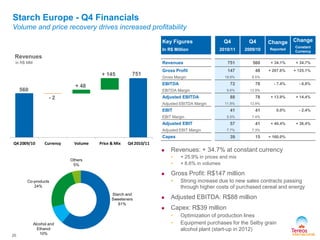
Tereos Internacional
Fourth Quarter and Full Year 2010/11 Results
São Paulo - May 24, 2011
Highlights
Q4 and FY 2010/11 Financial Results
Operating Segment Review
Outlook and Summary
3
* Adjusted EBITDA: EBITDA excluding items from discontinued operations, accounting effect of adjustments in the fair value of the financial instruments
(including one-off accounting results for the trading derivatives booked in other operating item) and of the biological assets
 Revenues : R$1.5 billion
• Year-over-Year: + 24.2% + 25.8% at constant currency
 Adjusted EBITDA*: R$205 MM
• Year-over-Year: + 16.7% + 18.3% at constant currency
 Net Profit before Taxes: R$139 MM
• 3.4x year-over-year
 Cereal: positive impact of higher starch and ethanol prices resulting from negotiations of
new contracts and higher ethanol volumes at the Lillebonne plant
 Sugarcane: benefit from organic growth driven by capacity investments, acquisitions and
high sugar and ethanol prices
Q4 2010/11 - Financial Highlights
Strong revenue and operating performance
Q4 2010/11 - Market Fundamentals
4
Sugar: strong fundamentals still in place
 Low inventory levels
 Reduced supplies from Brazil, China and Australia
 Sugar prices: peaked in early February 2011
• Prices down to 21/22 cents
Starch: continued strong demand for starch and derivative products in Europe
 All starch product categories positively affected; high demand from paper, chemical and
food industries
 Contract terms modified to enable producers to adjust selling prices
 Wheat and corn prices still high
Ethanol: favorable environment
 Brazil: maximized allocation of sugarcane to sugar production versus ethanol and strong
demand despite increase in prices Sharp rise in prices and tight inventories
 New regulation being discussed: expected to improve credit availability for storage and
production expansion
 March 2010 – DVO’s is accredited for its cereal premium alcohol
 April 2010 – Partnership with Petrobras Biocombustivel with a capital increase of R$1.6 billion
 May 2010 – Mandu’s acquisition (3,5 million tons): R$345 million
 May 2010 – Inauguration of Tanabi sugar factory
 May 2010 – Inauguration of Andrade cogeneration facility (joint venture with GDF Suez)
 June 2010 – Refinancing of €450 million for the Tereos EU
 August 2010 – Conclusion of an ethanol commercialization agreement with BR for 2.2 million
m3 over 4 years
 August 2010 – Launch of the Selby distillery project in the UK for the premium alcohols sector
 November 2010 – Launch of the gluten project in BENP Lillebonne
5
Main Events 2010/11
Sugarcane and Starch
 February – Announcement of the Brazilian starch project of R$230 MM
 March 2011 – Guarani: US$560 million debt refinancing
 March 2011 – R$764 million new BNDES financing
 March 2011 – Launch of R$767 million investment plan in expansion of crushing capacity and
cogeneration
6
Main Events 2010/11
Sugarcane and Starch
7
SUGARCANE BRAZIL
 March 2011 - Announcement of a R$767 million investment plan for Guarani
• Expansion of crushing capacity and cogeneration
• Petrobras equity contribution :
- R$195 million for the first phase already approved
- Stake in Guarani capital risen to 31.4%
 BNDES long term funding support: a R$764 million financial package
• Maturity: 11 years
• Attractive rates
 Guarani debt refinancing: debt structure lengthened and simplified through new
syndicated loan
• US$560 million
Q4 2010/11 – Quarter Highlights
8
Full Year 2010/11 - Financial Highlights
 Revenues : R$5.7 billion
• Year-over-Year: + 13.5% + 26.0% at constant currency
 Adjusted EBITDA*: R$850 MM
• Year-over-Year: + 10.3% + 20.1% at constant currency
 Net Profit before Taxes: R$225 MM
• Group interest in net profit after tax: R$188 million
 Cereal: Surge in raw material and energy prices, partially offset by new contracts
negotiations since 2H 2010/11
 Sugarcane: Significant growth fueled by capacity investments, acquisitions and strong
market conditions
* Adjusted EBITDA: EBITDA excluding items from discontinued operations, accounting effect of adjustments in the fair value of the financial instruments
(including one-off accounting results for the trading derivatives booked in other operating item) and of the biological assets
•Dividend: R$44.6 MM
Q4 and FY 2010/11 Financial Results
176 213
560
751
97
124390
431
Q4 2009/10 Q4 2010/11
Brazil
Indian Ocean
Starch Europe
Ethanol Europe
Total Holding
Q4 2009/10 Currency Volume Price & Mix Q4 2010/11
Q4 2010/11 - Revenues
Double-digit Growth in Both Cereal and Sugarcane
 Sugarcane
• Revenues: R$555 MM + 14.1% vs Q4 2009/10 + 15.7% at constant currency
• Brazil: + 10.4% as reported
Ethanol sales: + 37.2% in volume (+ 8.2% price increase)
 Cereal
• Revenues: R$964 MM + 30.9% vs Q4 2009/10 + 32.3% at constant currency
• Starch Europe: + 34.7% at constant exchange rate
Price increase: + 26.9% vs. Q4 2009/10
• Ethanol Europe: + 24.5% at constant exchange rate
Price increase: + 12.6% vs. Q4 2009/10
1,519
+ 24.2%
1,223
1,519
1,223
10
In R$ MM
- 15
+ 102
+ 209
752 678
2 701 2 512
239 540
1 319
1 956
FY 2009/10 FY 2010/11
Brazil
Indian Ocean
Starch Europe
Ethanol Europe
Total Holding
Full Year 2010/11 - Revenues
Sugarcane Operations Benefit from Strong Volume and Price Gains
5,688
+ 13.5%
5,011
2
11
 Sugarcane
• Revenues: R$2.5 billion + 60.2% vs FY 2009/10 + 63.9% at constant currency
• Brazil: + 48.3% as reported Sugar sales: + 32.8% in volume Ethanol sales: + 26.4% in volume
• Indian Ocean: + 165.1% at constant exchange rate. Growth resulting from GQF acquisition in La Réunion
 Cereal
• Revenues: R$3.2 billion - 7.6% vs FY 2009/10 + 6.6% at constant currency
• Starch Europe: + 7.3% at constant exchange rate
• Ethanol Europe: + 4.1% at constant exchange rate
In R$ MM
- 496
+ 681
+ 493
24 26
78 72
8 37
96
132
Q4 2009/10 Q4 2010/11-5
In R$ MM
Adjusted EBITDA EBITDA
In R$ MM
206
263
-5
Q4 2010/11 - Adjusted EBITDA and EBITDA
Price increases for Starch and Ethanol in Europe, and Ethanol in Brazil
+ 27.2%
12
176
205
+ 16.7%
 Sugarcane
• Brazil: strong ethanol sales volumes and prices
• Indian Ocean: contribution of GQF acquisition
• Positive impact of biological assets and financial instruments: R$74 million
 Cereal
• Starch: new sales contracts pass through higher raw material costs to selling prices
• Ethanol: increase in volumes and prices
• Negative impact of financial instruments: R$16.2 million
81 51
391
289
24
108
305 381
FY 2009/10 FY 2010/11
-14
In R$ MM
Adjusted EBITDA EBITDA
In R$ MM
802
816
Full Year 2010/11 - Adjusted EBITDA and EBITDA
Increased Sugarcane Production Capacity and Higher Sugar and Ethanol Prices
 Sugarcane
• Favorable market conditions and greater production capacity in Brazil, La Réunion and Mozambique
 Cereal
• Starch: impact of higher costs of purchased cereal and energy throughout the year
• Ethanol: negative effect of barley experiments and maintenance shutdown at Lillebonne
+ 1.8%
-14
13
771
850
+ 10.3%
Adjusted
EBITDA
Adjustements EBITDA Depreciation &
Amortization
Acquisition
Impact
Operating
Income
Net Financial
Expenses
Net Income
Before Tax
IncomeTax Net Income Minority
Interest
Net Income
Group Share
14
Q4 2010/11 - From Adjusted EBITDA to Net Income
Fair value of biological assets: + R$53 MM
Fair value of financial instruments: + R$5 MM
In R$ MM
205
+ 58 263
- 92
+ 1 172
139
- 32
- 33
106
- 25
81
Adjusted
EBITDA
Adjustements EBITDA Depreciation
&
Amortization
Acquisition
Impact
Operating
Income
Net Financial
Expenses
Net Income
Before Tax
IncomeTax Net Income Shares of
Profit in
Associates
Minority
Interest
Net Income
Group Share
15
Full Year 2010/11 - From Adjusted EBITDA to Net Income
Fair value of biological assets: + R$40 MM
Fair value of financial instruments: - R$71 MM
Non recurring: - R$3 MM
In R$ MM
850
- 34
816
- 508
+ 73 380
221
- 159
- 29
192
- 8
188
Accounting impact of the difference
between the price paid for Quartier
Français and its equity value
+ 4
Full Year 2010/11 - Net Result
16
Net Result: 431
Net Result: 196
In R$ MM
 FY 2010/11: Negative impact of income tax compared to positive impact in 2009/10
Debt
Total Net Debt: R$143 Million Decrease vs March 31, 2010
 Net Debt: R$2,150 million - 16.3% vs. December 2010
 Net Debt / Adjusted EBITDA: 2.5x vs. 3x at March 31, 2010
Gross Debt
Breakdown by currency
Debt
In R$ Million
March 31, 2011 March 31, 2010 Change
Current 1,684 1,170 43.9%
Non-current 1,134 1,111 2.1%
Amortized cost (15) (5) -
Total Gross Debt 2,803 2,276 23.2%
In € 1,364 1,295 5.3%
In USD 763 269 183.6%
In R$ 637 620 2.7%
Other currencies 54 97 - 44.3%
Cash and cash Equivalent (633) (501) 26.3%
Total Net Debt 2,170 1,775 22.3%
Related Parties Net Debt (20) 518 - 103.9%
Total Net Debt + Related Parties 2,150 2,293 - 6.2%
17
Euro
48%
US Dollar
27%
Real
23%
Others
2%
Operating Segment Review
Sugarcane
Brazil - Indian Ocean
Sugarcane - Production and Sales
Significant Year-over-Year Volume Growth
Ethanol Sales (‘000 m³) Energy Sales (‘000 MWh)Sugarcane Crushing (MM t) Sugar Sales (‘000 t)
20
 2010/11 production highlights
• Crop year 2010/11: 19.7 million tons + 43% y-o-y
• Product Mix: 58% sugar and 42% ethanol
• Sugar production: 1,556 thousand tons + 63% y-o-y
• Ethanol production: 692,000 m³ + 44% y-o-y
• Cogeneration: 287 GWh/year + 144% y-o-y
238 213
488
424
233
Q4
09/10
Q1
10/11
Q2
10/11
Q3
10/11
Q4
10/11
120
99
179
164 165
Q4
09/10
Q1
10/11
Q2
10/11
Q3
10/11
Q4
10/11
7
42
113
81
51
Q4
09/10
Q1
10/11
Q2
10/11
Q3
10/11
Q4
10/11
0.1
7.8 7.8
4.0
Q4
09/10
Q1
10/11
Q2
10/11
Q3
10/11
Q4
10/11
Q4 2009/10 Price & Mix Volume Price & Mix Volume Others * Q4 2010/11
Sugar
Ethanol
431
390
Sugarcane Brazil - Q4 Financials
Benefitting from solid Ethanol volume and prices increases
* includes Cogeneration, Agricultural Products and Hedging
Key Figures
In R$ Million
Q4
2010/11
Q4
2009/10
Change
Reported
Revenues 431 390 + 10.4%
Gross Profit 127 73 + 74.3%
Gross Margin 29.4% 18.6%
EBITDA 132 96 + 37.8%
EBITDA Margin 30.7% 24.6%
Adjusted EBITDA 79 66 + 19.9%
Adjusted EBITDA Margin 18.3% 16.9%
EBIT 95 56 + 68.2%
EBIT Margin 22.0% 14.4%
Adjusted EBIT 41 26 + 58.4%
Adjusted EBIT Margin 9.6% 6.7%
Capex 205 174 + 17.8%
 Gross Profit: R$127 million
• Positive impact of fair value of biological assets:
+ R$32.5 million vs. - R$0.5 million in Q4 2009/10
 Adjusted EBITDA: R$80 million
• Fair value of financial instruments:
+ R$20.8 million vs. + R$69.8 million in Q4 2009/10
• R$39.1 million of non recurring expenses in
Q4 2009/10
 Capex: R$205 million
 Sugar: 55.7% of total revenue
• Sales volume: - 2.4% vs. Q4 2009/10
• Price (R$/ton): + 1% vs. Q4 2009/10
 Ethanol: 44.3% of total revenue
• Sales volume: + 37.2% vs. Q4 2009/10
• Price (R$/m³): + 8.2% vs. Q4 2009/10
In R$ MM
Revenues
21
- 7 - 6
+ 10
+ 52
- 8
FY 2009/10 Price & Mix Volume Price & Mix Volume Others * FY 2010/11
Sugar
Ethanol
1,956
1,319
Sugarcane Brazil - Full Year Financials
Strong revenue growth due to favorable market conditions and increased production capacity
Key Figures
In R$ Million
FY
2010/11
FY
2009/10
Change
Reported
Revenues 1,956 1,319 + 48.3%
Gross Profit 456 295 + 54.5%
Gross Margin 23.3% 22.4%
EBITDA 381 305 + 24.8%
EBITDA Margin 19.5% 23.1%
Adjusted EBITDA 428 281 + 52.3%
Adjusted EBITDA Margin 21.9% 21.3%
EBIT 95 107 - 10.9%
EBIT Margin 4.9% 8.1%
Adjusted EBIT 142 83 + 72.4%
Adjusted EBIT Margin 7.3% 6.3%
Capex 378 242 + 56.2%
In R$ MM
Revenues
22 * includes Cogeneration, Agricultural Products and Hedging
+ 58
+ 307 + 58 + 124
+ 91
 Sugar: 62.0% of total revenue
• Sales volume: + 32.8% vs. 2009/10
• Price (R$/ton): + 9.4% vs. 2009/10
 Ethanol: 29.7% of total revenue
• Sales volume: + 26.4% vs. 2009/10
• Price (R$/m³): + 15.1% vs. 2009/10
• Anhydrous: 33.5% of total ethanol
vs. 25.2% in 2009/10
 Gross Margin: + R$161 million vs. FY 2009/10
• Perimeter effect of R$94.6 million
• Fair value of biological assets: + R$24 million
 Capex: R$378 million
• Cruz Alta and Severínia: R$140 million;
São José: R$80 million; Tanabi: R$59 million;
Andrade: R$38 million; Mandu: R$43 million and
Vertente (50%): R$18 million
Mozambique
 Sugarcane crushing: 536,000 tons
Sugar production: 22.4% higher at 46,400 tons of sugar
 Revenues
• Q4 2010/11: R$7.3 million
• FY 2010/11: R$50.7 million
 Adjusted EBITDA
• Q4 2010/11: - R$5 million (Excluding fair value on biological
assets of R$20.6 million)
• FY 2010/11: R$2.8 million (Excluding fair value on biological
assets of R$15.8 million)
 Capex
• FY 2010/11: R$28 million
• Irrigation and sugarcane fields renovation
La Réunion
 Sugarcane crushing: 1.9 million tons
More than doubled production at 52,000 tons of sugar
 Revenues
• Q4 2010/11: R$117 million (+ R$19 million vs. Q4 2009/10)
• FY 2010/11: R$489 million (+ R$290 million vs. FY 2009/10)
 Adjusted EBITDA
• Q4 2010/11: R$21.5 million
• FY 2010/11: R$89.8 million
 Capex
• FY 2010/11: R$73 million (+ R$66 million vs. FY 2009/10)
Sugarcane Indian Ocean - Production - Q4 and Full Year Financials
Strong results
Key Figures
In R$ Million
Q4
2010/11
Q4
2009/10
FY
2010/11
FY
2009/10
Revenues 124 97 540 239
Gross Profit 54 (5) 80 (44)
Gross Margin 43.7% (5.7)% 14.8% (18.6)%
EBITDA 37 8 108 24
EBITDA Margin 29.8% 8.5% 20.1% 10.1%
Adjusted EBITDA 16 8 93 13
Adjusted EBITDA Margin 13.2% 8.2% 17.2% 5.6%
Capex 30 5 101 33
La Réunion
Sugarcane Crushing (’000 t)
Mozambique
Sugarcane Crushing (‘000 t)
23
1,003
874
Q4
09/10
Q1
10/11
Q2
10/11
Q3
10/11
Q4
10/11
230
289
17
Q4
09/10
Q1
10/11
Q2
10/11
Q3
10/11
Q4
10/11
Cereal
Starch Europe - Ethanol Europe
Starch Europe - Production and Sales
Stable Volumes
Co-products Sales (‘000 t)Cereal Grinding (‘000 t) Starch & Sweeteners Sales (‘000 t) Ethanol & Alcohol Sales (‘000 m3)
 Cereal grinding: 696,000 tons + 3.4% year-on-year
• Higher use of corn capacities
 Sales Volumes
• Starch and Sweeteners: - 1.0% vs. Q4 2009/10
• Alcohol & Ethanol: - 1.3% vs. Q4 2009/10
• Co-products + 9.4% vs. Q4 2009/10
25
673 693 702 696 696
Q4
09/10
Q1
10/11
Q2
10/11
Q3
10/11
Q4
10/11
413
437
424
398 409
Q4
09/10
Q1
10/11
Q2
10/11
Q3
10/11
Q4
10/11
45 45 46
42
44
Q4
09/10
Q1
10/11
Q2
10/11
Q3
10/11
Q4
10/11
236 239 257 253 258
39
61
Q4
09/10
Q1
10/11
Q2
10/11
Q3
10/11
Q4
10/11
SYRAL BENP/DVO
Starch Europe - Q4 Financials
Volume and price recovery drives increased profitability
Revenues
In R$ MM
Q4 2009/10 Currency Volume Price & Mix Q4 2010/11
751
560
26
Starch and
Sweeteners
61%
Alcohol and
Ethanol
10%
Co-products
24%
Others
5%
Key Figures
In R$ Million
Q4
2010/11
Q4
2009/10
Change
Reported
Change
Constant
Currency
Revenues 751 560 + 34.1% + 34.7%
Gross Profit 147 48 + 207.6% + 125.1%
Gross Margin 19.6% 8.5%
EBITDA 72 78 - 7.4% - 6.8%
EBITDA Margin 9.6% 13.9%
Adjusted EBITDA 88 78 + 13.9% + 14.4%
Adjusted EBITDA Margin 11.8% 13.9%
EBIT 41 41 0.0% - 2.4%
EBIT Margin 5.5% 7.4%
Adjusted EBIT 57 41 + 40.4% + 36.4%
Adjusted EBIT Margin 7.7% 7.3%
Capex 39 15 + 160.0%
 Revenues: + 34.7% at constant currency
• + 25.9% in prices and mix
• + 8.6% in volumes
 Gross Profit: R$147 million
• Strong increase due to new sales contracts passing
through higher costs of purchased cereal and energy
 Adjusted EBITDA: R$88 million
 Capex: R$39 million
• Optimization of production lines
• Equipment purchases for the Selby grain
alcohol plant (start-up in 2012)
- 2
+ 48
+ 145
Starch Europe - Full Year Financials
Higher starch contract prices result in better H2
Key Figures
In R$ Million
FY
2010/11
FY
2009/10
Change
Reported
Change
Constant
Currency
Revenues 2,512 2,701 - 7.0% + 7.3%
Gross Profit 581 651 - 10.8% + 4.3%
Gross Margin 23.2% 24.0%
EBITDA 289 391 - 26.0% - 14.8%
EBITDA Margin 11.5% 14.5%
Adjusted EBITDA 292 395 - 26.0% - 14.8%
Adjusted EBITDA Margin 11.6% 14.6%
EBIT 170 248 - 31.5% - 21.2%
EBIT Margin 6.8% 9.2%
Adjusted EBIT 173 252 - 31.5% - 21.2%
Adjusted EBIT Margin 6.9% 9.3%
Capex 124 122 + 1.6%
Revenues
In R$ MM
 Revenues: + 7.3% at constant currency
• Increase in sales price and change in mix product
 Improved Gross margin resulting from new
contracts enabling pass-through of higher costs
FY 2009/10 Currency Volume Price & Mix FY 2010/11
2,512
2,701
27
Starch and
Sweeteners
60%
Alcohol and
Ethanol
10%
Co-products
25%
Others
5%
- 360
+ 50
+ 121
Ethanol Europe - Q4 Financials
Increased Revenues and EBITDA
Key Figures
In R$ Million
Q4
2010/11
Q4
2009/10
Change
Reported
Change
Constant
Currency
Revenues 213 176 + 20.6% + 24.5%
Gross Profit 7 13 - 49.0% - 51.1%
Gross Margin 3.1% 7.4%
EBITDA 26 24 + 7.0% + 13.8%
EBITDA Margin 12.3% 13.9%
Adjusted EBITDA 26 24 + 7.0% + 13.8%
Adjusted EBITDA Margin 12.3% 13.9%
Capex 10 9 + 11.1%
 Ethanol sales*: 135,000 m³
• +23.5% vs. Q4 2009/10
 Revenues: + 24.5% at constant currency
• Price and volumes increase
 Gross Profit: R$7 million
• R$25.7 million of revenues to reintegrate: co-products
currently sold by Tereos Syral and formerly by Tereos
BENP
 EBITDA: R$26 million
• + 13.8% at constant currency
 Capex: R$10 million
• Gluten extraction (start-up in 2012): Tereos BENP’s first
diversified production
* Includes sales of ethanol produced by Tereos
Revenues
In R$ MM
Q4 2009/10 Currency Volume Price & Mix Q4 2010/11
213
176
28
- 5
+ 8
+ 34
Ethanol Europe - Full Year Financials
Revenue impacted by maintenance closure of Lillebonne and technical difficulties in H1
Key Figures
In R$ Million
FY
2010/11
FY
2009/10
Change
Reported
Change
Constant
Currency
Revenues 678 752 - 9.7% + 4.1%
Gross Profit 28 86 - 66.7% - 61.6%
Gross Margin 4.2% 11.4%
EBITDA 51 81 - 37.1% - 27.4%
EBITDA Margin 7.6% 10.8%
Adjusted EBITDA 51 81 - 37.1% - 27.4%
Adjusted EBITDA Margin 7.6% 10.8%
Capex 28 60 - 53.3%
 Ethanol production at BENP Lillebonne
impacted by maintenance shutdown
 Ethanol: record sales and price increase in
Q4 2010/11
* Includes sales of ethanol produced by Tereos
Revenues
In R$ MM
678
752
29
- 100 - 36
+ 62
 Revenues: + 4.1% at constant currency
 Gross profit: impacted by energy and related
costs
Outlook and Summary
31
Tereos Internacional - Conclusion
 Solid results in Q4 for both our major activities: sugarcane and cereal operations
 FY 2010/11
• Adjusted EBITDA increased to R$850 million + 10 % vs 2009/10
• Sugarcane: strong results across all geographies
• Cereal: significant swing in profitability in Q4 as new contracts reflected
higher raw materials costs
 Favorable market dynamics
• Sugar and Ethanol: low worldwide inventory levels
• Starch: strong market demand
32

20110523 ti conf_call_presentation_q4_engl_v2

  • 1.
    Tereos Internacional Fourth Quarterand Full Year 2010/11 Results São Paulo - May 24, 2011
  • 2.
    Highlights Q4 and FY2010/11 Financial Results Operating Segment Review Outlook and Summary
  • 3.
    3 * Adjusted EBITDA:EBITDA excluding items from discontinued operations, accounting effect of adjustments in the fair value of the financial instruments (including one-off accounting results for the trading derivatives booked in other operating item) and of the biological assets  Revenues : R$1.5 billion • Year-over-Year: + 24.2% + 25.8% at constant currency  Adjusted EBITDA*: R$205 MM • Year-over-Year: + 16.7% + 18.3% at constant currency  Net Profit before Taxes: R$139 MM • 3.4x year-over-year  Cereal: positive impact of higher starch and ethanol prices resulting from negotiations of new contracts and higher ethanol volumes at the Lillebonne plant  Sugarcane: benefit from organic growth driven by capacity investments, acquisitions and high sugar and ethanol prices Q4 2010/11 - Financial Highlights Strong revenue and operating performance
  • 4.
    Q4 2010/11 -Market Fundamentals 4 Sugar: strong fundamentals still in place  Low inventory levels  Reduced supplies from Brazil, China and Australia  Sugar prices: peaked in early February 2011 • Prices down to 21/22 cents Starch: continued strong demand for starch and derivative products in Europe  All starch product categories positively affected; high demand from paper, chemical and food industries  Contract terms modified to enable producers to adjust selling prices  Wheat and corn prices still high Ethanol: favorable environment  Brazil: maximized allocation of sugarcane to sugar production versus ethanol and strong demand despite increase in prices Sharp rise in prices and tight inventories  New regulation being discussed: expected to improve credit availability for storage and production expansion
  • 5.
     March 2010– DVO’s is accredited for its cereal premium alcohol  April 2010 – Partnership with Petrobras Biocombustivel with a capital increase of R$1.6 billion  May 2010 – Mandu’s acquisition (3,5 million tons): R$345 million  May 2010 – Inauguration of Tanabi sugar factory  May 2010 – Inauguration of Andrade cogeneration facility (joint venture with GDF Suez)  June 2010 – Refinancing of €450 million for the Tereos EU  August 2010 – Conclusion of an ethanol commercialization agreement with BR for 2.2 million m3 over 4 years  August 2010 – Launch of the Selby distillery project in the UK for the premium alcohols sector  November 2010 – Launch of the gluten project in BENP Lillebonne 5 Main Events 2010/11 Sugarcane and Starch
  • 6.
     February –Announcement of the Brazilian starch project of R$230 MM  March 2011 – Guarani: US$560 million debt refinancing  March 2011 – R$764 million new BNDES financing  March 2011 – Launch of R$767 million investment plan in expansion of crushing capacity and cogeneration 6 Main Events 2010/11 Sugarcane and Starch
  • 7.
    7 SUGARCANE BRAZIL  March2011 - Announcement of a R$767 million investment plan for Guarani • Expansion of crushing capacity and cogeneration • Petrobras equity contribution : - R$195 million for the first phase already approved - Stake in Guarani capital risen to 31.4%  BNDES long term funding support: a R$764 million financial package • Maturity: 11 years • Attractive rates  Guarani debt refinancing: debt structure lengthened and simplified through new syndicated loan • US$560 million Q4 2010/11 – Quarter Highlights
  • 8.
    8 Full Year 2010/11- Financial Highlights  Revenues : R$5.7 billion • Year-over-Year: + 13.5% + 26.0% at constant currency  Adjusted EBITDA*: R$850 MM • Year-over-Year: + 10.3% + 20.1% at constant currency  Net Profit before Taxes: R$225 MM • Group interest in net profit after tax: R$188 million  Cereal: Surge in raw material and energy prices, partially offset by new contracts negotiations since 2H 2010/11  Sugarcane: Significant growth fueled by capacity investments, acquisitions and strong market conditions * Adjusted EBITDA: EBITDA excluding items from discontinued operations, accounting effect of adjustments in the fair value of the financial instruments (including one-off accounting results for the trading derivatives booked in other operating item) and of the biological assets •Dividend: R$44.6 MM
  • 9.
    Q4 and FY2010/11 Financial Results
  • 10.
    176 213 560 751 97 124390 431 Q4 2009/10Q4 2010/11 Brazil Indian Ocean Starch Europe Ethanol Europe Total Holding Q4 2009/10 Currency Volume Price & Mix Q4 2010/11 Q4 2010/11 - Revenues Double-digit Growth in Both Cereal and Sugarcane  Sugarcane • Revenues: R$555 MM + 14.1% vs Q4 2009/10 + 15.7% at constant currency • Brazil: + 10.4% as reported Ethanol sales: + 37.2% in volume (+ 8.2% price increase)  Cereal • Revenues: R$964 MM + 30.9% vs Q4 2009/10 + 32.3% at constant currency • Starch Europe: + 34.7% at constant exchange rate Price increase: + 26.9% vs. Q4 2009/10 • Ethanol Europe: + 24.5% at constant exchange rate Price increase: + 12.6% vs. Q4 2009/10 1,519 + 24.2% 1,223 1,519 1,223 10 In R$ MM - 15 + 102 + 209
  • 11.
    752 678 2 7012 512 239 540 1 319 1 956 FY 2009/10 FY 2010/11 Brazil Indian Ocean Starch Europe Ethanol Europe Total Holding Full Year 2010/11 - Revenues Sugarcane Operations Benefit from Strong Volume and Price Gains 5,688 + 13.5% 5,011 2 11  Sugarcane • Revenues: R$2.5 billion + 60.2% vs FY 2009/10 + 63.9% at constant currency • Brazil: + 48.3% as reported Sugar sales: + 32.8% in volume Ethanol sales: + 26.4% in volume • Indian Ocean: + 165.1% at constant exchange rate. Growth resulting from GQF acquisition in La Réunion  Cereal • Revenues: R$3.2 billion - 7.6% vs FY 2009/10 + 6.6% at constant currency • Starch Europe: + 7.3% at constant exchange rate • Ethanol Europe: + 4.1% at constant exchange rate In R$ MM - 496 + 681 + 493
  • 12.
    24 26 78 72 837 96 132 Q4 2009/10 Q4 2010/11-5 In R$ MM Adjusted EBITDA EBITDA In R$ MM 206 263 -5 Q4 2010/11 - Adjusted EBITDA and EBITDA Price increases for Starch and Ethanol in Europe, and Ethanol in Brazil + 27.2% 12 176 205 + 16.7%  Sugarcane • Brazil: strong ethanol sales volumes and prices • Indian Ocean: contribution of GQF acquisition • Positive impact of biological assets and financial instruments: R$74 million  Cereal • Starch: new sales contracts pass through higher raw material costs to selling prices • Ethanol: increase in volumes and prices • Negative impact of financial instruments: R$16.2 million
  • 13.
    81 51 391 289 24 108 305 381 FY2009/10 FY 2010/11 -14 In R$ MM Adjusted EBITDA EBITDA In R$ MM 802 816 Full Year 2010/11 - Adjusted EBITDA and EBITDA Increased Sugarcane Production Capacity and Higher Sugar and Ethanol Prices  Sugarcane • Favorable market conditions and greater production capacity in Brazil, La Réunion and Mozambique  Cereal • Starch: impact of higher costs of purchased cereal and energy throughout the year • Ethanol: negative effect of barley experiments and maintenance shutdown at Lillebonne + 1.8% -14 13 771 850 + 10.3%
  • 14.
    Adjusted EBITDA Adjustements EBITDA Depreciation& Amortization Acquisition Impact Operating Income Net Financial Expenses Net Income Before Tax IncomeTax Net Income Minority Interest Net Income Group Share 14 Q4 2010/11 - From Adjusted EBITDA to Net Income Fair value of biological assets: + R$53 MM Fair value of financial instruments: + R$5 MM In R$ MM 205 + 58 263 - 92 + 1 172 139 - 32 - 33 106 - 25 81
  • 15.
    Adjusted EBITDA Adjustements EBITDA Depreciation & Amortization Acquisition Impact Operating Income NetFinancial Expenses Net Income Before Tax IncomeTax Net Income Shares of Profit in Associates Minority Interest Net Income Group Share 15 Full Year 2010/11 - From Adjusted EBITDA to Net Income Fair value of biological assets: + R$40 MM Fair value of financial instruments: - R$71 MM Non recurring: - R$3 MM In R$ MM 850 - 34 816 - 508 + 73 380 221 - 159 - 29 192 - 8 188 Accounting impact of the difference between the price paid for Quartier Français and its equity value + 4
  • 16.
    Full Year 2010/11- Net Result 16 Net Result: 431 Net Result: 196 In R$ MM  FY 2010/11: Negative impact of income tax compared to positive impact in 2009/10
  • 17.
    Debt Total Net Debt:R$143 Million Decrease vs March 31, 2010  Net Debt: R$2,150 million - 16.3% vs. December 2010  Net Debt / Adjusted EBITDA: 2.5x vs. 3x at March 31, 2010 Gross Debt Breakdown by currency Debt In R$ Million March 31, 2011 March 31, 2010 Change Current 1,684 1,170 43.9% Non-current 1,134 1,111 2.1% Amortized cost (15) (5) - Total Gross Debt 2,803 2,276 23.2% In € 1,364 1,295 5.3% In USD 763 269 183.6% In R$ 637 620 2.7% Other currencies 54 97 - 44.3% Cash and cash Equivalent (633) (501) 26.3% Total Net Debt 2,170 1,775 22.3% Related Parties Net Debt (20) 518 - 103.9% Total Net Debt + Related Parties 2,150 2,293 - 6.2% 17 Euro 48% US Dollar 27% Real 23% Others 2%
  • 18.
  • 19.
  • 20.
    Sugarcane - Productionand Sales Significant Year-over-Year Volume Growth Ethanol Sales (‘000 m³) Energy Sales (‘000 MWh)Sugarcane Crushing (MM t) Sugar Sales (‘000 t) 20  2010/11 production highlights • Crop year 2010/11: 19.7 million tons + 43% y-o-y • Product Mix: 58% sugar and 42% ethanol • Sugar production: 1,556 thousand tons + 63% y-o-y • Ethanol production: 692,000 m³ + 44% y-o-y • Cogeneration: 287 GWh/year + 144% y-o-y 238 213 488 424 233 Q4 09/10 Q1 10/11 Q2 10/11 Q3 10/11 Q4 10/11 120 99 179 164 165 Q4 09/10 Q1 10/11 Q2 10/11 Q3 10/11 Q4 10/11 7 42 113 81 51 Q4 09/10 Q1 10/11 Q2 10/11 Q3 10/11 Q4 10/11 0.1 7.8 7.8 4.0 Q4 09/10 Q1 10/11 Q2 10/11 Q3 10/11 Q4 10/11
  • 21.
    Q4 2009/10 Price& Mix Volume Price & Mix Volume Others * Q4 2010/11 Sugar Ethanol 431 390 Sugarcane Brazil - Q4 Financials Benefitting from solid Ethanol volume and prices increases * includes Cogeneration, Agricultural Products and Hedging Key Figures In R$ Million Q4 2010/11 Q4 2009/10 Change Reported Revenues 431 390 + 10.4% Gross Profit 127 73 + 74.3% Gross Margin 29.4% 18.6% EBITDA 132 96 + 37.8% EBITDA Margin 30.7% 24.6% Adjusted EBITDA 79 66 + 19.9% Adjusted EBITDA Margin 18.3% 16.9% EBIT 95 56 + 68.2% EBIT Margin 22.0% 14.4% Adjusted EBIT 41 26 + 58.4% Adjusted EBIT Margin 9.6% 6.7% Capex 205 174 + 17.8%  Gross Profit: R$127 million • Positive impact of fair value of biological assets: + R$32.5 million vs. - R$0.5 million in Q4 2009/10  Adjusted EBITDA: R$80 million • Fair value of financial instruments: + R$20.8 million vs. + R$69.8 million in Q4 2009/10 • R$39.1 million of non recurring expenses in Q4 2009/10  Capex: R$205 million  Sugar: 55.7% of total revenue • Sales volume: - 2.4% vs. Q4 2009/10 • Price (R$/ton): + 1% vs. Q4 2009/10  Ethanol: 44.3% of total revenue • Sales volume: + 37.2% vs. Q4 2009/10 • Price (R$/m³): + 8.2% vs. Q4 2009/10 In R$ MM Revenues 21 - 7 - 6 + 10 + 52 - 8
  • 22.
    FY 2009/10 Price& Mix Volume Price & Mix Volume Others * FY 2010/11 Sugar Ethanol 1,956 1,319 Sugarcane Brazil - Full Year Financials Strong revenue growth due to favorable market conditions and increased production capacity Key Figures In R$ Million FY 2010/11 FY 2009/10 Change Reported Revenues 1,956 1,319 + 48.3% Gross Profit 456 295 + 54.5% Gross Margin 23.3% 22.4% EBITDA 381 305 + 24.8% EBITDA Margin 19.5% 23.1% Adjusted EBITDA 428 281 + 52.3% Adjusted EBITDA Margin 21.9% 21.3% EBIT 95 107 - 10.9% EBIT Margin 4.9% 8.1% Adjusted EBIT 142 83 + 72.4% Adjusted EBIT Margin 7.3% 6.3% Capex 378 242 + 56.2% In R$ MM Revenues 22 * includes Cogeneration, Agricultural Products and Hedging + 58 + 307 + 58 + 124 + 91  Sugar: 62.0% of total revenue • Sales volume: + 32.8% vs. 2009/10 • Price (R$/ton): + 9.4% vs. 2009/10  Ethanol: 29.7% of total revenue • Sales volume: + 26.4% vs. 2009/10 • Price (R$/m³): + 15.1% vs. 2009/10 • Anhydrous: 33.5% of total ethanol vs. 25.2% in 2009/10  Gross Margin: + R$161 million vs. FY 2009/10 • Perimeter effect of R$94.6 million • Fair value of biological assets: + R$24 million  Capex: R$378 million • Cruz Alta and Severínia: R$140 million; São José: R$80 million; Tanabi: R$59 million; Andrade: R$38 million; Mandu: R$43 million and Vertente (50%): R$18 million
  • 23.
    Mozambique  Sugarcane crushing:536,000 tons Sugar production: 22.4% higher at 46,400 tons of sugar  Revenues • Q4 2010/11: R$7.3 million • FY 2010/11: R$50.7 million  Adjusted EBITDA • Q4 2010/11: - R$5 million (Excluding fair value on biological assets of R$20.6 million) • FY 2010/11: R$2.8 million (Excluding fair value on biological assets of R$15.8 million)  Capex • FY 2010/11: R$28 million • Irrigation and sugarcane fields renovation La Réunion  Sugarcane crushing: 1.9 million tons More than doubled production at 52,000 tons of sugar  Revenues • Q4 2010/11: R$117 million (+ R$19 million vs. Q4 2009/10) • FY 2010/11: R$489 million (+ R$290 million vs. FY 2009/10)  Adjusted EBITDA • Q4 2010/11: R$21.5 million • FY 2010/11: R$89.8 million  Capex • FY 2010/11: R$73 million (+ R$66 million vs. FY 2009/10) Sugarcane Indian Ocean - Production - Q4 and Full Year Financials Strong results Key Figures In R$ Million Q4 2010/11 Q4 2009/10 FY 2010/11 FY 2009/10 Revenues 124 97 540 239 Gross Profit 54 (5) 80 (44) Gross Margin 43.7% (5.7)% 14.8% (18.6)% EBITDA 37 8 108 24 EBITDA Margin 29.8% 8.5% 20.1% 10.1% Adjusted EBITDA 16 8 93 13 Adjusted EBITDA Margin 13.2% 8.2% 17.2% 5.6% Capex 30 5 101 33 La Réunion Sugarcane Crushing (’000 t) Mozambique Sugarcane Crushing (‘000 t) 23 1,003 874 Q4 09/10 Q1 10/11 Q2 10/11 Q3 10/11 Q4 10/11 230 289 17 Q4 09/10 Q1 10/11 Q2 10/11 Q3 10/11 Q4 10/11
  • 24.
    Cereal Starch Europe -Ethanol Europe
  • 25.
    Starch Europe -Production and Sales Stable Volumes Co-products Sales (‘000 t)Cereal Grinding (‘000 t) Starch & Sweeteners Sales (‘000 t) Ethanol & Alcohol Sales (‘000 m3)  Cereal grinding: 696,000 tons + 3.4% year-on-year • Higher use of corn capacities  Sales Volumes • Starch and Sweeteners: - 1.0% vs. Q4 2009/10 • Alcohol & Ethanol: - 1.3% vs. Q4 2009/10 • Co-products + 9.4% vs. Q4 2009/10 25 673 693 702 696 696 Q4 09/10 Q1 10/11 Q2 10/11 Q3 10/11 Q4 10/11 413 437 424 398 409 Q4 09/10 Q1 10/11 Q2 10/11 Q3 10/11 Q4 10/11 45 45 46 42 44 Q4 09/10 Q1 10/11 Q2 10/11 Q3 10/11 Q4 10/11 236 239 257 253 258 39 61 Q4 09/10 Q1 10/11 Q2 10/11 Q3 10/11 Q4 10/11 SYRAL BENP/DVO
  • 26.
    Starch Europe -Q4 Financials Volume and price recovery drives increased profitability Revenues In R$ MM Q4 2009/10 Currency Volume Price & Mix Q4 2010/11 751 560 26 Starch and Sweeteners 61% Alcohol and Ethanol 10% Co-products 24% Others 5% Key Figures In R$ Million Q4 2010/11 Q4 2009/10 Change Reported Change Constant Currency Revenues 751 560 + 34.1% + 34.7% Gross Profit 147 48 + 207.6% + 125.1% Gross Margin 19.6% 8.5% EBITDA 72 78 - 7.4% - 6.8% EBITDA Margin 9.6% 13.9% Adjusted EBITDA 88 78 + 13.9% + 14.4% Adjusted EBITDA Margin 11.8% 13.9% EBIT 41 41 0.0% - 2.4% EBIT Margin 5.5% 7.4% Adjusted EBIT 57 41 + 40.4% + 36.4% Adjusted EBIT Margin 7.7% 7.3% Capex 39 15 + 160.0%  Revenues: + 34.7% at constant currency • + 25.9% in prices and mix • + 8.6% in volumes  Gross Profit: R$147 million • Strong increase due to new sales contracts passing through higher costs of purchased cereal and energy  Adjusted EBITDA: R$88 million  Capex: R$39 million • Optimization of production lines • Equipment purchases for the Selby grain alcohol plant (start-up in 2012) - 2 + 48 + 145
  • 27.
    Starch Europe -Full Year Financials Higher starch contract prices result in better H2 Key Figures In R$ Million FY 2010/11 FY 2009/10 Change Reported Change Constant Currency Revenues 2,512 2,701 - 7.0% + 7.3% Gross Profit 581 651 - 10.8% + 4.3% Gross Margin 23.2% 24.0% EBITDA 289 391 - 26.0% - 14.8% EBITDA Margin 11.5% 14.5% Adjusted EBITDA 292 395 - 26.0% - 14.8% Adjusted EBITDA Margin 11.6% 14.6% EBIT 170 248 - 31.5% - 21.2% EBIT Margin 6.8% 9.2% Adjusted EBIT 173 252 - 31.5% - 21.2% Adjusted EBIT Margin 6.9% 9.3% Capex 124 122 + 1.6% Revenues In R$ MM  Revenues: + 7.3% at constant currency • Increase in sales price and change in mix product  Improved Gross margin resulting from new contracts enabling pass-through of higher costs FY 2009/10 Currency Volume Price & Mix FY 2010/11 2,512 2,701 27 Starch and Sweeteners 60% Alcohol and Ethanol 10% Co-products 25% Others 5% - 360 + 50 + 121
  • 28.
    Ethanol Europe -Q4 Financials Increased Revenues and EBITDA Key Figures In R$ Million Q4 2010/11 Q4 2009/10 Change Reported Change Constant Currency Revenues 213 176 + 20.6% + 24.5% Gross Profit 7 13 - 49.0% - 51.1% Gross Margin 3.1% 7.4% EBITDA 26 24 + 7.0% + 13.8% EBITDA Margin 12.3% 13.9% Adjusted EBITDA 26 24 + 7.0% + 13.8% Adjusted EBITDA Margin 12.3% 13.9% Capex 10 9 + 11.1%  Ethanol sales*: 135,000 m³ • +23.5% vs. Q4 2009/10  Revenues: + 24.5% at constant currency • Price and volumes increase  Gross Profit: R$7 million • R$25.7 million of revenues to reintegrate: co-products currently sold by Tereos Syral and formerly by Tereos BENP  EBITDA: R$26 million • + 13.8% at constant currency  Capex: R$10 million • Gluten extraction (start-up in 2012): Tereos BENP’s first diversified production * Includes sales of ethanol produced by Tereos Revenues In R$ MM Q4 2009/10 Currency Volume Price & Mix Q4 2010/11 213 176 28 - 5 + 8 + 34
  • 29.
    Ethanol Europe -Full Year Financials Revenue impacted by maintenance closure of Lillebonne and technical difficulties in H1 Key Figures In R$ Million FY 2010/11 FY 2009/10 Change Reported Change Constant Currency Revenues 678 752 - 9.7% + 4.1% Gross Profit 28 86 - 66.7% - 61.6% Gross Margin 4.2% 11.4% EBITDA 51 81 - 37.1% - 27.4% EBITDA Margin 7.6% 10.8% Adjusted EBITDA 51 81 - 37.1% - 27.4% Adjusted EBITDA Margin 7.6% 10.8% Capex 28 60 - 53.3%  Ethanol production at BENP Lillebonne impacted by maintenance shutdown  Ethanol: record sales and price increase in Q4 2010/11 * Includes sales of ethanol produced by Tereos Revenues In R$ MM 678 752 29 - 100 - 36 + 62  Revenues: + 4.1% at constant currency  Gross profit: impacted by energy and related costs
  • 30.
  • 31.
    31 Tereos Internacional -Conclusion  Solid results in Q4 for both our major activities: sugarcane and cereal operations  FY 2010/11 • Adjusted EBITDA increased to R$850 million + 10 % vs 2009/10 • Sugarcane: strong results across all geographies • Cereal: significant swing in profitability in Q4 as new contracts reflected higher raw materials costs  Favorable market dynamics • Sugar and Ethanol: low worldwide inventory levels • Starch: strong market demand
  • 32.