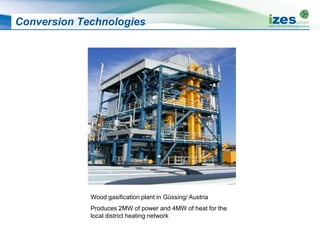
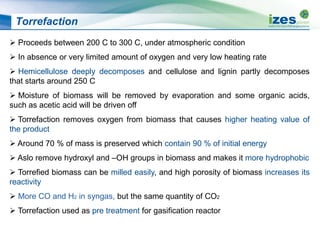
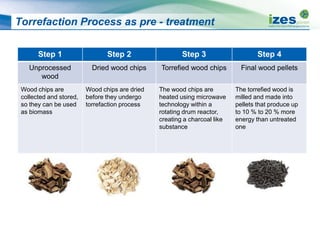
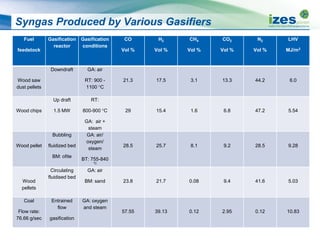
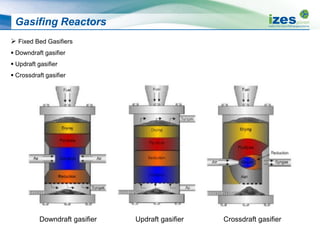
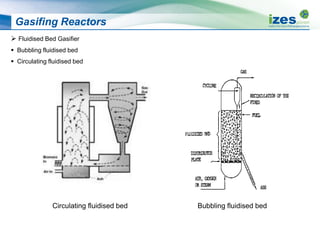
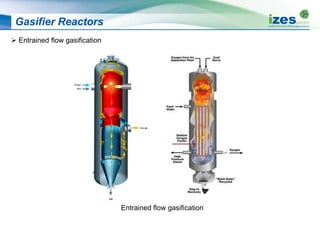
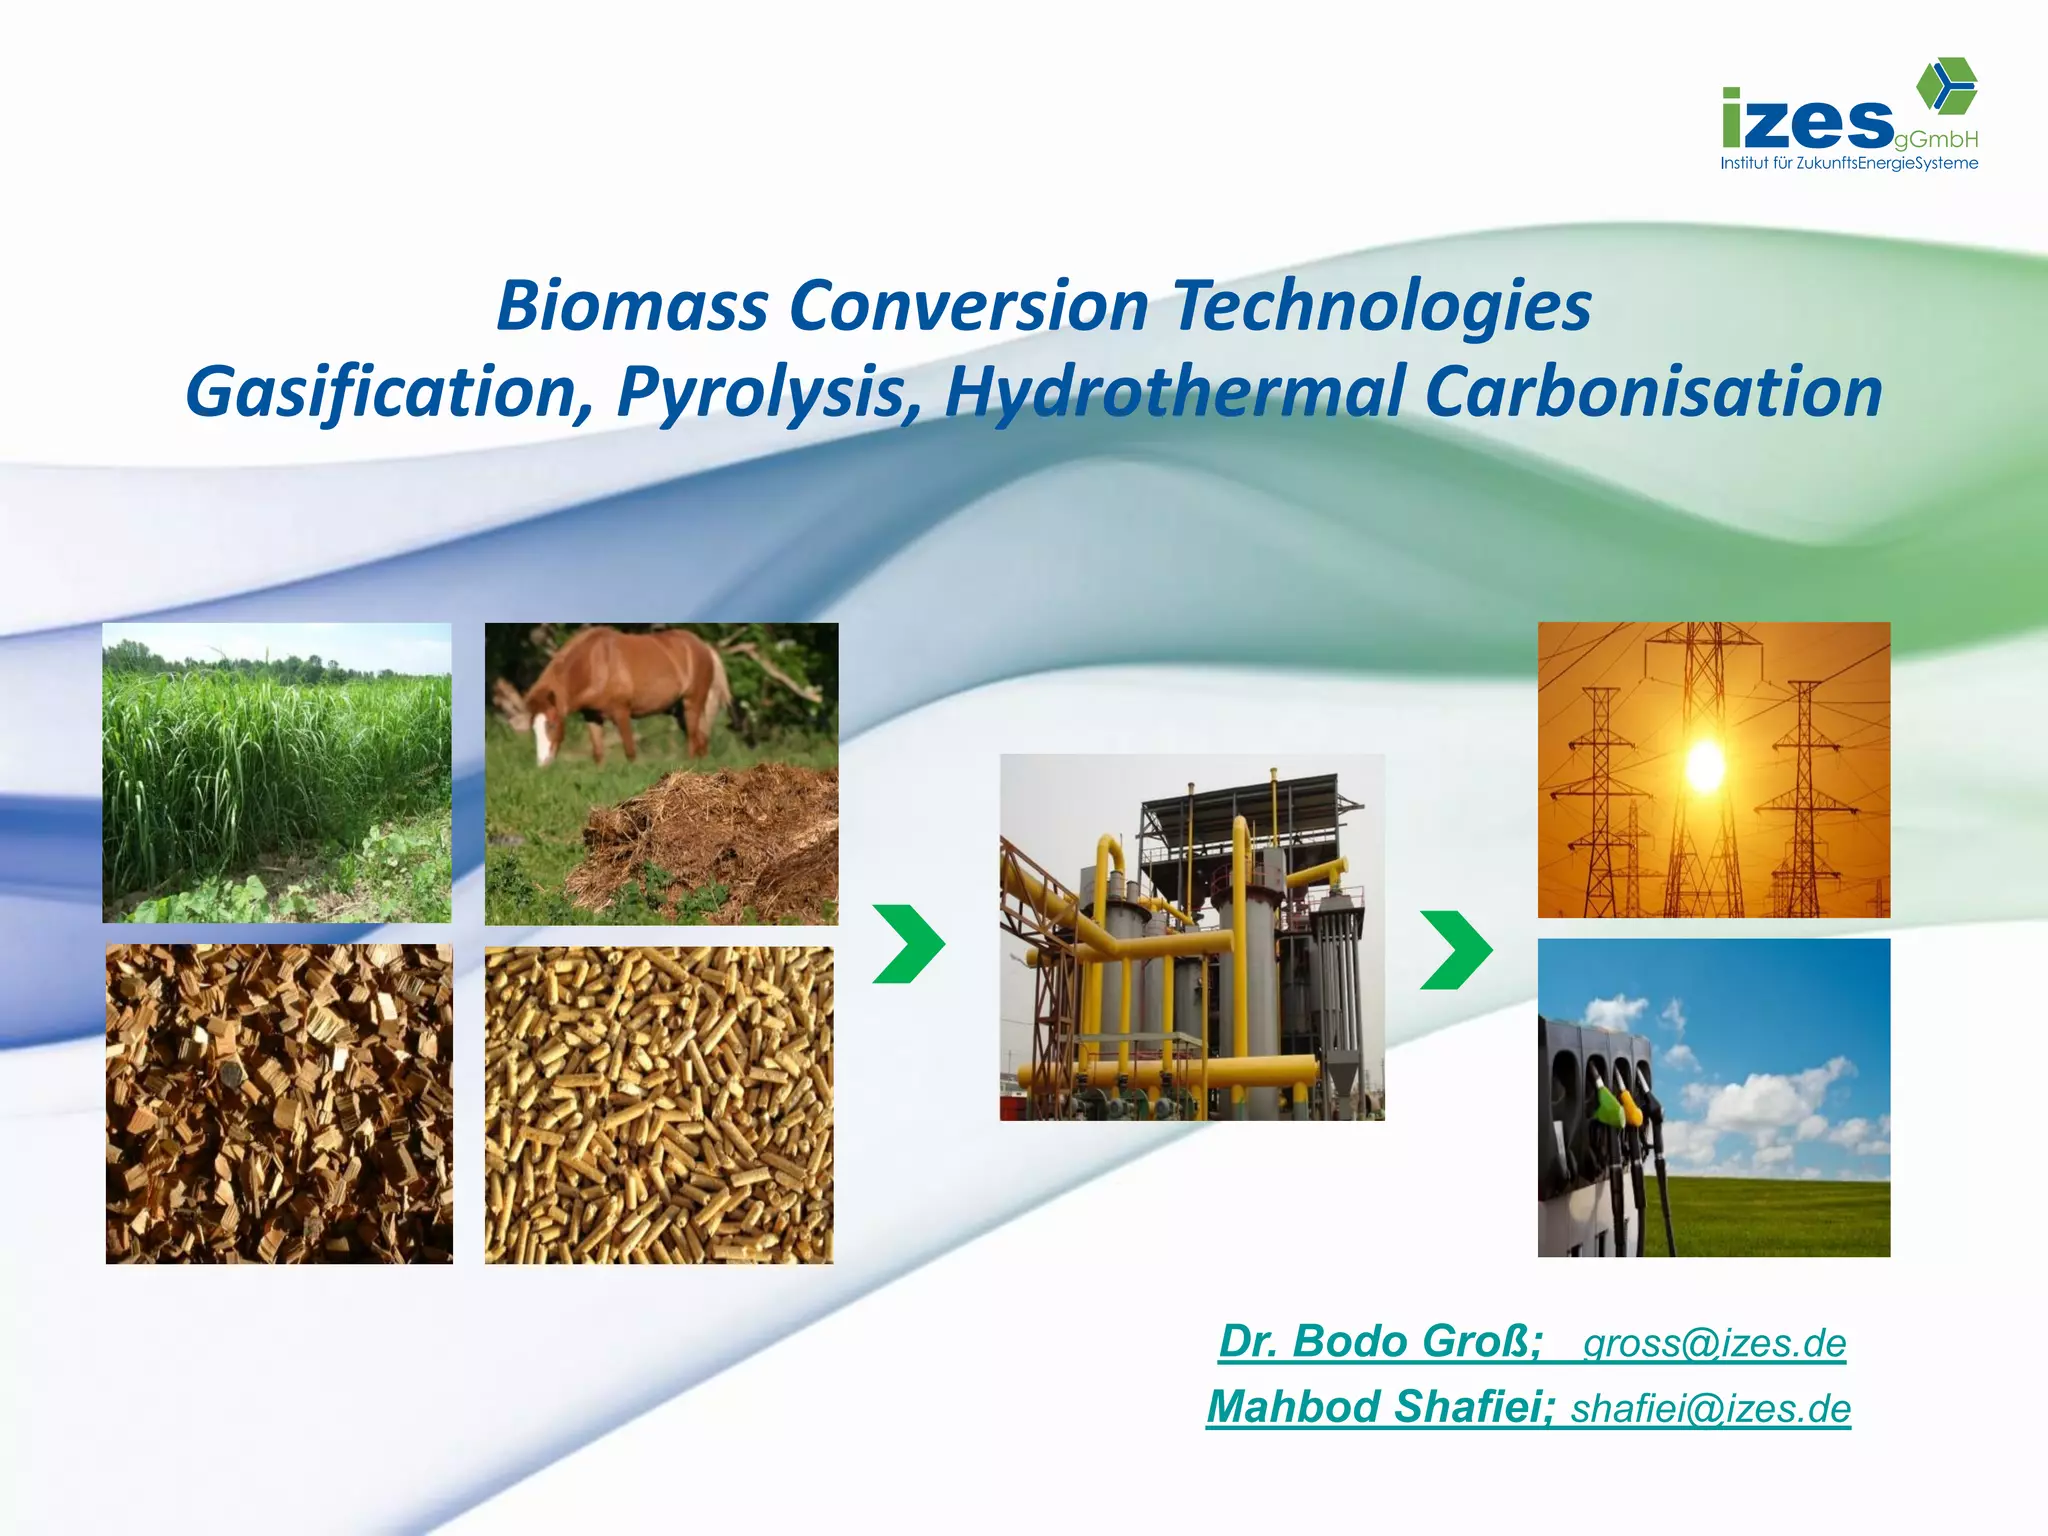
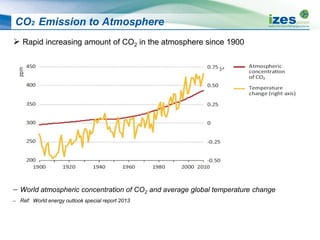
The document discusses various biomass conversion technologies including gasification, pyrolysis, and hydrothermal carbonization. It provides details on each process such as typical temperature and pressure ranges, residence times, and resulting product yields. Gasification is described as a partial oxidation process producing syngas with lower oxygen than combustion. Pyrolysis is divided into categories based on temperature and residence time, influencing whether the main products are solid char, liquid bio-oil, or gases. The document also examines biomass properties, thermal conversion reactions, examples of different gasifier types, and quality of syngas output.

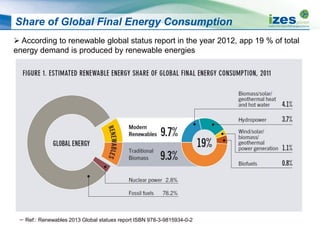


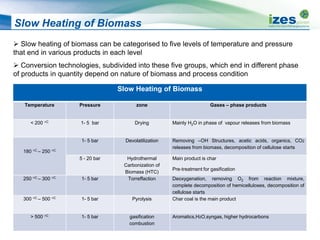
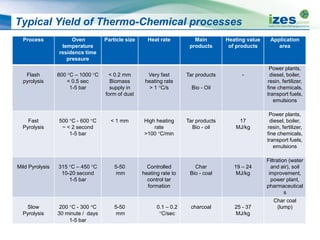
![Typical Yield of Thermo-Chemical Processes
Process Reaction
Conditions
(Temperature [°C],
residence time)
Char
Weight %
Liquid
Weight %
Gas
Weight %
Slow pyrolysis ~400 °C h - week 35% 30% 35%
Mild pyrolysis ~500 °C 10 – 20 sec 20% 50% 30%
Fast pyrolysis ~500 °C 2 sec 12% 75% 13%
Gasification ~800 °C -1400 °C
10 - 20sec
10% 5% 85%
HTC ~180 °C - 250 °C
1-12 hour processing
time
50-80% 5-20%
Dissolved in water
2-5%](https://image.slidesharecdn.com/1ff77c05-c374-4e8a-acf4-a49a30bea905-150305094403-conversion-gate01/85/20131008-Biomass-Conversion-Technologies-13-320.jpg)