2. tant role in our understanding of GH function (1).
GHRϪ/Ϫ mice are dwarf with low levels of IGF-1 and
increased GH; thus, they are GH resistant (2). They are
also extremely insulin sensitive (3), presumably due to the
absence of the anti-insulin effects of GH. Remarkably,
they exhibit up to a 50% increase in lifespan that cannot
be further extended with calorie restriction (4, 5). The
extended lifespan in GHRϪ/Ϫ mice is associated with
lower morbidity and disease-related mortality, with al-
most half of the long-lived mice dying without obvious
lethal pathological lesions as compared with 10% of their
wild-type littermate controls (6). Importantly, the unique
phenotype of GHRϪ/Ϫ mice has notable similarities with
a population of Ecuadorian Laron Syndrome (LS) indi-
viduals (7). This population has a reduction in IGF-1 lev-
els, an elevation in GH levels, and enhanced insulin sen-
sitivity. Thus far, these individuals do not appear to
experience life extension, but they are protected from di-
abetes and fatal neoplasms. The increased insulin sensi-
tivity in LS individuals and GHRϪ/Ϫ mice is particularly
interesting considering that both are obese, a characteris-
tic not typically associated with improved glucose homeo-
stasis or lifespan extension.
The adiposity of GHRϪ/Ϫ mice has been extensively
studied. GHRϪ/Ϫ mice have a significantly higher per-
cent body fat throughout their lifespan (8) with a dispro-
portionate amount of fat deposition in the sc white adi-
pose tissue (WAT) depot (8). In terms of adipokine
expression, leptin levels (9) are elevated in GHRϪ/Ϫ
mice, which is consistent with their increased obesity.
Interestingly, adiponectin levels, which are usually nega-
tively correlated with obesity, are elevated in GHRϪ/Ϫ
mice (10). Adiponectin is an important adipokine with
beneficial effects on inflammation and insulin sensitivity
and is positively correlated with increased longevity in an-
imals and humans (11–13). Furthermore, adiponectin has
been reported to be negatively regulated by GH in multi-
ple systems (14, 15). As stated above, GHRϪ/Ϫ mice are
obese throughout life and have high adiponectin levels.
This suggests that the lack of GH action, either directly
via negative regulation by GH or indirectly through other
physiological alterations in these mice, overrides the pres-
ence of obesity. Furthermore, the increased adiponectin
may also contribute to the improved glucose metabolism
of GHRϪ/Ϫ mice. Although less thoroughly studied, LS
individuals have increased serum levels of adiponectin
and leptin as well as notable enlargements in WAT (7,
16). Taken together, LS individuals and GHRϪ/Ϫ mice
provide a means to better understand how adipose tissue
mass can be enlarged without notable deleterious effects
on health and lifespan. Because GHR signaling is dis-
rupted in all tissues of LS patients and GHRϪ/Ϫ mice, it
would be of value to disrupt GH signaling selectively in
adipose tissue to better understand the impact of this tis-
sue on whole-body metabolism and physiology.
Multiple groups have utilized the Cre-LoxP system to
evaluate GHR disruption in various tissues and cell types.
Liver-specific deletion of GHR results in no major
changes in adiposity although these mice are reported to
have marked insulin resistance and severe hepatic steato-
sis (17). Muscle-specific deletion of GHR has been re-
ported by two groups with different results. Mavalli et al
(18) report peripheral adiposity, insulin resistance, and
glucose intolerance using the Mef-2c promoter/enhancer
whereas mice generated using the muscle creatine kinase
promoter/enhancer have reduced adiposity and overall
improvement in glucose metabolism (19). Disruption of
GHR in -cells impairs insulin secretion that is exacer-
bated by a high-fat diet (20). Collectively, these results
demonstrate that disruption of GHR in specific tissues
can dramatically influence glucose homeostasis and adi-
posity. To date, no studies have assessed GHR gene dis-
ruption in adipose tissue. Because GH’s action on adipose
tissue plays an essential metabolic role in terms of whole-
body physiology, we set out to generate and characterize
adipose tissue GHR gene-disrupted mice. In this study, we
used the Cre-LoxP system to disrupt the GHRϪ/Ϫ gene in
adipose tissue to produce Fat GHR Knockout
(FaGHRKO) mice. We hypothesized that disruption of
the GHR in adipose tissue will 1) increase adiposity, 2)
increase leptin and adiponectin levels, and 3) improve
glucose homeostasis, all of which occur in global
GHRϪ/Ϫ mice. Here, we report initial characterization
of these mice including adiposity, adipokine levels, and
glucose metabolic results as well as effects on morpho-
metric, endocrine, and physiological parameters. We also
discuss these results in comparison with previous reports
characterizing the global GHRϪ/Ϫ mice to provide novel
and more specific insight into the specific role of GH in
adipose tissue.
Materials and Methods
FaGHRKO mouse production
The mouse strain carrying the conditional GHR floxed allele
(GHRflox/flox
) was generated by the Knockout Mouse Project
(KOMP) as previously described (21). Adipose tissue-specific
GHRϪ/Ϫ mice (FFCx) and floxed littermate controls (FFxx)
were generated by breeding conditional GHRflox/flox
mice to
B6.Cg-Tg(Fabp4-cre)1Rev/J mice purchased from The Jackson
Laboratory (Bar Harbor, Maine). B6.Cg-Tg(Fabp4-cre)1Rev/J
mice have been crossed to C57BL/6 mice for nine generations at
The Jackson Laboratory.
2 List et al Disruption of the GHR Gene in Adipose Tissue Mol Endocrinol, March 2013, 27(3):0000–0000
3. In the current study, 146 mice divided into two main cohorts
were used. The first cohort of male and female FaGHRKO and
littermate controls (63 total, n ϭ 15–16 per group) were used for
all measurements except body composition over time. The sec-
ond cohort of FaGHRKO and littermate controls of both sexes
(83 total, n ϭ 16–25 per group) were used only to collect lon-
gitudinal body composition. Mice were housed three to four per
cage and given ad libitum access to water and standard labora-
tory rodent chow (ProLab RMH 3000). The cages were main-
tained in a temperature- and humidity-controlled room and ex-
posed to a 14-hour light, 10-hour dark cycle. All procedures
were approved by the Ohio University Institutional Animal
Care and Use Committee.
Quantitative real-time PCR
Whole frozen tissue was homogenized using the Precellys
24-Dual (Bertin Technologies, Montigny-le-Bretonneux, France).
The homogenization conditions were optimized for each tissue.
RNA was purified using Qiagen RNeasy Mini Kit (QIAGEN,
Chatsworth, Calfornia), and the concentration and integrity of
the mRNA was verified by the Thermo NanoDrop 2000c and
Agilent 2100 Bioanalyzer (Agilent Technologies, Palo Alto, Cal-
ifornia), respectively. Qiagen QuantiTect Reverse Transcription
Kit was used for cDNA synthesis. For real-time data collection,
Qiagen QuantiTect SYBR Green PCR Kit was used with a BIO-
RAD iCycler Thermal Cycler (Bio-Rad Laboratories, Inc, Her-
cules, California). Qbase Plus from Biogazelle (Zwijnaarde, Bel-
gium) was used to analyze the qPCR results. Each tissue was
tested with a pair of primers for the GHR gene as well as seven
reference genes (EEF2, RPS3, B2M, ACTB, HPRT, EIF3F, and
RPL38). For all other qPCR, the reactions and calculations were
performed as previously described (22).
Western blot analysis of GHR
Frozen tissue samples were homogenized in lysis buffer (1%
vol/vol Triton X-100, 150 mM NaCl, 10% vol/vol glycerol, 50
mM Tris-HCl [pH 8.0], 100 mM NaF, 2 mM EDTA, 1 mM
phenylmethylsulfonyl fluoride, 1 mM sodium orthovanadate,
10 g/mL aprotinin) and proteins resolved by 8% SDS-PAGE.
After electrophoresis, proteins were transferred to an Amer-
sham Hybond-enhanced chemiluminescence (ECL) membrane
(GE Healthcare, Pittsburgh, Pennsylvania), and the membrane
incubated in Tris buffered saline (TBS) containing 2% gelatin
and 0.05% Tween 20. The membrane was then rinsed briefly in
TBS/Tween and incubated with rabbit anti-GHR primary anti-
body (AL47) in 1% gelatin-TBS/Tween overnight (23). The fol-
lowing day, the membranes were washed and incubated with
secondary antibody for 2 h (NA934, ECL Antirabbit IgG HRP
Linked, GE Healthcare, Piscataway, New Jersey) in 1% gelatin-
TBS/Tween 20. The membrane was then washed and incubated
for 5 minutes with ECL Plus Western Blotting Detection System
(RPN2132, GE Healthcare) and exposed to Kodak Biomax
XAR film (Eastman Kodak, Rochester, New York).
Body composition measurements
Body composition was measured in two cohorts of mice. In
the first cohort, FaGHRKO and littermate controls (n ϭ 15–16
per group per sex) were measured at 5 months of age before
dissection and subsequent tissue analysis at 6 mo. In the second
cohort, FaGHRKO and littermate controls of both sexes (n ϭ
16–25 per group per sex) were measured over time starting at 2
months until 12 months of age. Body composition was mea-
sured using a Bruker Minispec NMR (Bruker Corp, The Wood-
lands, Texas) as previously described (8, 24).
Fasting blood glucose, glucose tolerance test (GTT),
and insulin tolerance test (ITT) measurements
Fasting blood glucose was determined at 5 months of age
using OneTouch Ultra test strips and glucometers (Lifescan, Inc,
Milpitas, California). Blood samples were obtained by cutting
approximately 1 mm from the tip of the tail and collecting the
first drop of blood. Fasting blood glucose measurements oc-
curred starting at 9:00 AM after a 12-hour overnight fast. GTTs
were performed at 5 months and 1 week of age. Mice were
fasted for 12 hours before commencement of the experiment at
9:00 AM. Each mouse received an ip injection of 10% glucose at
a dose of 1 g/kg body weight. Blood glucose measurements were
monitored before the glucose injection and at 15, 30, 45, 60, and
90 minuntes after injection. ITTs were performed at 5 months
and 2 weeks of age in a fed state at approximately 3:00 PM.
Recombinant human insulin (Humulin-R; Eli Lilly & Co, Indi-
anapolis, Indiana) was prepared by diluting Humulin-R (100
U/ml) to 0.075 U/mL in sterile 0.9% NaCl. Each mouse received
an ip injection of the 0.075 U/ml insulin solution at a dose of
0.75U/kg body weight. Blood glucose measurements were per-
formed before the insulin injection and at 15, 30, 45, and 60
minutes after injection.
Serum measurements
Serum measurements were performed at 6 mo of age. Serum
was collected starting at approximately 9:00 AM after a 12-h
fast. IGF-1 levels (total IGF-1) were measured using IGF-1
(mouse, rat) ELISA kits (Catalog no. 22-IG1MS-E01; ALPCO
Diagnostics, Salem, New Hampshire). High molecular weight
(HMW) and total adiponectin levels were measured using
ELISA kits (47-ADPMS-E01) from ALPCO Diagnostics (Salem,
New Hampshire). Insulin, c-peptide, leptin, resistin, and gastric
inhibitory polypeptide were measured using a Mouse Metabolic
Panel (catalog no. MMHMAG-44K; Millipore Corp., Billerica,
Massachusetts). IGF binding proteins-1, -2, -3, -5, -6, and -7
were measured using the Mouse IGF Binding Protein MAG-
NETIC Bead Panel (catalog no. MIGFBPMAG-43; Millipore
Corp.). Adipsin, AGP, ␣-2-macroglobulin, C-reactive protein
(CRP), and haptoglobin were measured using the MILLIPLEX
MAP Mouse Acute Phase Magnetic Bead Panel 2 (catalog no.
MAP2MAG-76K; Millipore Corp.). Soluble receptors (sCD30,
sgp130, sIL-1RI, sIL-1RII, sIL-2Ra, sIL-4R, sIL6R, sTNFRI,
sTNFRII, soluble vascular endothelial growth factor receptor
(sVEGFR)1, sVEGFR2, sVEGFR3) were measured using the
MILLIPLEX MAP Mouse Soluble Cytokine Receptor Panel
(catalog no. MSCR-42K, Millipore Corp.). Lipocalin-2 and
pentraxin-3 were measured using the MILLIPLEX MAP Mouse
Acute Phase Magnetic Bead Panel-1 (catalog no. MAP1MAG-
76K; Millipore Corp.). All MILLIPEX kits were analyzed using
a Milliplex 200 Analyzer (Millipore Corp.). All of the above
procedures were performed according to the manufacturer’s
instructions.
Mol Endocrinol, March 2013, 27(3):0000–0000 mend.endojournals.org 3
4. Tissue collection, liver, and WAT analysis
All tissue was collected from 6-mo-old mice. Mice were
killed starting at 9:00 AM following a 12-hour overnight fast.
Mice were first placed in a CO2 chamber until unconscious,
after which blood was quickly collected from the orbital sinus.
After blood collection, the mice were killed by cervical disloca-
tion. Kidney, heart, lung, spleen, brain, skeletal muscle (gastroc-
nemius, soleus, and quadriceps), and interscapular BAT were
collected, weighed, and flash frozen in liquid nitrogen and
stored at Ϫ80ºC.
Liver tissue was collected and weighed, and a portion was
flash frozen in liquid nitrogen and stored at Ϫ80ºC until pro-
cessing for determining triglyceride content, while another por-
tion was fixed in 10% formalin, embedded in paraffin, and
processed for histology. For determining triglyceride content,
liver tissues were thawed and used for extraction and measure-
ment of triacylglycerol levels as described previously (25).
Subcutaneous, retroperitoneal, mesenteric, and perigonadal
WAT were collected and weighed. A portion of WAT was flash
frozen in liquid nitrogen and stored at Ϫ80ºC. For subcutaneous
and perigonadal WAT, a portion of the sample was processed
for histology by fixing in 10% formalin and embedding in par-
affin. Adipocyte cell size and number were
determined as previously described (26).
Statistical analysis
All values are given as means Ϯ SEMs.
Statistics were performed using SPSS ver-
sion 14.0 (Chicago, Illinois). The two-
tailed unpaired Student’s t test was used to
assess the significance of difference be-
tween two sets of data. Differences were
considered to be statistically significant
when P Ͻ .05.
Results
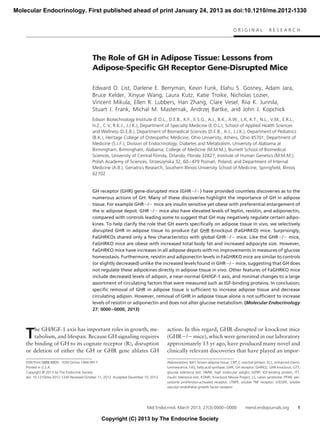
FaGHRKO mice
FaGHRKO mice (FFCx) and floxed
littermate controls (FFxx) were gener-
ated by breeding conditional floxed
GHRflox/flox
mice to B6.Cg-Tg(Fabp4-
cre)1Rev/J mice (Figure 1, A and B). Ab-
sence of GHR protein in WAT of
FaGHRKO mice was shown by Western
blot analysis (Figure 1C). Adipose tissue-
specific deletion of GHR was quantified
using qPCR in FaGHRKO mice (FFCx)
and floxed littermate controls (FFxx)
(Figure 1D). In the FaGHRKO mice,
GHR mRNA expression is significantly
decreased 89%, 77%, 85%, 60%, and
92% in epididymal, mesenteric, retro-
peritoneal, and sc WAT, and in brown
adipose tissue (BAT), respectively, vs
controls. No change in GHR gene ex-
pression was observed for liver, lung, kidney, brain, skeletal
muscle, or heart.
Body weight and body composition
Five-month mean body weights of FaGHRKO mice
that were also used for dissection were significantly
greater than littermate controls with 14% and 23% in-
creases for male and female, respectively (Figure 2A).
Body composition analysis showed a 96% increase in
total body fat mass in FaGHRKO mice compared with
controls (Figure 2B). Total lean body mass was signifi-
cantly increased in female (8%) but not male FaGHRKO
mice compared with controls (Figure 2C). Additionally,
total body fluid was significantly increased in both sexes
of FaGHRKO mice (Figure 2D).
Body composition measurements over time showed
that the increase in body weight became significant for
FaGHRKO males by 3 mo of age and for FaGHRKO
Figure 1. Generation and characterization of FaGHRKO mice. A, FaGHRKO mice were
generated by crossing mice with a “floxed” exon 4 of the GHR to transgenic mice that
express Cre recombinase under the control of the aP2 promoter/enhancer (aP2-Cre). Solid
arrowheads depict the LoxP sites. B, PCR analysis detected the presence of the LoxP sites and
the aP2-Cre transgene. C, Western blot analysis of GHR protein from WAT in FaGHRKO
(FFCx) vs controls (FFxx). D, GHR mRNA expression level in various tissues from FaGHRKO mice
(n ϭ 6; black bars) compared with controls (n ϭ 6; white bars). GHR expression was
significantly decreased in both WAT and BAT. No changes to GHR gene expression were
observed for liver, lung, kidney, brain, skeletal muscle (SM), or heart. Epi, epididymal; Mes,
mesenteric; Retro, retroperitoneal; Std, standard; SubQ, subcutaneous.
4 List et al Disruption of the GHR Gene in Adipose Tissue Mol Endocrinol, March 2013, 27(3):0000–0000
5. females by 5 months of age (Figure 2, E and H). This
difference continued to increase with age. Fat mass was
significantly increased at 2 months in male FaGHRKO
mice (Figure 2F). Although exhibiting a similar trend,
female FaGHRKO mice had a delayed increase in fat mass
with a significant difference not seen until 4 months of age
(Figure 2I). Lean mass for FaGHRKO males increased
only at 10 mo of age (Figure 2G), whereas FaGHRKO
females had a significant increase from 5–10 months of
age (Figure 2J).
Adipose tissue depot mass and adipocyte size
and number
WAT mass was significantly increased in all four de-
pots for female FaGHRKO mice compared with controls.
In males, all depots but the perigonadal fat pad were
increased (Figure 3). The sc depot in FaGHRKO mice was
the most impacted by removal of the GHR because it
showed the largest increase in males (204% increase) and
females (237% increase). In male FaGHRKO mice, the
retroperitoneal depot was increased by 74% and the mes-
enteric depot was increased by 111%, whereas the 20%
increase in the perigonadal depot did not reach statistical
significance. In female FaGHRKO mice, the retroperito-
neal depot was increased by 188%, the mesenteric depot
was increased by 124%, and the perigonadal depot was
increased by 116%. The mass of BAT collected from
FaGHRKO mice was significantly increased compared
with littermate controls with 87% and 93% increases for
male and female, respectively.
Subcutaneous and perigonadal WAT depots were an-
alyzed for cell size and number. Adipocyte cell size was
significantly increased in the sc depot (Figure 3F) in both
male FaGHRKO (157% compared with controls) and
female FaGHRKO mice (135% compared with controls).
Adipocytes from the perigonadal depot (Figure 3G) were
modestly increased in FaGHRKO mice. Adipocyte cell
numbers did not differ in sc or perigonadal adipose depots
(data not shown).
Organ weight and liver triglyceride content
No change was observed in the absolute weights of
liver, heart, lung, brain, gastrocnemius muscle, and quad-
riceps between FaGHRKO vs control mice of males (Fig-
ure 4A) or females (Figure 4B). However, several sex-
specific differences were observed in other organs. For
Figure 2. GHR deletion in adipose tissue increases total body fat mass. Two cohorts of mice were studied, including 63 mice (n ϭ 15–16 animals
per group) that were used to measure body composition at 6 months of age before a 6-month dissection (A–D) and 83 mice (n ϭ 16–25 animals
per group) that were used to measure body composition over time (E–J). For the 63 mice used for dissections, body weight (A), fat mass (B), lean
mass (C), and fluid mass (D) are shown for FaGHRKO (FFCx; black bars) and controls (FFxx; white bars) in both males and females. Body weight (E
and H), fat mass (F and I), and lean mass (G and J) are shown for males and females over time. FaGHRKO (FFCx; black boxes) and controls (FFxx;
white circles) are indicated. Values in A–J are represented as mean Ϯ SEM (n ϭ 15–25 per group). *P Ͻ .05; **P Ͻ .01; ***P Ͻ .001, FaGHRKO
(FFCx) vs control (FFxx). BW, body weight.
Mol Endocrinol, March 2013, 27(3):0000–0000 mend.endojournals.org 5
6. example, kidneys and soleus muscle from FaGHRKO
mice were significantly larger than controls in females but
not in males, whereas the spleens from FaGHRKO mice
were smaller than controls in males but normal in females.
Liver triglyceride levels did not differ in FaGHRKO mice com-
pared with controls (Figure 4C).
Adipokines
Mean values for circulating leptin were only signifi-
cantly increased in female FaGHRKO mice (Table 1).
Resistin levels were unchanged in FaGHRKO mice com-
pared with controls. Mean values for total and HMW
adiponectin were decreased slightly in both male and fe-
male FaGHRKO mice with only male total adiponectin
values reaching statistical significance (P ϭ .047). Circu-
lating levels of adipsin were significantly decreased in
both male and female FaGHRKO mice compared with
controls.
Glucose metabolism
Fasting blood glucose, serum insulin, and C-peptide
did not differ between FaGHRKO and controls (Figure
5). GTTs and ITTs also showed no significant differences
between FaGHRKO mice and controls. No changes were
seen in RNA levels encoding intracellular signaling mol-
ecules that are known to affect glucose metabolism and
other processes in WAT from FaGHRKO mice including:
peroxisome proliferator-activated receptor (PPAR)␥ co-
activator 1, sirtuin1 (SIRT1), PPAR␣, PPAR␦, PPAR␥,
4-1BB, sterol regulatory element binding protein
(SREBP), fatty acid synthase (FAS), and glucose trans-
porter (GLUT)4 (Figure 6).
GH, IGF-1, and IGF-binding proteins (IGFBPs)
GH levels were not significantly different in FaGHRKO
mice relative to controls. Serum IGF-1 levels were ele-
vated in FaGHRKO compared with controls for both
males (22%) and females (8%); however, only in males
did this reach statistical significance (Table 2). No signif-
icant changes were observed for any of the IGFBPs except
for IGFBP-5, which was significantly increased (19%) in
female FaGHRKO mice (P ϭ .033) but did not quite
reach statistical significance in males (P ϭ .06).
Other blood parameters
Circulating levels of IL-6 were significantly elevated in
female FaGHRKO compared with controls (P ϭ .005),
whereas no change was seen in males (Table 3). MCP-1
did not differ between FaGHRKO and controls for either
sex. Circulating levels of acute phase peptides including
lipocalin-2, pentraxin-3, AGP, CRP, ␣-2-macroglobulin,
and haptoglobin did not differ between FaGHRKO and
Figure 3. FaGHRKO mice have increased adipose tissue depot weight and increased adipocyte cell size. Adipose tissue was collected at 6 mo of
age. Subcutaneous (A), perigonadal (B), retroperitoneal (C), and mesenteric (D) WAT depots as well as BAT (E) are shown for male and female
FaGHRKO (FFCx; black bars) and controls (FFxx; white bars). Mean adipocyte cell size is shown for sc (F) and perigonadal (G) depots. Hematoxylin
and eosin (H&E) staining of sc (top four images) and perigonadal (bottom four images) adipose tissue depots are shown. Values in A–G are
represented as mean Ϯ SEM (n ϭ 15–16 per group). *P Ͻ .05; **P Ͻ .01; ***P Ͻ 0.001, FaGHRKO (FFCx) vs control (FFxx). Mes, mesenteric; Peri,
perigonadal; Retro, retroperitoneal; SubQ, subcutaneous.
6 List et al Disruption of the GHR Gene in Adipose Tissue Mol Endocrinol, March 2013, 27(3):0000–0000
7. controls regardless of sex. A large number of soluble se-
rum receptors including sgp130, sIL-1RI, sIL-1RII, sIL-
2Ra, sIL6R, sTNFRI, sTNFRII, sVEGFR1, sVEGFR2,
and sVEGFR3 were similar between FaGHRKO and con-
trols regardless of sex. However, sCD30 (decreased in
female FaGHRKO) and sIL-4R (increased in male
FaGHRKO) differed between FaGHRKO and controls.
Discussion
The GHRϪ/Ϫ mouse was generated in
our laboratory nearly 15 yr ago (2).
These mice are dwarf with low IGF-1
and high GH levels. GHRϪ/Ϫ mice are
obese with the sc WAT depot being
preferentially increased (8). Despite the
obese phenotype, the mice are insulin
sensitive with very low levels of serum
insulin (4). Interestingly, these mice are
long-lived (4) with decreased rates of
cancer (6). Another interesting finding
is that GHRϪ/Ϫ mice have elevated
levels of adiponectin despite being
obese (10). In an effort to determine the
tissues responsible for the above men-
tioned phenotypes, attempts are being
made to disrupt the GHR gene in a tis-
sue-specific manner. Others have al-
ready reported on muscle-, liver-, and
pancreas-specific GHRKO mice (17–
19). Here, we describe the fat GHR
knockout (FaGHRKO) mouse.
To delete the GHR in WAT,
GHRflox/flox
mice were crossed with
transgenic aP2-cre mice. This cre pro-
moter/enhancer has been used by many
for disruption of a variety of genes in
adipose tissue (27–30). Whereas aP2
expression is induced in nonadipogenic
tissues during early development, al-
beit in cells that are of an analogous
cell lineage (31), studies that have ana-
lyzed adult tissues show a specific lo-
calization to WAT and BAT (29, 30). Our results support
the expression of aP2 specifically in adult adipose tissue
because the levels of GHR mRNA were reduced in four
WAT depots and interscapular BAT but not significantly
altered in any other tissue tested. It has been previously
claimed that aP2 expression is induced in activated mac-
Figure 4. Organ weights and liver tryglyceride content. A total of 63 mice were dissected at
6 mo of age. A and B, Liver, kidney, spleen, lung, heart, skeletal muscle (gastrocnemius,
soleus, and quadriceps), and brain, are shown for FaGHRKO (FFCx; black bars) and controls
(FFxx; white bars) for males (A) and females (B). C, Liver triglyceride is shown for FaGHRKO
mice and controls for both sexes. Values in A–C are represented as mean Ϯ SEM (n ϭ 15–16
per group). *P Ͻ .05, FaGHRKO (FFCx) vs control (FFxx). Gast, gastrocnemius; Quad,
quadriceps; Sol, soleus.
Table 1. Serum Adipokine Levels of FaGHRKO and Control Male and Female Mice
Fat GHRϪ/Ϫ (Male) Fat GHRϪ/Ϫ (Female)
FFxx FFCx P Value FFxx FFCx P Value
Total adiponectin, n ϭ 9–10 (pg/ml) 22 302 Ϯ 1227 18 782 Ϯ 1106a
.047 43 736 Ϯ 7135 39 642 Ϯ 12 224 .372
HMW adiponectin, n ϭ 9–10 (pg/ml) 3923 Ϯ 1412 3405 Ϯ 864 .335 11 214 Ϯ 3429 10 922 Ϯ 6816 .905
Leptin, n ϭ 15–16 (pg/ml) 3850 Ϯ 736 5451 Ϯ 835 .160 3183 Ϯ 739 6267 Ϯ 1057a
.023
Resistin, n ϭ 15–16 (pg/ml) 11 347 Ϯ 857 13 318 Ϯ 1575 .272 11 427 Ϯ 1216 11 779 Ϯ 907 .818
Adipsin, n ϭ 9–10 (pg/ml) 1816 Ϯ 88 1117 Ϯ 100a
8.E-05 2020 Ϯ 187 1248 Ϯ 153a
.005
Abbreviations: FFxx, controls; FFCx, FaGHRKO. Adipokine values of mice at 6 months of age. Values are represented as mean Ϯ SEM (n ϭ 9–16
per group). a
Indicates significance with P values given to the right.
Mol Endocrinol, March 2013, 27(3):0000–0000 mend.endojournals.org 7
8. rophages (32). However, more recent reports show that
the efficiency of Cre recombination in macrophages is
much less than that in adipocytes (27, 28). Because we
cannot rule out macrophage expression or embryonic ex-
pression, these possibilities need to be taken into consid-
eration when interpreting our results.
The body weights of male and female FaGHRKO mice
were significantly increased. This weight gain was mainly
attributed to a near doubling of fat mass. The increase in
fat mass was expected because GH possesses lipolytic and
antilipogenic effects on adipose tissue, and removal of this
action should result in increased fat mass (33, 34). More-
over, GHRϪ/Ϫ mice have repeatedly been shown to be
obese relative to littermate controls throughout life (8).
This is also true for FaGHRKO mice up to 1 year of age;
thus, our first hypothesis that FaGHRKO mice would
have increased adiposity is supported. However, there are
important differences in the adiposity of FaGHRKO mice
relative to GHRϪ/Ϫ mice. In this study, all adipose depots
(four WAT depots and interscapular BAT) analyzed with
the exception of the perigonadal (epidid-
ymal) fat pad in males were significantly
enlarged in the FaGHRKO mice com-
pared with controls. The fact that
perigonadal was the lone exception in
males is not surprising because previous
studies have shown this particular depot
to be the least responsive to GH treat-
ment (24). In contrast to FaGHRKO
mice, our laboratory and others have
shown that GHRϪ/Ϫ mice in a similar
C57BL/6 genetic background have a
preferential enlargement of the sc depot
and occasionally the retroperitoneal de-
pot with other fat pads being propor-
tional to their dwarf size (8, 35). It has
been proposed that the obesity in
GHRϪ/Ϫ mice may represent a form of
“healthy” obesity because of the prefer-
ential accumulation of excess of sc adi-
pose tissue (10). Although the sc WAT
mass did show the largest increase in
mass compared with other depots, all fat
pads (except for perigonadal in males) in
the FaGHRKO mice were enlarged. The
enlargement of most depots, as seen in
FaGHRKO mice, may not provide the
same benefit to lifespan and health as
seen in the GHRϪ/Ϫ mice. Ongoing lon-
gevity studies will provide important in-
formation about the long-term outcome
of this alternative fat deposition.
Other than leptin, circulating adipokine levels in the
FaGHRKO mice are distinct from what has previously
been reported for GHRϪ/Ϫ mice. Leptin levels in male
GHRϪ/Ϫ mice are consistently elevated although female
mice are less thoroughly studied (12). Likewise, leptin
levels are increased in female FaGHRKO mice, whereas
the increase in males did not reach statistical significance.
The elevation of leptin in both GHRϪ/Ϫ and female
FaGHRKO mice is not surprising considering that these
mice are obese, and this hormone has been shown to be
consistently and positively correlated with an increase in
fat mass. However, the physiological consequences of el-
evated leptin in these mice have not been thoroughly stud-
ied. Possible connections between elevated leptin and al-
terations in adaptive and innate immunity (36) as well as
organ function and disease states (37) are worthy of fur-
ther exploration. However, it should also be noted that
obese states are typically associated with leptin resistance
(38); thus, the increased leptin in these mice may not be
Figure 5. GHR deletion in adipose tissue does not alter glucose homeostasis. Fasting blood
glucose (A), fasting serum insulin (B), and c-peptide (C) are shown for FaGHRKO (FFCx; black
bars) and controls (FFxx; white bars). D and E, GTTs were performed at 5 months and 1 week
of age after a 12-hour fast by ip injection of a 10% glucose solution at 0.01 ml/g body
weight for FaGHRKO (FFCx; black boxes) and controls (FFxx; white circles) in males (D) and
females (E). F and G, ITTs were performed in males (F) and females (G) at 5 months and 2
weeks of age in nonfasted mice via ip injection of 0.075 U/ml insulin solution at 0.01 ml/g
body weight. Values in A–G are represented as mean Ϯ SEM (n ϭ 15–16 per group).
*P Ͻ .05, FaGHRKO (FFCx) vs. control (FFxx).
8 List et al Disruption of the GHR Gene in Adipose Tissue Mol Endocrinol, March 2013, 27(3):0000–0000
9. accompanied by significant changes in leptin action at the
cellular level.
Unlike leptin, adiponectin levels have been shown to
decrease as fat mass increases (39). In contrast, GHRϪ/Ϫ
mice are obese yet have elevated levels of adiponectin.
This observation in GHRϪ/Ϫ mice suggests that GH may
negatively regulate adiponectin. Cell culture studies have
also shown this to be the case because GH treatment of
differentiated 3T3-L1 adipocytes results in a decrease in
adiponectin levels (40). Furthermore, studies on GH-
transgenic and GH-deficient rodents suggest that GH
suppresses adiponectin secretion (12). Based on the above
observations, our second hypothesis was that disruption
of the GHR in adipose tissue will increase adiponectin
levels similar to what is seen in GHRϪ/Ϫ mice. Sur-
prisingly, we found that FaGHRKO mice did not have
elevated levels of adiponectin, but rather had no change
in females or decreased levels in males. Thus, our sec-
ond hypothesis did not hold true. This suggests that any
negative regulatory activity of GH on adipose tissue, as
observed in global GHRϪ/Ϫ mice, is dependent on the
consequences of disrupting GHR in other tissues or
that GHR is not important for regulating adiponectin
secretion.
We also measured resistin and adipsin, two additional
adipokines, in FaGHRKO mice. Resistin levels remained
unchanged and adipsin levels were significantly decreased
in both sexes. Recently, it has been shown that resistin is
increased in the GHRϪ/Ϫ mice (41). Thus, it appears
that, like adiponectin, circulating resistin also is differen-
tially regulated when GHR is selectively disrupted from
adipose tissue as opposed to global disruption. Adipsin
levels have not been assessed in GHRϪ/Ϫ mice. Because
adipsin is thought to function primarily in the alternative
pathway of the complement system, it is possible that the
FaGHRKO mice have alterations to immune function,
which was not assessed in this study. However, recent
evidence suggests that the complement system in adipose
tissue may play an important role in fat storage and insu-
lin sensitivity (42). Thus, further investigation into the
effects of adipsin reduction in FaGHRKO and GHRϪ/Ϫ
mice would also be of interest.
Various measures of glucose homeostasis did not differ
between FaGHRKO mice and controls including fasting
glucose, fasting insulin, glucose tolerance, and insulin tol-
erance. We expected adipose tissue to dispose of glucose
more efficiently than control mice because the diabeto-
genic action of GH action was lacking in this tissue. How-
ever, it appears that removal of GHR in adipose tissue
does not produce a measurable effect on whole-body
readouts of glucose metabolism. Because the largest pro-
portion of glucose disposal occurs in skeletal muscle (43),
it is likely that adipose tissue’s contribution to whole-
body glucose disposal is negligible. Moreover, most other
Figure 6. GHR gene disruption in adipose tissue does not alter RNA
levels encoding intracellular signaling molecules that are known to
affect glucose metabolism in WAT. Retroperitoneal WAT from female
FaGHRKO mice was collected at 8 months of age. Relative mRNA levels
of PGC1␣, SIRT1, PPAR␣, PPAR␦, PPAR␥, 4-1BB, SREBP, FAS, and
GLUT4, are shown for FaGHRKO (FFCx; black bars) and controls (FFxx;
white bars). Values are presented relative to control values Ϯ SEM
(n ϭ 6–7 per group). FaGHRKO (FFCx) vs control (FFxx).
Table 2. IGF-1 and IGFBP Levels of FaGHRKO and Control Male and Female Mice
Fat GHR؊/؊ (Male) Fat GHR؊/؊ (Female)
FFxx FFCx P Value FFxx FFCx P Value
GH and IGF-1
GH, n ϭ 9–10 (ng/ml) 7.9 Ϯ 3.2 12.1 Ϯ 4.5 .466 7.6 Ϯ 1.6 7.9 Ϯ 2.1 .915
IGF-1, n ϭ 9–10 (ng/ml) 503 Ϯ 19 613 Ϯ 30a
.006 655 Ϯ 31 705 Ϯ 32 .275
IGFBPs
IGFBP-1, n ϭ 9–10 (pg/ml) 7.4 Ϯ 2.0 11 Ϯ 1.7 .147 22 Ϯ 6.4 38 Ϯ 13 .285
IGFBP-2, n ϭ 9–10 (pg/ml) 160 Ϯ 8.5 172 Ϯ 8.0 .329 199 Ϯ 10 204 Ϯ 16 .789
IGFBP-3, n ϭ 9–10 (pg/ml) 189 Ϯ 19 229 Ϯ 14 .109 248 Ϯ 13 241 Ϯ 11 .711
IGFBP-5, n ϭ 9–10 (pg/ml) 5.8 Ϯ 0.3 7 Ϯ 0.5 .062 7 Ϯ 0.4 9 Ϯ 0.8a
.033
IGFBP-6, n ϭ 9–10 (pg/ml) 133 Ϯ 12 142 Ϯ 11 .586 155 Ϯ 8.8 134 Ϯ 14 .228
IGFBP-7, n ϭ 9–10 (pg/ml) 13 Ϯ 1.0 13 Ϯ 1.2 .850 13 Ϯ 1.4 15 Ϯ 1.5 .428
Abbreviations: FFxx, controls; FFCx, FaGHRKO. Circulating peptide values of male and female mice at 6 months of age. Values are represented as
mean Ϯ SEM (n ϭ 9–10 per group). a
Significance with P values given to the right.
Mol Endocrinol, March 2013, 27(3):0000–0000 mend.endojournals.org 9
10. adipose tissue-specific mouse models show similar lack of
effect on whole-body glucose metabolism. A partial ex-
ception can be seen with adipose-specific overexpression
of GLUT4 in isolated adipocytes ex vivo, where a 2- to
3-fold increase in glucose disposal is reported; however,
no difference in insulin-stimulated glucose disposal can be
detected in vivo (44). When adipose tissue is selectively
made insulin resistant by fat-specific removal of insulin
receptor (seen in the FIRKO mouse), no changes in glu-
cose or insulin tolerance occur at a young age (2 mo), but
these parameters do change in older mice (10 mo); thus, it
is also possible that we may see changes at more advanced
ages (45). Alternatively, adiponectin is considered a po-
tent insulin sensitizer, and high levels of this adipokine
could be important for the increased insulin sensitivity in
GHRϪ/Ϫ mice (12). However, adiponectin levels are not
increased in FaGHRKO mice, which may partially ex-
plain why no improvements were seen in glucose homeo-
stasis. Furthermore, the difference in glucose metabolism
may also be partially affected by location of fat storage.
As discussed earlier, GHRϪ/Ϫ mice have increased adi-
posity primarily due to increased sc adipose tissue (8).
FaGHRKO mice have increases in all WAT depots includ-
ing mesenteric, which is thought to have a negative effect
on glucose homeostasis (10). Analysis of genes involved in
glucose metabolism by quantitative real time RT-PCR in
adipose tissue of FaGHRKO mice revealed similar results
to that of whole-body analysis of glucose metabolism as
no changes were seen. We hypothesized that the
FaGHRKO mice would have improved glucose homeo-
stasis; however, this was not the case.
Interestingly, FaGHRKO mice are quite different from
global GHRϪ/Ϫ mice. We expect that the differences
between the global GHRϪ/Ϫ and FaGHRKO mice with
regard to nonadipose parameters (such as body size) are
due to the fact that GHR is disrupted in all tissues in
GHRϪ/Ϫ mice whereas FaGHRKO mice have normal
levels of GHR in nonadipose tissues. In contrast, differ-
ences in adipose tissue parameters (such as adiponectin
production and depot differences) are difficult to explain
because the GHR is disrupted in adipose tissue in both mouse
lines;however,wespeculatethatthesedifferencesareduetothe
action of GH in tissues other than adipose, and these other
tissues, in turn, are able to influence adipose tissue physiology
via endocrine/paracrine mechanisms.
Because this is the first description of the FaGHRKO
mice, many additional studies will be performed. For ex-
ample, analyzing gene expression and/or protein produc-
tion in tissues such as adipose, liver, and muscle will be
needed to investigate the potential of tissue cross talk in
Table 3. Circulating Cytokines, Acute Phase Proteins, and Soluble Receptors of FaGHRKO and Control Male and
Female Mice
Fat GHR؊/؊ (Male) Fat GHR؊/؊ (Female)
FFxx FFCx P Value FFxx FFCx P Value
Cytokines
IL-6, n ϭ 15–16 (pg/ml) 51 Ϯ 13 58 Ϯ 13 .675 30 Ϯ 4 56 Ϯ 7a
.005
MCP-1, n ϭ 15–16 (pg/ml) 112 Ϯ 27 121 Ϯ 27 .819 402 Ϯ 221 135 Ϯ 21 .247
Acute phase 1
Lipocalin-2, n ϭ 9–10 (pg/ml) 59 Ϯ 4 106 Ϯ 22 .061 37 Ϯ 2 49 Ϯ 9 .218
Pentraxin-3, n ϭ 9–10 (pg/ml) 15 Ϯ 1 21 Ϯ 2a
.008 18 Ϯ 2 18 Ϯ 1 .726
Acute phase 2
AGP, n ϭ 9–10 (pg/ml) 176 Ϯ 14 223 Ϯ 21 .083 160 Ϯ 9 214 Ϯ 57 .382
␣-2-Macroglobulin, n ϭ 9–10 (ng/ml) 2490 Ϯ 117 2381 Ϯ 105 .499 2242 Ϯ 98 2139 Ϯ 201 .662
CRP, n ϭ 9–10 (ng/ml) 14 Ϯ 1 17 Ϯ 1 .058 15 Ϯ 1 16 Ϯ 2 .956
Haptoglobin, n ϭ 9–10 (ng/ml) 32 Ϯ 11 69 Ϯ 27 .232 12 Ϯ 2 47 Ϯ 37 .383
Soluble receptor
sCD30, n ϭ 9–10 (pg/ml) 65 Ϯ 19 129 Ϯ 69 .383 145 Ϯ 36 47 Ϯ 17a
.029
sgp130, n ϭ 9–10 (pg/ml) 653 Ϯ 54 973 Ϯ 295 .326 944 Ϯ 362 3142 Ϯ 1777 .266
sIL-1RI, n ϭ 9–10 (pg/ml) 810 Ϯ 94 1084 Ϯ 205 .248 415 Ϯ 67 549 Ϯ 78 .214
sIL-1RII, n ϭ 9–10 (pg/ml) 4601 Ϯ 114 4445 Ϯ 87 .287 3581 Ϯ 370 3193 Ϯ 116 .310
sIL-2Ra, n ϭ 9–10 (pg/ml) 414 Ϯ 34 368 Ϯ 25 .289 394 Ϯ 59 345 Ϯ 22 .430
sIL-4R, n ϭ 9–10 (pg/ml) 1385 Ϯ 105 2305 Ϯ 287a
.010 1734 Ϯ 138 1872 Ϯ 198 .585
sIL-6R, n ϭ 9–10 (pg/ml) 9010 Ϯ 301 8628 Ϯ 362 .434 10 430 Ϯ 956 9888 Ϯ 367 .608
sTNFRI, n ϭ 9–10 (pg/ml) 1457 Ϯ 85 1663 Ϯ 114 .174 1525 Ϯ 146 1515 Ϯ 87 .954
sTNFRII, n ϭ 9–10 (pg/ml) 3398 Ϯ 382 4478 Ϯ 533 .125 2838 Ϯ 396 3235 Ϯ 395 .489
sVEGFR1, n ϭ 9–10 (pg/ml) 2739 Ϯ 115 2826 Ϯ 202 .724 2187 Ϯ 438 1940 Ϯ 110 .574
sVEGFR2, n ϭ 9–10 (ng/ml) 29 Ϯ 1 28 Ϯ 1 .635 30 Ϯ 1 29 Ϯ 2 .768
sVEGFR3, n ϭ 9–10 (ng/ml) 32 Ϯ 1 31 Ϯ 1 .542 32 Ϯ 1 32 Ϯ 1 .566
Abbreviations: FFxx, controls; FFCx, FaGHRKO. Circulating peptide values of male and female mice at 6 mo of age. Values are represented as
mean Ϯ SEM (n ϭ 9–16 per group). a
Significance with P values given to the right.
10 List et al Disruption of the GHR Gene in Adipose Tissue Mol Endocrinol, March 2013, 27(3):0000–0000
11. FaGHRKO vs GHRϪ/Ϫ mice. It also would be of interest
to determine whether local IGF-1 expression is altered in
various tissues of these mice because local IGF-1 may be
decreased in tissues where GHR is absent. Additionally,
we would like to quantify expression of various lipogenic/
lypolytic enzymes (such as lipoprotein lipase, adrenergic
receptors, lipid droplet proteins, and intracellular lipases)
in adipose tissue depots of these mice. Because lipoprotein
lipase has been shown previously to respond to GH dif-
ferently in different adipose tissue depots (33), such stud-
ies may help explain the differences observed in the cur-
rent study. Finally, we now have the capability to cross
various tissue-specific GHRKO lines (such as muscle- and
liver-specific GHRKO mice) with the FaGHRKO line in
order to determine which tissue(s) require GHR disrup-
tion in concert with adipose to achieve a similar pheno-
type as global GHRϪ/Ϫ mice.
In conclusion, FaGHRKO mice share few characteris-
tics with global GHRϪ/Ϫ mice. FaGHRKO mice are
obese with increased total body fat, increased adipocyte
cell size, and increased circulating leptin. However, unlike
global GHRϪ/Ϫ mice, these mice show no improvements
in measures of glucose homeostasis, have normal levels of
resistin, and normal/decreased levels of adiponectin.
Thus, it appears that the increases in adipokines seen in
global GHRϪ/Ϫ mice are probably due to the removal of
GH’s action in all tissues and not a result of deletion of the
GHR in adipose tissue alone.
Acknowledgments
Address all correspondence and requests for reprints to:
John, J. Kopchick, PhD, 101 Konneker Research Laborato-
ries, Ohio University, Athens, Ohio 45701. E-mail:
kopchick@ohio.edu.
This work was supported by the State of Ohio’s Eminent
Scholar Program that includes a gift from Milton and Lawrence
Goll; by National Institutes of Health (NIH) Grants
P01AG031736, AG032290, DK58259, and DK083729; by the
AMVETS; by the Diabetes Institute at Ohio University; and by
Polish Ministry of Science and Higher Education Grant
NN401042638. The floxed GHR mouse strain used for this
research project was generated by the trans-NIH KOMP and
obtained from the KOMP Repository (www.komp.org). NIH
grants to Velocigene at Regeneron, Inc (U01HG004085) and
the CHORI-Sanger-UCDavis Consortium (U01HG004080)
funded the generation of gene-targeted embryonic stem cells for
8500 genes in the KOMP Program and archived and distributed
by the KOMP Repository at University of California Davis and
Children’s Hospital Oakland Research Institute (CHORI)
(U42RR024244).
Disclosure Summary: The authors have nothing to disclose.
References
1. List EO, Sackmann-Sala L, Berryman DE, et al. Endocrine param-
eters and phenotypes of the growth hormone receptor gene dis-
rupted (GHRϪ/Ϫ) mouse. Endocr Rev. 2011;32:356–386.
2. Zhou Y, Xu BC, Maheshwari HG, et al. A mammalian model for
Laron syndrome produced by targeted disruption of the mouse
growth hormone receptor/binding protein gene (the Laron mouse).
Proc Natl Acad Sci USA. 1997;94:13215–13220.
3. Dominici FP, Arostegui Diaz G, Bartke A, Kopchick JJ, Turyn D.
Compensatory alterations of insulin signal transduction in liver of
growth hormone receptor knockout mice. J Endocrinol. 2000;166:
579–590.
4. Coschigano KT, Holland AN, Riders ME, List EO, Flyvbjerg A,
Kopchick JJ. Deletion, but not antagonism, of the mouse growth
hormone receptor results in severely decreased body weights, insu-
lin and IGF-1 levels and increased lifespan. Endocrinology. 2003;
144:3799–3810.
5. Bonkowski MS, Dominici FP, Arum O, et al. Disruption of growth
hormone receptor prevents calorie restriction from improving insu-
lin action and longevity. PLoS ONE. 2009;4:e4567.
6. Ikeno Y, Hubbard GB, Lee S, et al. Reduced incidence and delayed
occurrence of fatal neoplastic diseases in growth hormone receptor/
binding protein knockout mice. J Gerontol A Biol Sci Med Sci.
2009;64:522–529.
7. Guevara-Aguirre J, Balasubramanian P, Guevara-Aguirre M, et al.
Growth hormone receptor deficiency is associated with a major
reduction in pro-aging signaling, cancer, and diabetes in humans.
Sci Transl Med. 2011;3:70ra13.
8. Berryman DE, List EO, Palmer AJ, et al. Two-year body composi-
tion analyses of long-lived GHR null mice. J Gerontol A Biol Sci
Med Sci. 2010;65:31–40.
9. Egecioglu E, Bjursell M, Ljungberg A, et al. Growth hormone re-
ceptor deficiency results in blunted ghrelin feeding response, obe-
sity, and hypolipidemia in mice. Am J Physiol Endocrinol Metab.
2006;290:E317–E325.
10. Berryman DE, List EO, Sackmann-Sala L, Lubbers E, Munn R,
Kopchick JJ. Growth hormone and adipose tissue: beyond the adi-
pocyte. Growth Horm IGF Res. 2011;21:113–123.
11. Kloting N, Fasshauer M, Dietrich A, et al. Insulin-sensitive obesity.
Am J Physiol Endocrinol Metab. 299:E506–E515.
12. Berryman DE, List EO, Coschigano KT, Behar K, Kim JK, Kop-
chick JJ. Comparing adiposity profiles in three mouse models with
altered GH signaling. Growth Horm IGF Res. 2004;14:309–318.
13. Bik W, Baranowska B. Adiponectin—a predictor of higher mortal-
ity in cardiovascular disease or a factor contributing to longer life?
Neuro Endocrinol Lett. 2009;30:180–184.
14. Ibanez L, Lopez-Bermejo A, Diaz M, Jaramillo A, Marin S, de
Zegher F. Growth hormone therapy in short children born small for
gestational age: effects on abdominal fat partitioning and circulat-
ing follistatin and high-molecular-weight adiponectin. J Clin Endo-
crinol Metab. 2010;95:2234–2239.
15. Nilsson L, Binart N, Bohlooly YM, et al. Prolactin and growth
hormone regulate adiponectin secretion and receptor expression in
adipose tissue. Biochem Biophys Res Commun. 2005;331:1120–
1126.
16. Laron Z, Ginsberg S, Lilos P, Arbiv M, Vaisman N. Body compo-
sition in untreated adult patients with Laron syndrome (primary
GH insensitivity). Clin Endocrinol (Oxf). 2006;65:114–117.
17. Fan Y, Menon RK, Cohen P, et al. Liver-specific deletion of the
growth hormone receptor reveals essential role of GH signaling in
hepatic lipid metabolism. J Biol Chem. 2009;284(30):19937–
19944.
18. Mavalli MD, DiGirolamo DJ, Fan Y, et al. Distinct growth hor-
mone receptor signaling modes regulate skeletal muscle develop-
ment and insulin sensitivity in mice. J Clin Invest. 2010;120:4007–
4020.
Mol Endocrinol, March 2013, 27(3):0000–0000 mend.endojournals.org 11
12. 19. Vijayakumar A, Wu Y, Sun H, et al. Targeted loss of GHR signaling
in mouse skeletal muscle protects against high-fat diet-induced met-
abolic deterioration. Diabetes. 2012;61:94–103.
20. Wu Y, Liu C, Sun H, et al. Growth hormone receptor regulates 
cell hyperplasia and glucose-stimulated insulin secretion in obese
mice. J Clin Invest. 2011;121:2422–2426.
21. Skarnes WC, Rosen B, West AP, et al. A conditional knockout
resource for the genome-wide study of mouse gene function. Na-
ture. 2011;474:337–342.
22. Masternak MM, Al-Regaiey KA, Del Rosario Lim MM, et al. Ca-
loric restriction results in decreased expression of peroxisome pro-
liferator-activated receptor superfamily in muscle of normal and
long-lived growth hormone receptor/binding protein knockout
mice. J Gerontol A Biol Sci Med Sci. 2005;60:1238–1245.
23. Zhang Y, Guan R, Jiang J, et al. Growth hormone (GH)-induced
dimerization inhibits phorbol ester-stimulated GH receptor prote-
olysis. J Biol Chem. 2001;276:24565–24573.
24. List EO, Palmer AJ, Berryman DE, Bower B, Kelder B, Kopchick JJ.
Growth hormone improves body composition, fasting blood glu-
cose, glucose tolerance and liver triacylglycerol in a mouse model of
diet-induced obesity and type 2 diabetes. Diabetologia. 2009;52:
1647–1655.
25. Salmon DM, Flatt JP. Effect of dietary fat content on the incidence
of obesity among ad libitum fed mice. Int J Obes. 1985;9:443–449.
26. Tchoukalova YD, Koutsari C, Votruba SB, et al. Sex- and depot-
dependent differences in adipogenesis in normal-weight humans.
Obesity (Silver Spring). 2010;18:1875–1880.
27. Wueest S, Rapold RA, Schumann DM, et al. Deletion of Fas in
adipocytes relieves adipose tissue inflammation and hepatic mani-
festations of obesity in mice. J Clin Invest. 2010;120:191–202.
28. Kumar A, Lawrence JC Jr, Jung DY, et al. Fat cell-specific ablation
of rictor in mice impairs insulin-regulated fat cell and whole-body
glucose and lipid metabolism. Diabetes. 2010;59:1397–1406.
29. He W, Barak Y, Hevener A, et al. Adipose-specific peroxisome
proliferator-activated receptor ␥ knockout causes insulin resistance
in fat and liver but not in muscle. Proc Natl Acad Sci USA. 2003;
100:15712–15717.
30. Abel ED, Peroni O, Kim JK, et al. Adipose-selective targeting of the
GLUT4 gene impairs insulin action in muscle and liver. Nature.
2001;409:729–733.
31. Urs S, Harrington A, Liaw L, Small D. Selective expression of an
aP2/fatty acid binding protein 4-Cre transgene in non-adipogenic
tissues during embryonic development. Transgenic Res. 2006;15:
647–653.
32. Makowski L, Boord JB, Maeda K, et al. Lack of macrophage fatty-
acid-binding protein aP2 protects mice deficient in apolipoprotein E
against atherosclerosis. Nat Med. 2001;7:699–705.
33. Richelsen B, Pedersen SB, Borglum JD, Moller-Pedersen T, Jor-
gensen J, Jorgensen JO. Growth hormone treatment of obese
women for 5 wk: effect on body composition and adipose tissue
LPL activity. Am J Physiol. 1994;266:E211–E216.
34. Etherton TD. Porcine growth hormone: a central metabolic hor-
mone involved in the regulation of adipose tissue growth. Nutri-
tion. 2001;17:789–792.
35. Liu JL, Coschigano KT, Robertson K, et al. Disruption of growth
hormone receptor gene causes diminished pancreatic islet size and
increased insulin sensitivity in mice. Am J Physiol Endocrinol
Metab. 2004;287:E405–E413.
36. Moraes-Vieira PM, Bassi EJ, Araujo RC, Camara NO. Leptin as a
link between the immune system and kidney-related diseases: lead-
ing actor or just a coadjuvant? Obes Rev. 2012;13:733–743.
37. Mantzoros CS, Magkos F, Brinkoetter M, et al. Leptin in human
physiology and pathophysiology. Am J Physiol Endocrinol Metab.
2011;301:E567–E584.
38. Moon HS, Matarese G, Brennan AM, et al. Efficacy of metreleptin
in obese patients with type 2 diabetes: cellular and molecular path-
ways underlying leptin tolerance. Diabetes. 2011;60:1647–1656.
39. Arita Y, Kihara S, Ouchi N, et al. Paradoxical decrease of an adi-
pose-specific protein, adiponectin, in obesity. Biochem Biophys Res
Commun. 1999;257:79–83.
40. Wolfing B, Neumeier M, Buechler C, Aslanidis C, Scholmerich J,
Schaffler A. Interfering effects of insulin, growth hormone and glu-
cose on adipokine secretion. Exp Clin Endocrinol Diabetes. 2008;
116:47–52.
41. Vijeyta F. Effects of Growth Hormone on Circulating Resistin Lev-
els in Mice. [masters’ thesis] Ohio University, Athens, Ohio: 2012;
1–141.
42. Schaffler A, Scholmerich J. Innate immunity and adipose tissue
biology. Trends Immunol. 2010;31:228–235.
43. DeFronzo RA. Pathogenesis of type 2 diabetes: metabolic and mo-
lecular implications for identifying diabetes genes. Diabetes Rev.
1997;5:177–269.
44. Carvalho E, Kotani K, Peroni OD, Kahn BB. Adipose-specific over-
expression of GLUT4 reverses insulin resistance and diabetes in
mice lacking GLUT4 selectively in muscle. Am J Physiol Endocrinol
Metab. 2005;289:E551–E561.
45. Bluher M, Michael MD, Peroni OD, et al. Adipose tissue selective
insulin receptor knockout protects against obesity and obesity-re-
lated glucose intolerance. Dev Cell. 2002;3:25–38.
12 List et al Disruption of the GHR Gene in Adipose Tissue Mol Endocrinol, March 2013, 27(3):0000–0000