More Related Content
Similar to 1402-5031-2-PB
Similar to 1402-5031-2-PB (20)
1402-5031-2-PB
- 1. Mangoyi et al, Afr. J. Pharmacol. Ther. 2015. 4(4): 169-174
A KeSoBAP Publication ©2015. All rights reserved. ISSN 2303-9841
169
Effect of Irbesartan on Glucose Tolerance in a
Type 2 Diabetes Mellitus Mouse Model
Japhet Mangoyi a,*, and Star Khoza a
a Department of Clinical Pharmacology, College of Health Sciences, University of Zimbabwe
_____________
* Corresponding author: Department of Clinical Pharmacology, College of Health Sciences, P.O. Box A178, Avondale,
Harare, Zimbabwe. Tel: +263 4 705581. Email: japhetmangoyi@gmail.com
Background: Angiotensin receptor blockers (ARBs) have been reported to affect glycaemic control in both animals
and humans. A few studies have evaluated the effects of irbesartan on blood glucose levels and ARBs are
recommended in patients with comorbid diabetes and hypertension. However, the effect of irbesartan on insulin
resistance and glucose tolerance is inconclusive and contradicting.
Objectives: To evaluate the effect of irbesartan on blood glucose levels and glucose tolerance in diabetic and non-
diabetic mice.
Materials and methods: Diabetes was induced in 18 obese BALB/c mice fed on high fat diet using alloxan
monohydrate 150mg/kg via the intra-peritoneal route. Non-diabetic mice were assigned to three treatment groups
(n=6/group) and each group received either of the following treatments: 20mg/kg irbesartan or 75mg/kg irbesartan
or vehicle. Diabetic mice were also divided into three groups and each group received one of the three treatments
mentioned above. Drug administration was done daily via oral gavage for 14 days. Blood glucose levels were
measured on day 1 (baseline values), day 8, and day 13 of treatment. An oral glucose tolerance test was carried out on
day 14 after administration of 50% dextrose at the dose of 1g/kg body weight. Blood glucose levels at 15, 30, 60 and
120 minutes were measured during the oral glucose tolerance test.
Results: Irbesartan at the dose of 20mg/kg (-39.44% ±8.96, p=0.0177) and 75mg/kg (-40.07% ±6.27, p=0.0111)
significantly lowered blood glucose levels in diabetic mice. However, irbesartan 20mg/kg (-14.87% ±10.13, p>0.9999)
and 75mg/kg (-9.07%±3.77, p>0.9999) did not significantly change blood glucose levels in non-diabetic mice. In non-
diabetic mice there was only a modest difference in AUC in the irbesartan20mg/kg (AUC=28.73mmol/Lmin,
p=0.6435), 75mg/kg (AUC=26.66mmol/Lmin, p>0.9999) compared to the non-diabetic control (AUC=26.63
mmol/Lmins). Although there was a slight improvement in glucose tolerance in diabetic mice, irbesartan 20mg/kg
(AUC=55.35mmol/Lmin, p>0.9999) and 75mg/kg (AUC=45.54mmol/Lmin, p=0.1737) had no significant effect on
glucose tolerance compared to the diabetic control group (AUC=63.53mmol/Lmin).
Conclusion: At standard treatment doses, irbesartan had a significant hypoglycaemic effect without significantly
improving glucose tolerance in diabetic mice.
Key words: Irbesartan, glycemic effects, glucose tolerance, Type 2 diabetes, mouse model
Received: July, 2015
Published: December, 2015
1. Introduction
Angiotensin converting enzyme (ACE) inhibitors and
angiotensin receptor blockers (ARBs) are two major
classes of drugs used in the management of
hypertension that have similar efficacy(Strippoli et al.,
2006).Their renoprotective effects have been observed
to be better than other classes of antihypertensive
agents (Strippoli et al, 2006, Sarafidis et al, 2008,
Strippoli et al, 2005). Recent evidence suggests that the
benefit of ARBs and ACEIs in patients with diabetes go
beyond their renoprotective effects(Ram, 2011). They
have been linked with positive glycaemic effects in
African Journal of Pharmacology and Therapeutics Vol. 4 No. 4 Pages 169-174, 2015
Open Access to full text available at http://journals.uonbi.ac.ke/ajpt
Research Article
- 2. Mangoyi et al, Afr. J. Pharmacol. Ther. 2015. 4(4): 169-174
A KeSoBAP Publication ©2015. All rights reserved. ISSN 2303-9841
170
diabetic mellitus (Sica, 2002, ALLHAT, 2002, Hansson et
al, 1999).
Although ACEI and ARBs are now widely considered as
hypoglycaemic in nature, there is conflicting evidence
regarding their glycaemic effects. Some studies have
reported no change in fasting blood glucose levels while
other studies suggest that the hypoglycaemic effects are
neither a class property nor dose-dependent (Negro et
al, 2006, Benson et al, 2004, Munoz et al, 2009,
Henriksen et al, 2001). In a study by Negro et al.,
telmisartan was observed to be superior to irbesartan
in decreasing insulin resistance (Negro et al, 2006).
Similarly, Benson et al., reported that telmisartan
reduces fasting blood glucose levels (Benson et al,
2004). Significant decreases in HbAlc and fasting
plasma glucose (FPG) were also observed after 6
months and 12 months treatment with telmisartan
(Benson et al, 2004). However, Derosa et al., reported
that 12 months treatment with irbesartan resulted in
non-significant decreases in FPG and Hb1Ac (Derosa et
al, 2006). Similarly, the study by Usuiet al., concluded
that fasting plasma glucose and HbA1c were not
affected by 6 months of treatment with telmisartan in
diabetic patients (Usui et al, 2007).
Experimental studies using animal models have also
produced equivocal findings. In a study by Munoz et al.,
amelioration of insulin resistance in adipose tissue was
observed in male obese Zucker rats (fa/fa) treated with
50 mg/kg irbesartan for 6 months (Munoz et al, 2009).
Similarly, angiotensin receptor blockade with
olmesartan increased pancreatic insulin secretion and
decreased glucose intolerance during glucose
supplementation in a model of metabolic syndrome in
rats(Rodriguez et al., 2012).In contrast, Aritomi et al.,
reported that use of valsartan alone did not cause a
significant decrease in blood glucose levels in rats
(Aritomi et al, 2012). However, in the same study
significant hypoglycaemic effects were observed when
valsartan was combined with cilnidipine (a calcium
channel blocker) (Aritomi et al, 2012).
Both clinical and animal studies conducted to date have
provided inconsistent evidence regarding the glycaemic
effects of angiotensin receptor blockers in patients with
co-morbid hypertension and diabetes mellitus.
Therefore, there is need for more experimental
evidence regarding the glycaemic effects of angiotensin
receptor blockers. Irbesartan is a potent and selective
angiotensin II subtype 1 receptor antagonist indicated
for use in patients with hypertension, including those
with type 2 diabetes mellitus and nephropathy
(Bramlage et al, 2009, Ruilope and Segura, 2003). The
objective of this study was to evaluate the effect of
irbesartan on blood glucose control and glucose
tolerance in diabetic and non-diabetic mice models.
2. Materials and Methods
2.1 Materials
Irbesartan tablets (Winthrop Pharmaceutics; Midrand,
South Africa, Batch number: 3A699), normal saline, 5%
dextrose, 50% dextrose, glucose monitoring machine kit
where sourced from local suppliers. Standard normal
mouse feed and high fat diet were obtained from a local
stock feed manufacturer (National Foods Company of
Zimbabwe). Alloxan monohydrate was purchased from
Sigma Chemicals in Germany (Batch Number.
BCBK4716V).
2.2 Study design and induction of Type I diabetes
Thirty six male BALB/c mice were purchased from a
regulated breeder (Department of Veterinary Services,
Ministry of Agriculture).
The mice were divided into two broad experimental
groups. One group was fed on a standard mice diet
(n=18) and the other group (n=18) was fed on a high-fat
diet. Both groups were fed for six weeks. This was done
to ensure induction of obesity (and insulin resistance)
in the high fat diet group (Panchal and Brown, 2011).
Diabetes mellitus was induced on 18 overnight-fasted
obese mice using a single intraperitoneal injection of
150 mg/kg body weight of alloxan monohydrate
dissolved in 0.9% w/v saline solution(Shankar and
Mehendale, 2005). The mice were given 5% glucose
solution for the three days post-diabetes induction to
combat early phase hypoglycemia (Mishra A et al.,
2010).
After three days of the injection, blood samples were
drawn from tail vein of overnight fasted animals and
fasting glucose levels were determined to confirm the
development of diabetes (i.e. above 7mmol/l) (WHO,
2005).
2.3 Drug Administration
Non-diabetic mice were divided into three groups
(n=6/group) with each group receiving one of the
following treatments: 20mg/kg irbesartan or 75mg/kg
irbesartan or vehicle (distilled water).
Diabetic mice were also divided into three groups and
each group was treated with one of the following
treatments: 20mg/kg irbesartan or 75mg/kg irbesartan
or vehicle. The treatments were administered daily via
oral gavage for 14 days. Irbesartan tablets were crushed
and suspended in distilled water every morning just
before administration. Blood glucose levels were
measured on day 1(baseline), day 8, and day 13 of
irbesartan administration.
2.4 Glucose tolerance test
An Oral Glucose Tolerance Test (OGTT) was carried out
on day 14 after commencing irbesartan dosing.
Following an overnight fast, a glucose load was
administered at a dose of 1g/kg and blood glucose
levels were measured over a span of 2 hours (15
minutes, 30 minutes, one hour and 2 hours). A dose of
1g/kg of glucose was chosen because in higher doses
(>2g/kg) the amount of glucose to which the lean tissue
is exposed in an obese mouse will be disproportionately
high compared with that in a non-obese mouse with
similar lean mass thus obese mice could be
misdiagnosed as being glucose intolerant simply
because they receive more glucose for the same lean
body mass (Andrikopoulos et al., 2008). Measurement
of blood glucose was done using an SD CodeFreeTM
Blood Glucose Meter (SD Biosensor, Inc Korea). The
meter uses the glucose oxidase method to determine
glucose levels.
- 3. Mangoyi et al, Afr. J. Pharmacol. Ther. 2015. 4(4): 169-174
A KeSoBAP Publication ©2015. All rights reserved. ISSN 2303-9841
171
2.5 Statistical Analysis
GraphPad® Prism Version 6.0 (California, USA)
software was used for data analysis. Blood glucose
levels and area under the curves (AUCs) were compared
across the treatment groups using one away ANOVA.
AUC is a measure of glucose exposure or rate of glucose
utilisation. A high value of AUC represents poor glucose
control. AUC was determined by the trapezoidal rule (a
numerical integration method used to approximate the
integral or the AUC) using GraphPad® Prism Version
6.0 (Shi-Tao. et al, 1991). Where there was statistical
significant difference, Bonferonni post-hoc test was
used during paired comparisons. The significance level
was set at α=0.05.
2.6 Ethical considerations
The study was approved by the Joint Parirenyatwa
Hospital and College of Health Sciences Research
Committee (JREC), University of Zimbabwe (approval
number: JREC/125/14). Animals were handled
following the principles outlined in the Zimbabwe
Animal Experimentation Act of 1963.
3. Results
Table 1 shows the actual blood glucose levels recorded
at baseline, on day 8, and day 13 of treatment in both
diabetic and non-diabetic mice.
Table 1: Actual blood glucose levels before the dosing on specific days
Experimental group
Baseline (day 1) (mmol/L)
Mean±SEM
Day 8 (mmol/L)
Mean±SEM
Day 13 (mmol/L)
Mean±SEM
Non-diabetic mice
Control 6.43±0.32 6.18±0.25 6.10±0.10
Irbesartan 20 mg/kg 6.42±0.22 6.77±0.13 5.9±0.21
Irbesartan 75 mg/kg 6.47±0.20 6.77±0.48 6.32±0.22
Diabetic mice
Negative Control 13.85±3.01 11.25±2.15 12.23±2.58
Irbesartan 20 mg/kg 14.98±2.07 12.80±2.69 9.34±2.48
Irbesartan 75 mg/kg 14.30±2.66 11.25±2.29 9.42±2.58
Effect of irbesartan on blood glucose levels in non-
diabetic mice
Figures 1 and 2 show the percentage change from
baseline in blood glucose levels in non-diabetic mice on
day 8 and day 13, respectively. On day 8, only the
control group had a decrease in blood glucose (Mean= -
3.62%; SEM=1.18). The other treatment groups showed
an increase in blood glucose levels: 20mg/kg (Mean=
+6.20%;SEM=4.76), and 75mg/kg (Mean=+5.39%;
SEM=8.78). There was no significant difference in the
change in blood glucose levels on day 8 in non-diabetic
mice that were administered 20mg/kg irbesartan,
75mg/kg irbesartan, and control group (F=0.8819;
d.f.=2;15; p=0.4344). On day 13, all the three groups had
reduced blood glucose values. The group administered
20mg/kg irbesartan had the greatest change in blood
glucose levels (Mean= -14.87%; SEM=10.13), followed
by the group administered 75mg/kg irbesartan (Mean=
-9.06%; SEM=3.77) with the control group showing the
least change (Mean= -7.33%; SE=1.77). However, there
was no significant difference in the change in blood
glucose levels between mice that were administered
20mg/kg irbesartan, 75mg/kg irbesartan, and the
control group (F=0.6900; d.f.=2;15; p=0.6837).
Effect of irbesartan on blood glucose levels in
diabetic mice
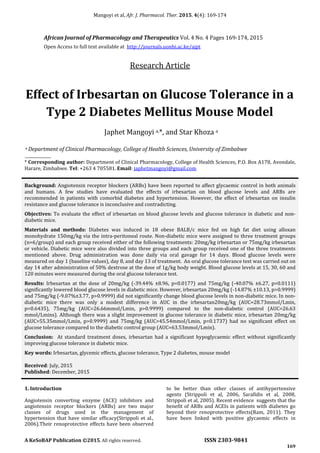
Figure 3 shows the percentage change in blood glucose
levels in diabetic mice after 8 days of drug
administration. All the groups showed a decrease in
blood glucose levels with the group administered
75mg/kg irbesartan (Mean= -22.19%; SEM=4.65)
showing the highest decrease followed by the positive
control (P/control) group (Mean= -16.99%; SEM=3.10).
There was no significant difference in the blood glucose
changes between the 20mg/kg irbesartan group,
75mg/kg irbesartan group, and the P/control group
(F=1.240; d.f.=2;14; p=0.3245).
Figure 4 shows the percentage change in blood glucose
levels in diabetic mice after 13 days of drug
administration. All the groups showed a decrease in
blood glucose levels with the group administered
75mg/kg irbesartan showing the highest decrease
(Mean= -40.07%; SEM=6.27). The P/control group
showed the least decrease (Mean= -11.36; SEM=1.59).
There was a significant difference in the change in blood
glucose levels between diabetic mice that were
administered 20mg/kg irbesartan, 75mg/kg irbesartan,
and the P/control group (F=7.674; d.f. =2;14;
p=0.0056).
A Bonferroni post-hoc test showed that the decrease in
blood glucose levels was higher in the 20mg/kg
irbesartan group (-39.44%) than in the P/control group
(-11.36%) (p =0.0177). There was also a significant
difference in the change in blood glucose levels in
diabetic mice that were administered 75mg/kg
irbesartan (-40.07%) compared to P/control group (-
11.36%) (p =0.0111).
- 4. Mangoyi et al, Afr. J. Pharmacol. Ther. 2015. 4(4): 124-129
A KeSoBAP Publication ©2013. All rights reserved. ISSN 2303-9841
171
%changeinbloodglucose
Figure 1: Percentage change in blood glucose from baseline
to day 8 in non-diabetic mice; Data are expressed as the mean
± SEM
Figure 2: Percentage change in blood glucose from baseline
to day 13 in non-diabetic mice; Data are expressed as the
mean ± SEM
20mg/kg 75mg/kg P/Control
-30
-20
-10
0
Group
20mg/kg
75mg/kg
P/Control
Figure 3: Percentage change in blood glucose from baseline
to day 8 in diabetic mice; Data are expressed as the mean ±
SEM
Figure 4: Percentage change in blood glucose from baseline
to day 13 in diabetic mice; Data are expressed as the mean ±
SEM
Figure 5: Effect of irbesartan on oral glucose tolerance in
non-diabetic mice; Data are expressed as mean ± SEM
Figure 6: Effect of irbesartan on oral glucose tolerance in
diabetic mice; Data are expressed as mean ± SEM
Effect of irbesartan on glucose tolerance in both
diabetic and non-diabetic mice
Figure 5 and 6 show the area under the curve (AUC)
obtained during the OGTT in non-diabetic and diabetic
mice, respectively. In non-diabetic mice, the AUCs of the
different treatment groups were almost similar,
20mg/kg irbesartan group (Mean=28.73mmol/L;
SEM=0.52), 75mg/kg irbesartan group
(Mean=26.66mmol/L; SEM=0.74) and Control
(Mean=27.24mmol/L; SEM=1.07).
There was no significant difference in the glucose
tolerance across the three treatment groups (F=1.734;
d.f.=2;15; p=0.2102).In diabetic mice, the 75mg/kg
irbesartan group had the lowest AUC
(Mean=45.54mmol/L; SEM=5.81) reflecting an
improvement in glucose tolerance compared to the
P/control group (Mean=63.43mmol/L; SEM=4.44). The
AUC of the 20mg/kg irbesartan group was also lower
than the P/control group reflection of a possible
improvement in glucose tolerance
(Mean=55.35mmol/L; SEM=8.78).
- 5. Mangoyi et al, Afr. J. Pharmacol. Ther. 2015. 4(4): 169-174
A KeSoBAP Publication ©2015. All rights reserved. ISSN 2303-9841
173
However, there was no significant difference in the
glucose tolerance across the three treatment groups
(F=2.139; d.f.=2;14; p=0.1547).
4. Discussion
Analysis of blood glucose levels in non-diabetic mice
after eight days and 13 days of treatment in all the three
groups (20mg/kg and 75mg/kg irbesartan and control)
did not show any significant changes or decreases.
These findings are consistent with a study by Onishi et
al., who observed that irbesartan at doses of 50mg and
100mg in haemodialysis hypertensive patients does not
cause any significant changes in blood glucose levels
(Onishi et al, 2013). Similarly, Maeda et al., concluded
that irbesartan at 50mg/kg does not cause any
significant changes in blood glucose levels in non-
diabetic mice (Maeda et al, 2014). The findings in the
present study give further evidence on the safety of
irbesartan in non-diabetic hypertensive patients. In the
diabetic mice, the pattern of blood glucose level changes
was different from that observed in the non-diabetic
mice. The 20mg/kg and 75mg/kg irbesartan doses
decreased blood glucose significantly compared to the
control group on day 13. The changes in blood glucose
levels were consistent with findings from a study by
Henriksen et al., who observed that 25mg/kg and
50mg/kg irbesartan significantly lowers blood glucose
levels in obese Zucker rats (Henriksen et al, 2001).
Irbesartan was also shown to reduce blood glucose in
diabetic rats partly by increased insulin secretion as a
result of increased blood flow to the pancreas (Huang et
al, 2006). On day eight however, in the non-diabetic
mice, there was a slight increase in blood glucose levels
in the 20mg/kg and 75mg/kg irbesartan groups,
possibly as a result of stress related stimulation of the
sympathetic nervous system (Surwit. et al, 1992).
The effect of irbesartan on glucose tolerance in non-
diabetic mice was also evaluated in this study using the
oral glucose tolerance test. Similar to the blood glucose
level analysis on day 8 and day 13 in the non-diabetic
mice, the OGTT in all the three groups did not show any
significant differences. This is suggestive of irbesartan
not having any significant effects on blood glucose
levels, glucose tolerance and insulin sensitivity in non-
diabetic animals. In diabetic mice, both doses of
irbesartan in diabetic mice did not significantly improve
the glucose tolerance compared to the control group.
Although there was no statistical difference between
the two doses of irbesartan, there was generally an
improvement in glucose tolerance compared to the
control group. The findings of the present study were
not consistent with the findings by Henriksen et al.
(2001) who reported that the 50mg/kg irbesartan
administered for 21 days to diabetic obese Zucker rats
improves glucose tolerance as evidenced by
significantly lower AUCs compared to control obese
diabetic Zucker rats (Henriksen et al, 2001).The lack of
significant improvement in glucose tolerance in the
current study might be explained by a shorter
irbesartan treatment period.
From the findings in this study the use of irbesartan in
co-morbid diabetes and hypertension should be
encouraged because of its potential positive effects on
glycaemic control. However, blood glucose levels should
be measured regularly for those diabetic patients using
antidiabetic agents and irbesartan since irbesartan
theoretically would augment their hypoglycaemic
effects. The present study forms a basis for further
research on animals to confirm the mechanism by
which irbesartan reduces blood glucose levels
significantly in diabetic mice and not in non-diabetic
mice. The study also forms the basis for further
research into the pharmacodynamic interactions of
irbesartan and commonly prescribed antidiabetic
agents first in animals then in humans.
5. Conclusion
In the present study, irbesartan significantly reduced
blood glucose levels in diabetic mice and not in non-
diabetic mice. However, a two week treatment with
irbesartan did not significantly improve glucose
tolerance in both diabetic and non-diabetic mice.
Conflict of Interest Declaration
The authors declare no conflict of interest.
References
ALLHAT Officers and Coordinators (2002). Major outcomes in
high-risk hypertensive patients randomized to angiotensin-
converting enzyme inhibitor or calcium channel blocker vs
diuretic: The Antihypertensive and Lipid-Lowering Treatment
to Prevent Heart Attack Trial (ALLHAT). JAMA, 288: 2981-97.
Andrikopoulos S., Blair AR, Deluca N, Fam BC and Proietto J
(2008). Evaluating the glucose tolerance test in mice. Am. J.
Physiol. Endocrinol. Metab. 295: E1323-32.
Aritomi S, Niinuma K, Ogawa T, Konda T and Nitta K (2012).
Additive effects of cilnidipine and angiotensin II receptor
blocker in preventing the progression of diabetic nephropathy
in diabetic spontaneously hypertensive rats. Clin. Exp. Nephrol.
17: 41-50.
Benson SC, Pershadsingh HA, Ho CI, Chittiboyina A, Desai P,
Pravenec M, Qi N, Wang J, Avery MA and Kurtz TW (2004).
Identification of telmisartan as a unique angiotensin II
receptor antagonist with selective PPAR gamma-modulating
activity. Hypertension. 43: 993-1002.
Bramlage P, Durand-Zaleski I, Desai N, Pirk O and Hacker C
(2009). The value of irbesartan in the management of
hypertension. Expert Opin. Pharmacother. 10: 1817-31.
Derosa G, Cicero AF, D'angelo A, Ragonesi PD, Ciccarelli L,
Piccinni MN, Pricolo F, Salvadeo SA, Ferrari I, Gravina A and
Fogari R (2006). Telmisartan and irbesartan therapy in type 2
diabetic patients treated with rosiglitazone: effects on insulin-
resistance, leptin and tumor necrosis factor-alpha. Hypertens.
Res. 29: 849-56.
Hansson L, Lindholm LH, Niskanen L, Lanke J, Hedner T,
Niklason A, Luomanmaki K, Dahlof B, De Faire U, Morlin C,
Karlberg BE, Wester PO and Bjorck JE (1999). Effect of
angiotensin-converting-enzyme inhibition compared with
conventional therapy on cardiovascular morbidity and
- 6. Mangoyi et al, Afr. J. Pharmacol. Ther. 2015. 4(4): 169-174
A KeSoBAP Publication ©2015. All rights reserved. ISSN 2303-9841
174
mortality in hypertension: the Captopril Prevention Project
(CAPPP) randomised trial. Lancet. 353: 611-6.
Henriksen EJ, Jacob S, Kinnick TR, Teachey MK and Krekler M
(2001). Selective angiotensin II receptor antagonism reduces
insulin resistance in obese Zucker rats. Hypertension. 38: 884-
90.
Huang Z, Jansson L and Sjoholm A (2006). Pancreatic islet
blood flow is selectively enhanced by captopril, irbesartan and
pravastatin, and suppressed by palmitate. Biochem. Biophys.
Res. Commun. 346: 26-32.
Maeda A, Tamura K, Wakui H, Ohsawa M, Azushima K, Uneda
K, Kobayashi R, Tsurumi-Ikeya Y, Kanaoka T, Dejima T, Ohki K,
Haku S, Yamashita A and Umemura S (2014). Effects of Ang II
receptor blocker irbesartan on adipose tissue function in mice
with metabolic disorders. Int. J. Med. Sci. 11: 646-51.
Mishra A, Kumari R, Murthy PN and Dash PP (2010). Influence
of Atorvastatin on the pharmacodynamics of Glipizide in
normal and diabetic rats. Der Pharma Chemica. 2: 101-104.
Munoz MC, Giani JF, Dominici FP, Turyn D and Toblli JE
(2009). Long-term treatment with an angiotensin II receptor
blocker decreases adipocyte size and improves insulin
signaling in obese Zucker rats. J. Hypertens. 27: 2409-20.
Negro R, Formoso G and Hassan H (2006). The effects of
irbesartan and telmisartan on metabolic parameters and
blood pressure in obese, insulin resistant, hypertensive
patients. J. Endocrinol. Invest. 29: 957-61.
Onishi A, Morishita Y, Watanabe M, Numata A, Tezuka M,
Okuda K, Tsunematsu S, Sugaya Y, Hashimoto S and Kusano E
(2013). Action of irbesartan on blood pressure and
glucose/lipid metabolism, in hemodialysis patients with
hypertension. Int. J. Gen. Med. 6: 405-11.
Panchal SK and Brown L (2011). Rodent models for metabolic
syndrome research. J. Biomed. Biotechnol. Article ID 351982,
doi:10.1155/2011/351982.
Ram CV (2011). Reappraisal of role of angiotensin receptor
blockers in cardiovascular protection. Vasc. Health Risk
Manag. 7: 315-9.
Rodriguez R, Viscarra JA, Minas JN, Nakano D, Nishiyama A
and Ortiz RM (2012). Angiotensin receptor blockade increases
pancreatic insulin secretion and decreases glucose intolerance
during glucose supplementation in a model of metabolic
syndrome. Endocrinol. 153: 1684-95.
Ruilope LM. and Segura J (2003). Losartan and other
angiotensin II antagonists for nephropathy in type 2 diabetes
mellitus: a review of the clinical trial evidence. Clin. Ther. 25:
3044-64.
Sarafidis PA, Stafylas PC, Kanaki AI and Lasaridis AN (2008).
Effects of renin-angiotensin system blockers on renal
outcomes and all-cause mortality in patients with diabetic
nephropathy: an updated meta-analysis. Am. J. Hypertens. 21:
922-9.
Shankar K. and Mehendale HM (2005). Encyclopedia Of
Toxicology. In: Bruce Anderson, Ann De Peyster, Shayne Gad,
Bert Hakkinen, Michael Kamrin, Betty Locey, Harihara
Mehendale, Carey Pope & Shugart, L. (eds.) Diabetes, Effect of
toxicity. 2 ed.: Academic Press.
Shi-Tao Y, Glaxosmithkline and Collegeville PA (1991). Using
trapezoidal rule for the Area under a Curve Calculation.
[Accessed November 2015]. Available at:
http://www.lexjansen.com/nesug/nesug02/ps/ps017.pdf.
Sica DA (2002). Cardiovascular morbidity and mortality in
patients with diabetes in the Losartan Intervention For
Endpoint reduction in hypertension study (LIFE): a
randomised trial against atenolol. Curr. Hypertens. Rep. 4: 321-
3.
Strippoli GF, Bonifati C, Craig M, Navaneethan SD and Craig JC
(2006). Angiotensin converting enzyme inhibitors and
angiotensin II receptor antagonists for preventing the
progression of diabetic kidney disease. Cochrane Database
Syst. Rev. CD006257.
Strippoli GF, Craig M, Schena FP and Craig JC (2005).
Antihypertensive agents for primary prevention of diabetic
nephropathy. J. Am. Soc. Nephrol. 16: 3081-91.
Surwit R, Schneider M and Feinglos M (1992). Stress and
Diabetes Mellitus. Diabetes Care. 15: 1413-1422
Usui I, Fujisaka S, Yamazaki K, Takano A, Murakami S,
Yamazaki Y, Urakaze M, Hachiya H, Takata M, Senda S, Iwata
M, Satoh A, Sasaoka T, Ak ND, Temaru R and Kobayashi M
(2007). Telmisartan reduced blood pressure and HOMA-IR
with increasing plasma leptin level in hypertensive and type 2
diabetic patients. Diabetes Res. Clin. Pract. 77: 210-4.
WHO (2005). Definition and diagnosis of diabetes and
intermediate hyperglycemia. [Accessed June 2015]. Available:
http://www.who.int/diabetes/publications/.