Download to read offline
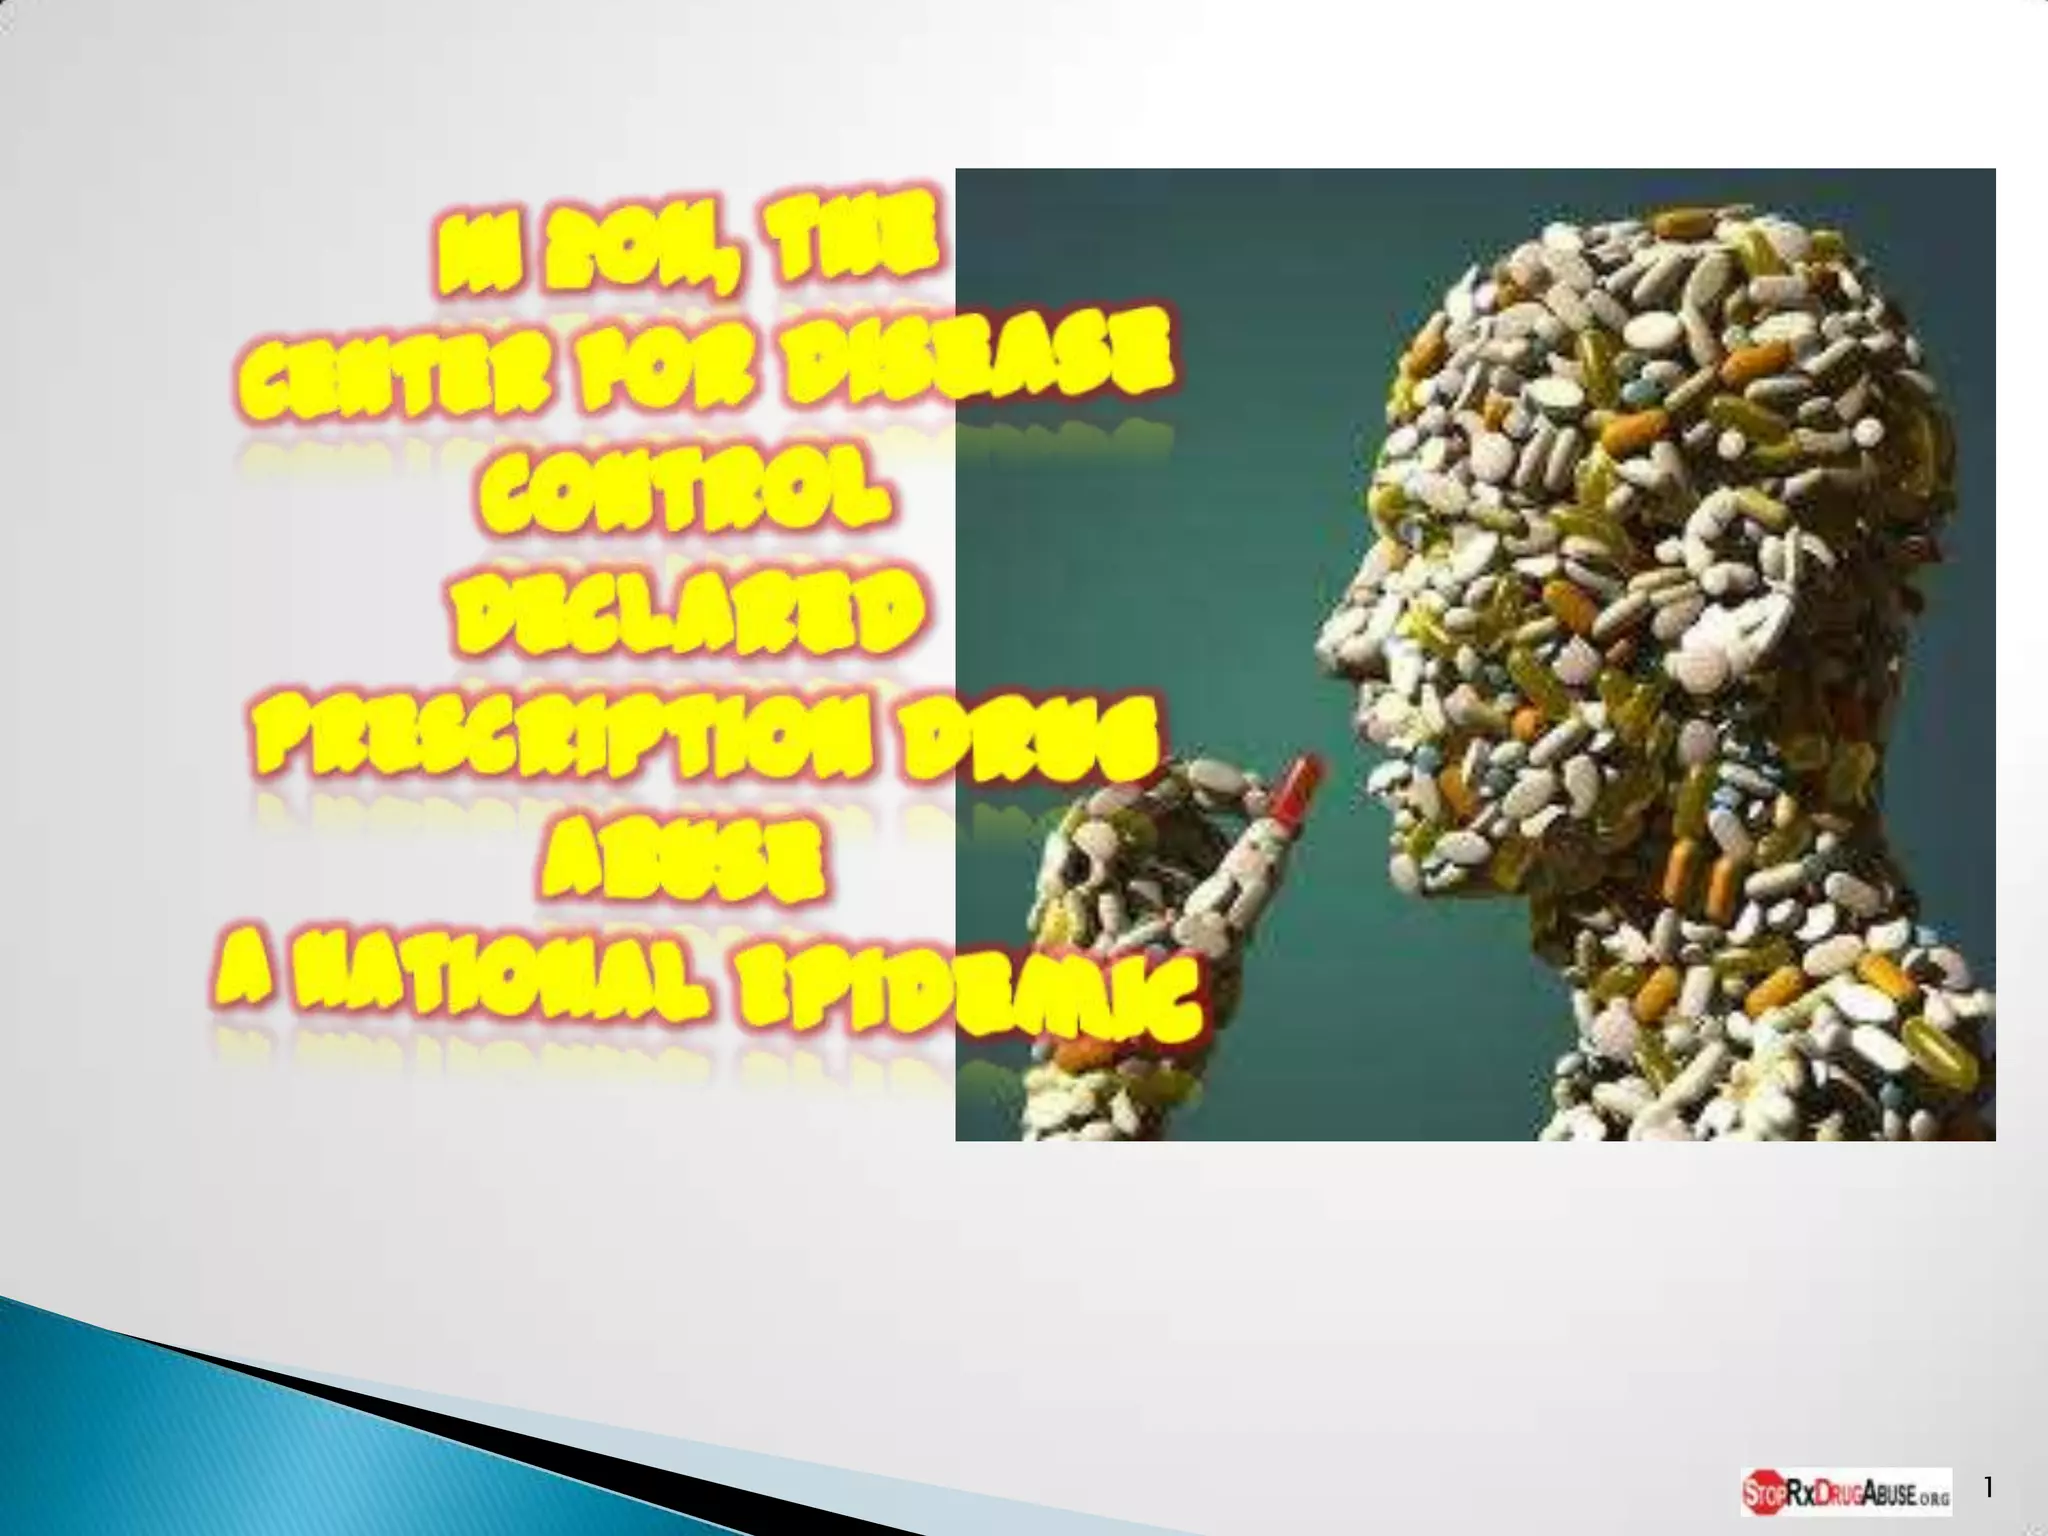
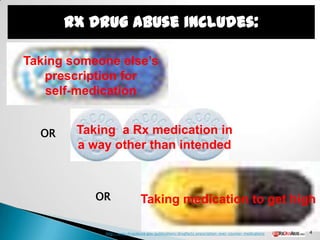
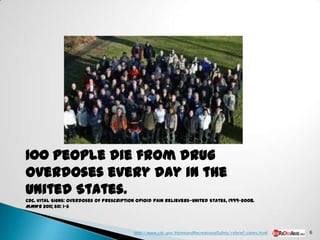
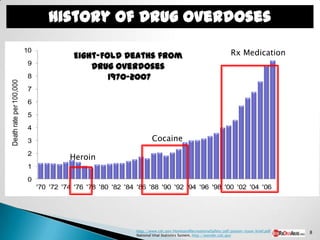
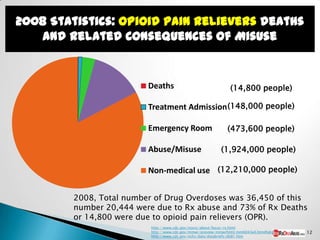
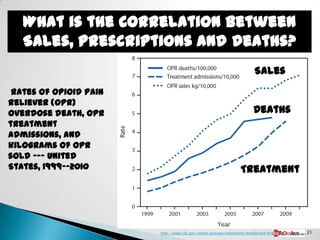

An epidemic refers to an occurrence of more cases of a disease than normal in a specific population over a given time period. Prescription drug abuse includes taking someone else's prescription medication, taking a prescription in a way other than intended, or taking medication to get high. Over 100 people die from drug overdoses every day in the United States, largely due to prescription opioid pain relievers. Nonmedical use of prescription drugs has become a major public health problem affecting people of all ages.


![PERI-PROSTHETIC FRACTURE NAIL-PLATE CONSTRUCT [NPC].pptx](https://cdn.slidesharecdn.com/ss_thumbnails/drarunkumardrmohamedashrafperiprostheticfrasturenail-plateconstructnpc-260209164459-7e9d15a1-thumbnail.jpg?width=640&height=640&fit=bounds)


![CTEV [ clubfoot] DR ARUN LAL ,DR MOHAMED ASHRAF travancore medical college k...](https://cdn.slidesharecdn.com/ss_thumbnails/ctevclubfootdrarunlaldrmohamedashraftravancoremedicalcollegekollamkeralaindia-260208063247-18fc466c-thumbnail.jpg?width=640&height=640&fit=bounds)


