Download to read offline

![Colton Joint Unified School District was selected What do the
by the College Board as an AP District of the Year data show?
last year honored for increasing access to AP
—
course work while simultaneously increasing the
percentage of students earning scores of 3 or
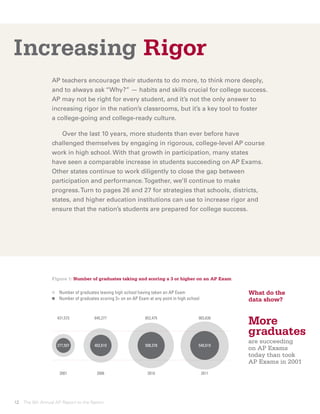
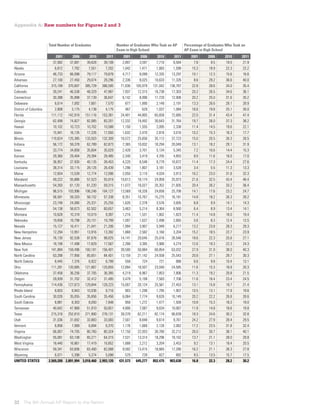
540,619
U.S. public high school
higher on AP Exams. graduates scored
a 3 or higher
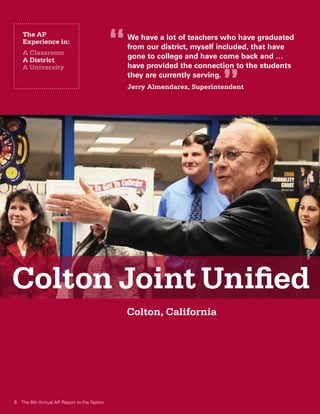
Jerry Almendarez, superintendent for Colton Joint
12,926
Unified School District, attributes Colton’s success
to its teachers, who serve as role models, offering
students real-life examples of how to prepare for U.S. public high
schools were
college, earn their degrees, and fulfill their dreams
represented by
for the future. “We have a lot of teachers who have AP Exam-takers in
graduated from our district, myself included, that the class of 2011
have gone to college and have come back and …
have provided the connection to the students they
are currently serving, said Almendarez. “There are
”
a lot of caring people here who care not only for
improving [the] students’ academic performance
but also for the human being. ”
This special connection has paid off. Ignacio
Cabrera, principal of Bloomington High School in
Colton, proudly reported that “one of the programs
that has excelled is our math program. We’ve
School District
had a three-year run of over 98 percent of our
students succeeding — and the thing that is really
unusual … is that 100 percent succeeded just
this past year.
”
To see interviews with educators from Colton and another
AP District of the Year — New Jersey’s West New York School
District — visit apreport.collegeboard.org.
The College Board apreport.collegeboard.org 7](https://image.slidesharecdn.com/ap-report-to-the-nation-120516115357-phpapp02/85/2012-AP-Report-to-the-Nation-9-320.jpg)
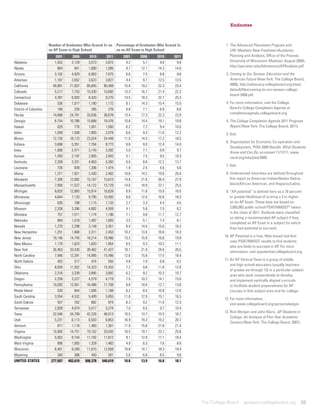
![The AP
Experience in:
A Classroom
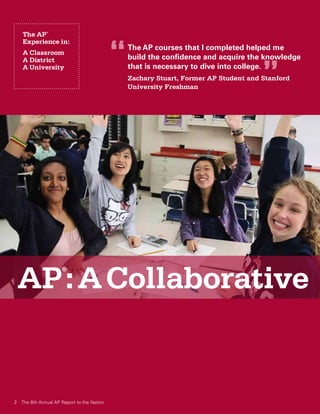
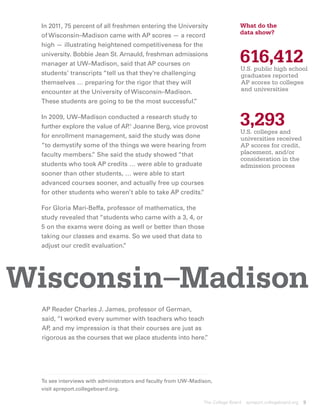
“ [AP courses on a student’s transcript] tell us
that they’re challenging themselves … preparing
for the rigor that they will encounter at the
A District
University of Wisconsin–Madison. These students
”
A University
are going to be the most successful.
Bobbie Jean St. Arnauld, Freshman Admissions Manager
University of
Madison, Wisconsin
8 The 8th Annual AP Report to the Nation](https://image.slidesharecdn.com/ap-report-to-the-nation-120516115357-phpapp02/85/2012-AP-Report-to-the-Nation-10-320.jpg)

The 8th Annual AP Report to the Nation provides data and stories about AP programs in classrooms, districts, and universities. It discusses increasing access to AP courses, promoting equity, and supporting STEM education. The report features Whitney M. Young Magnet School in Chicago, where AP Calculus teacher Matthew Moran creates a collaborative learning environment. It also profiles Colton Joint Unified School District in California, whose superintendent Jerry Almendarez notes the importance of teachers who graduated from the district returning to teach.