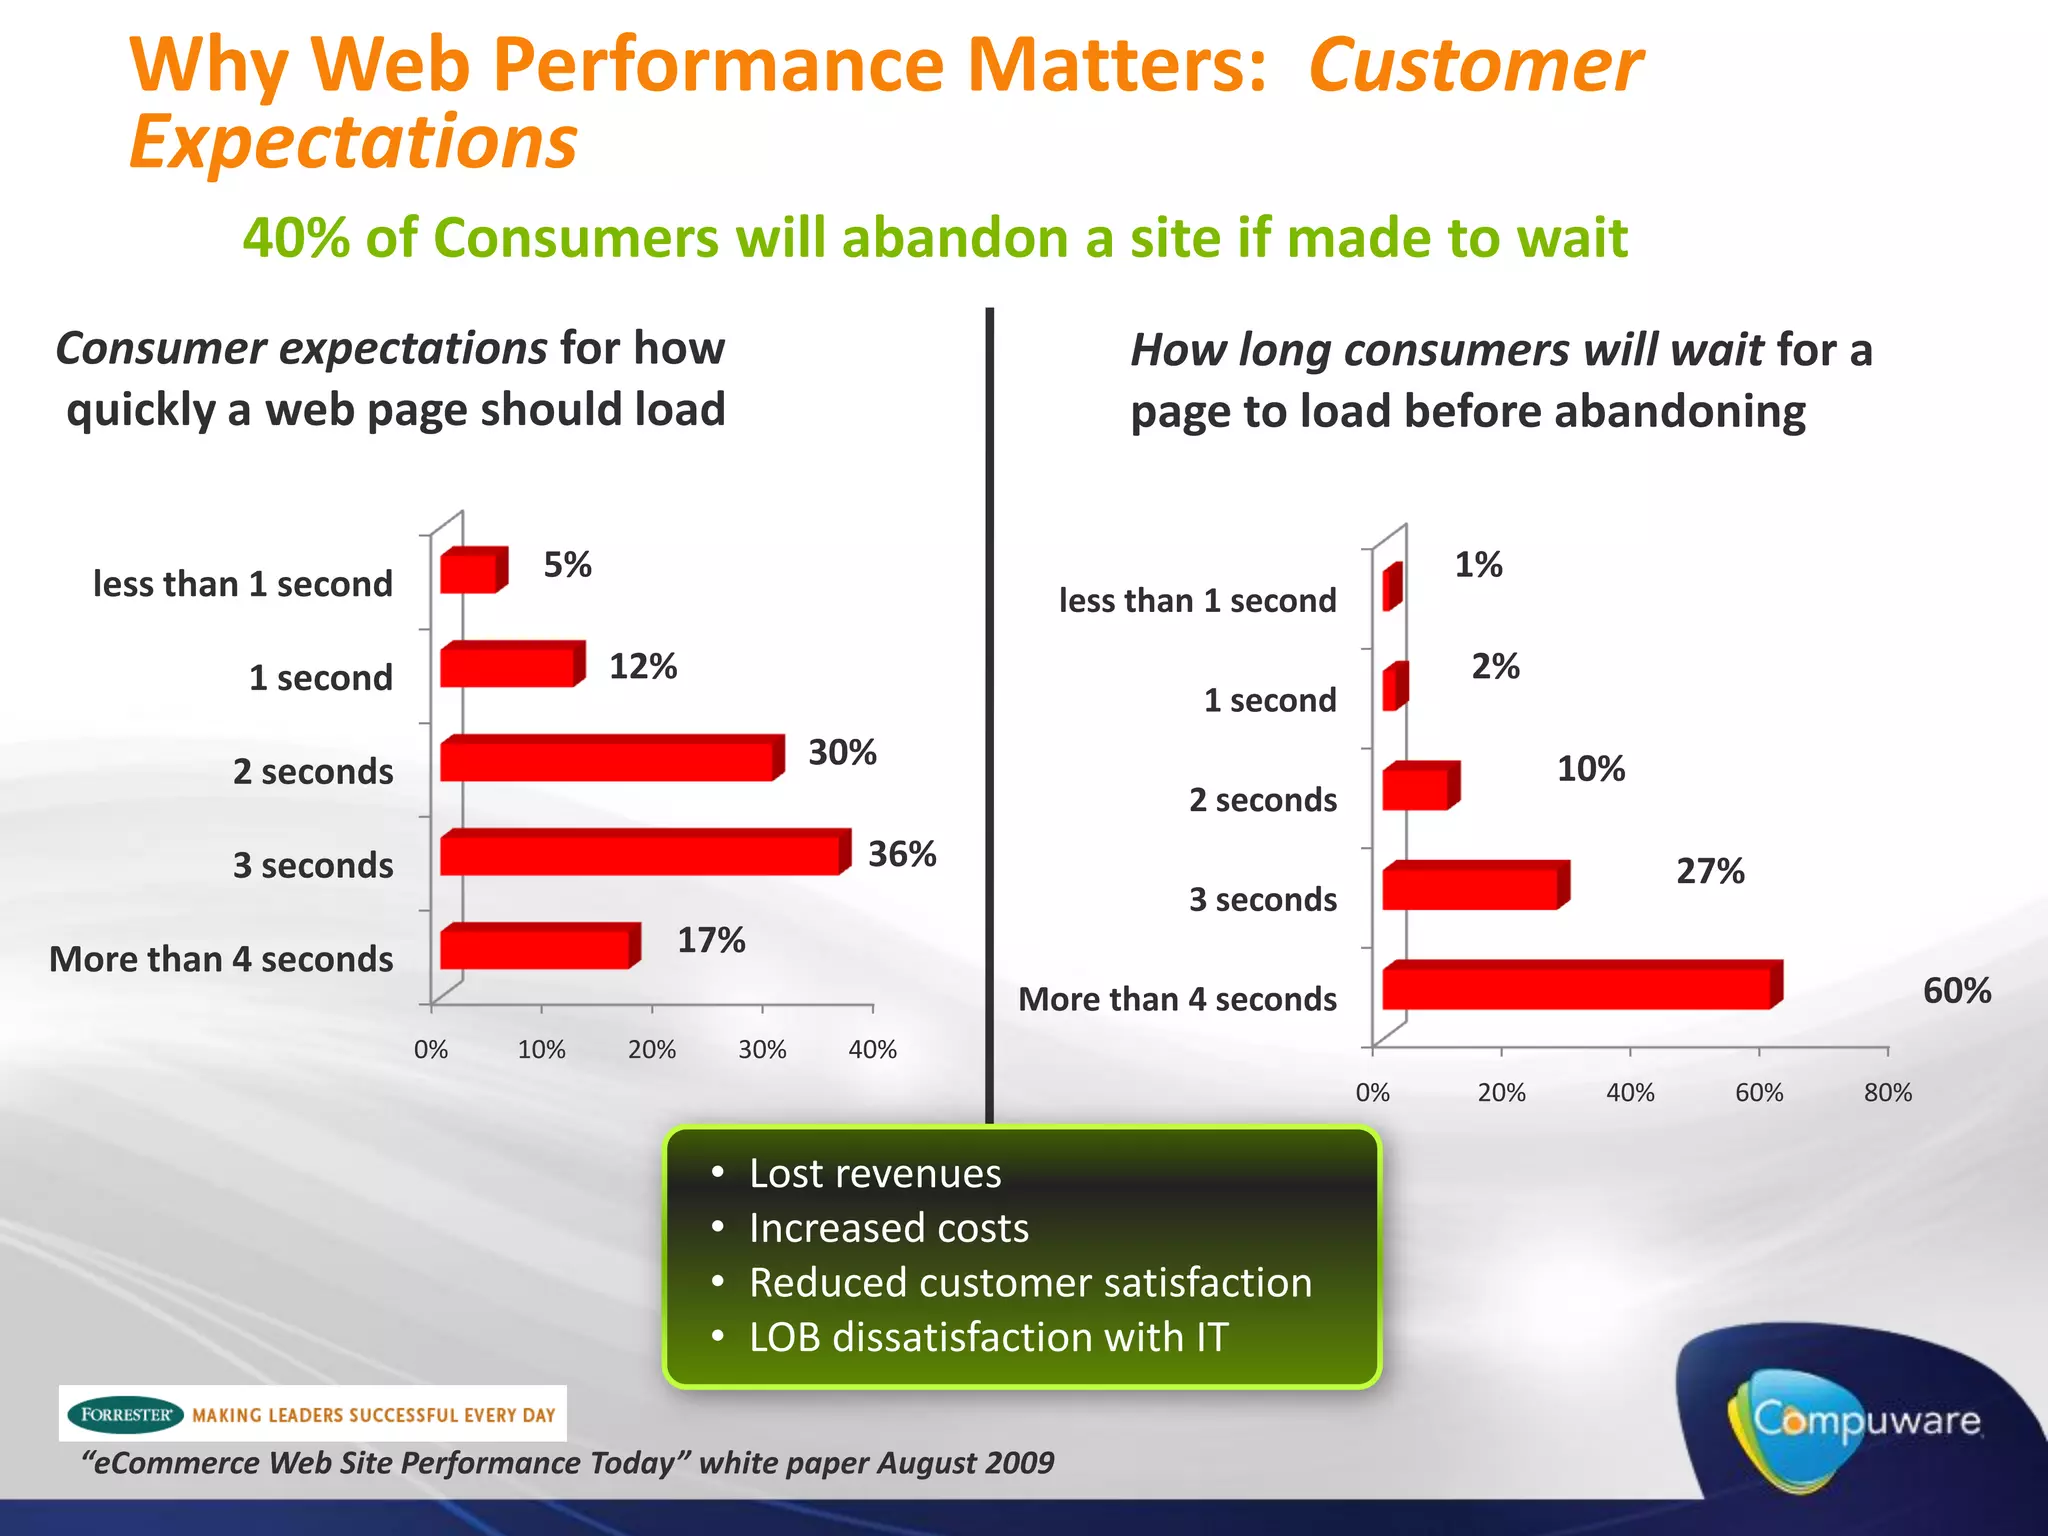
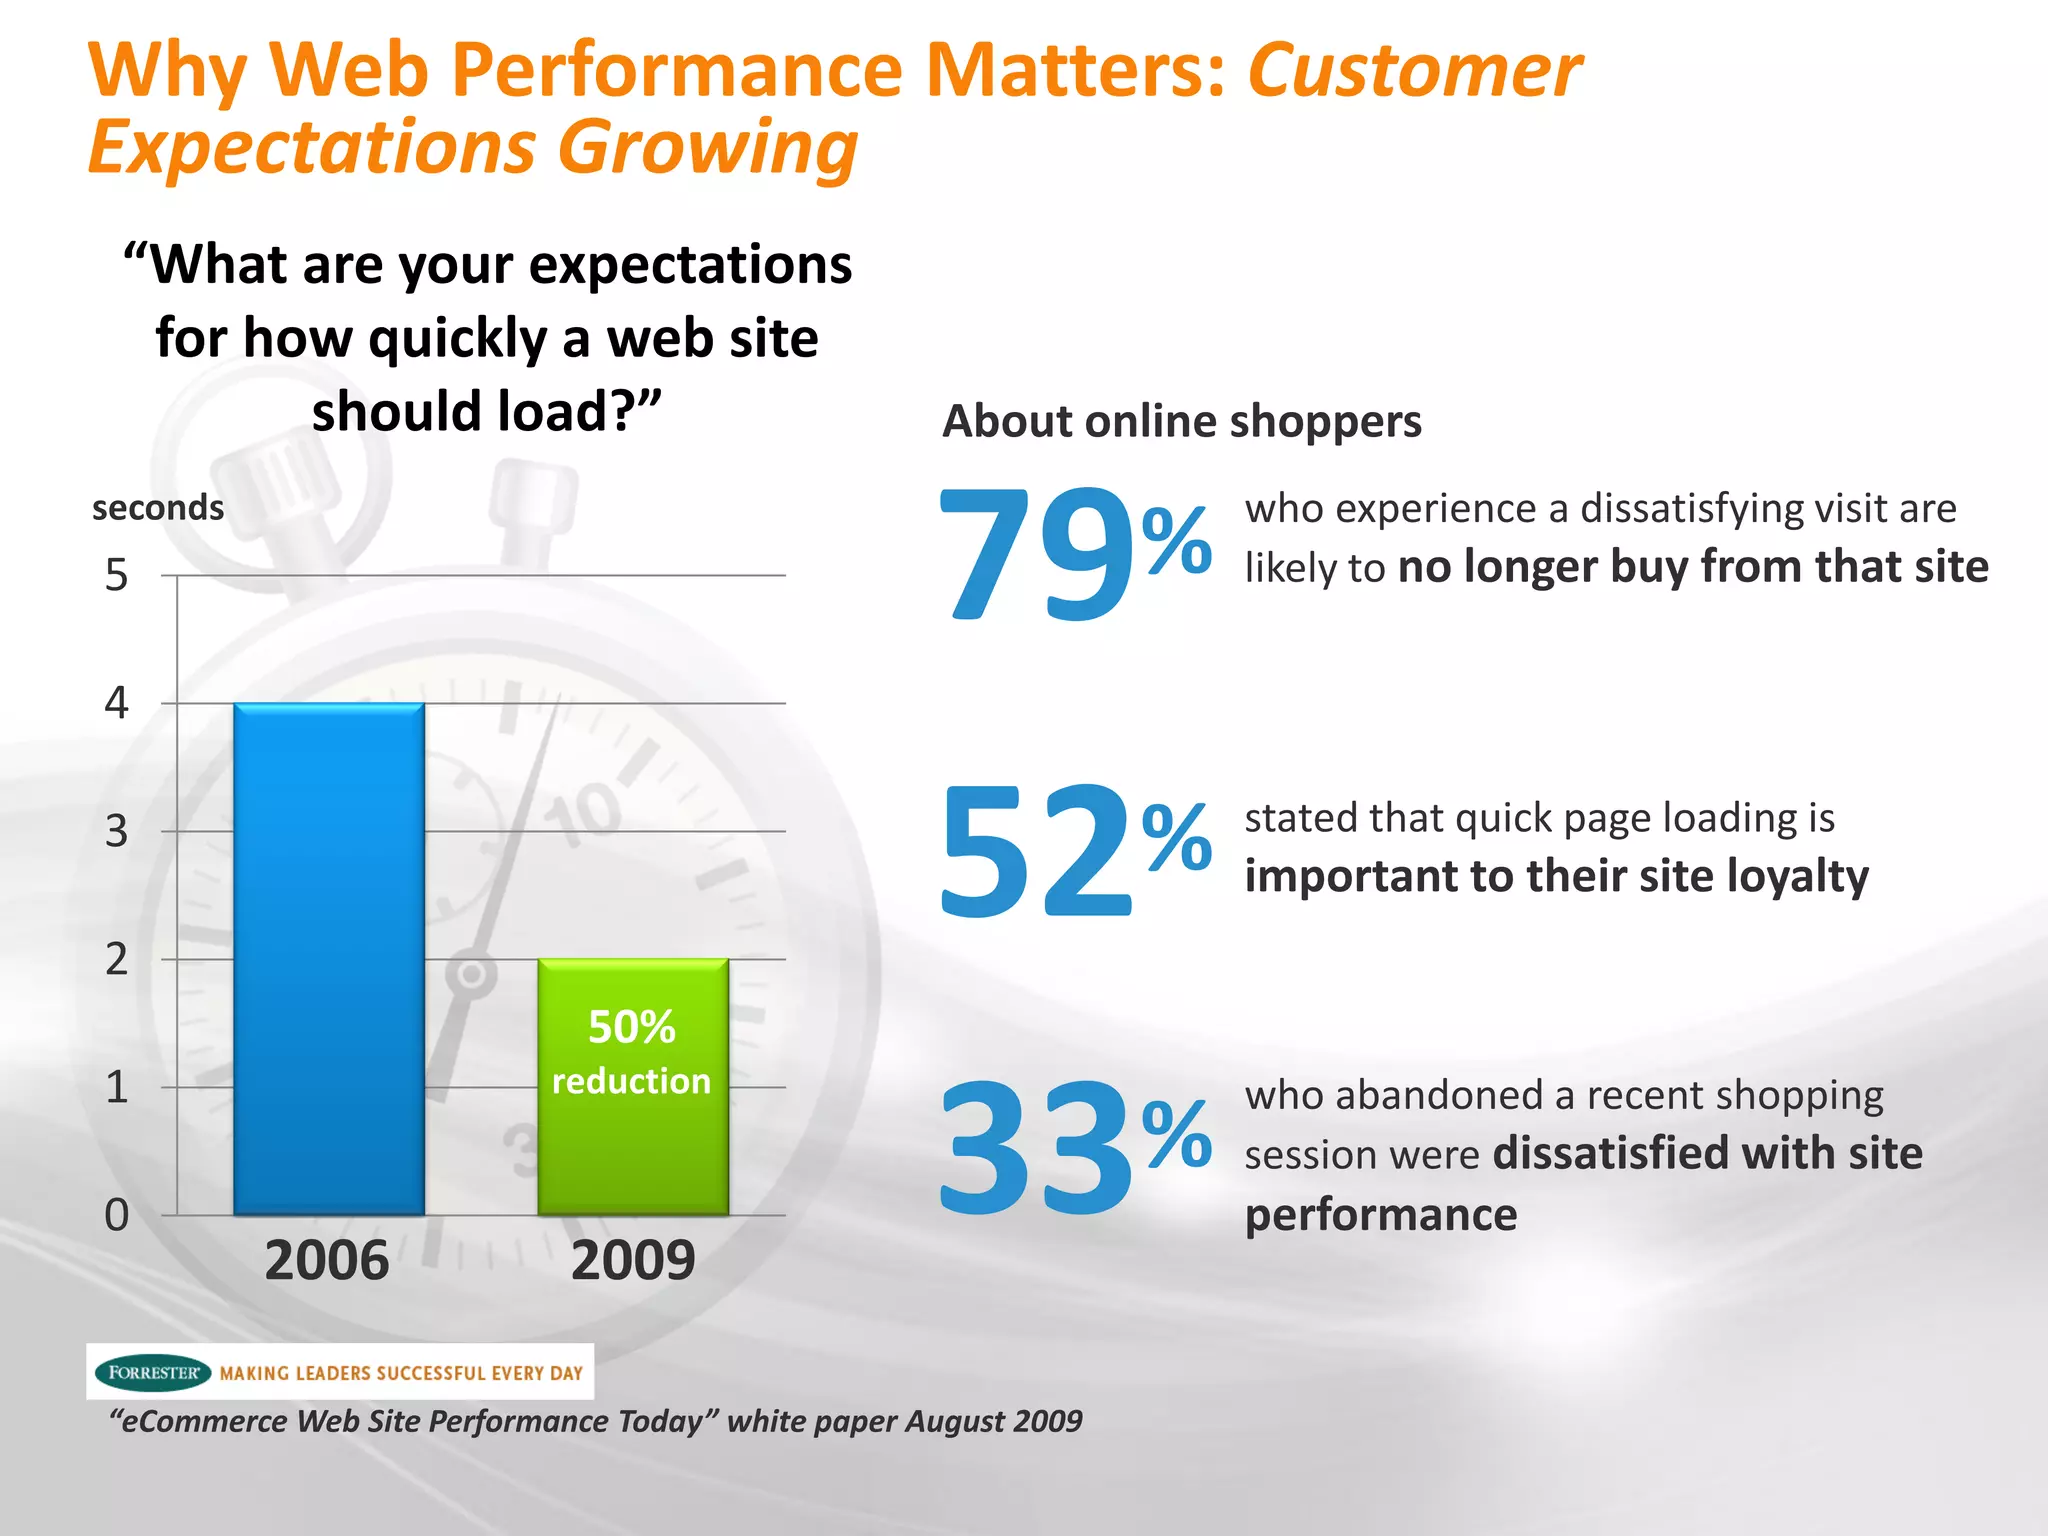
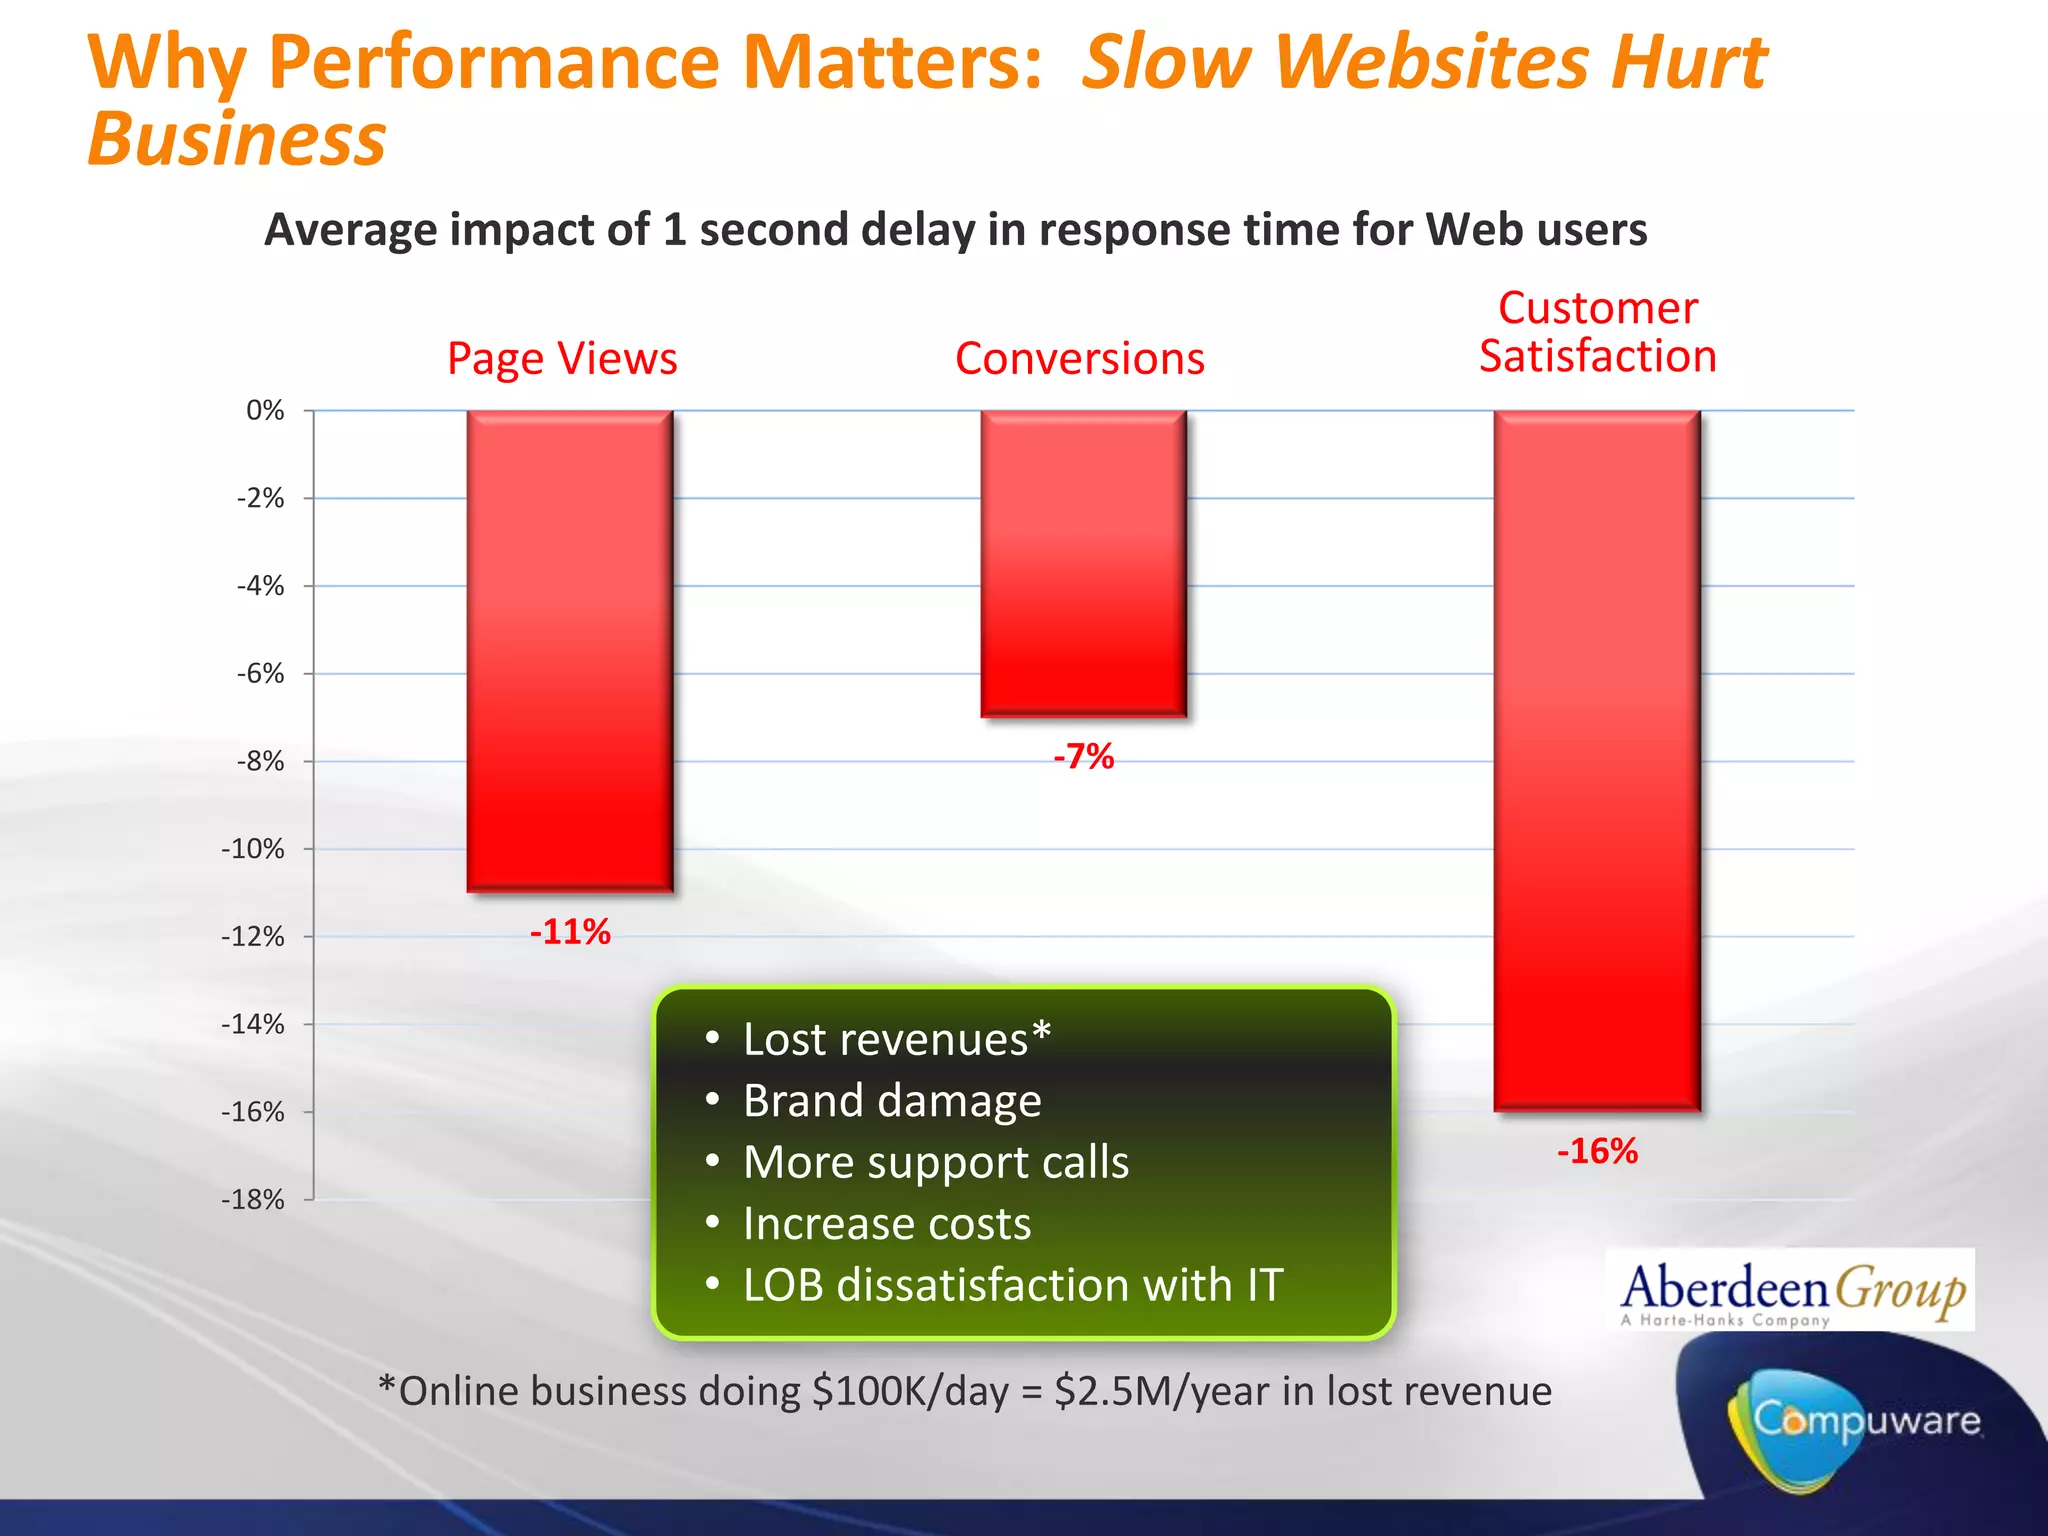
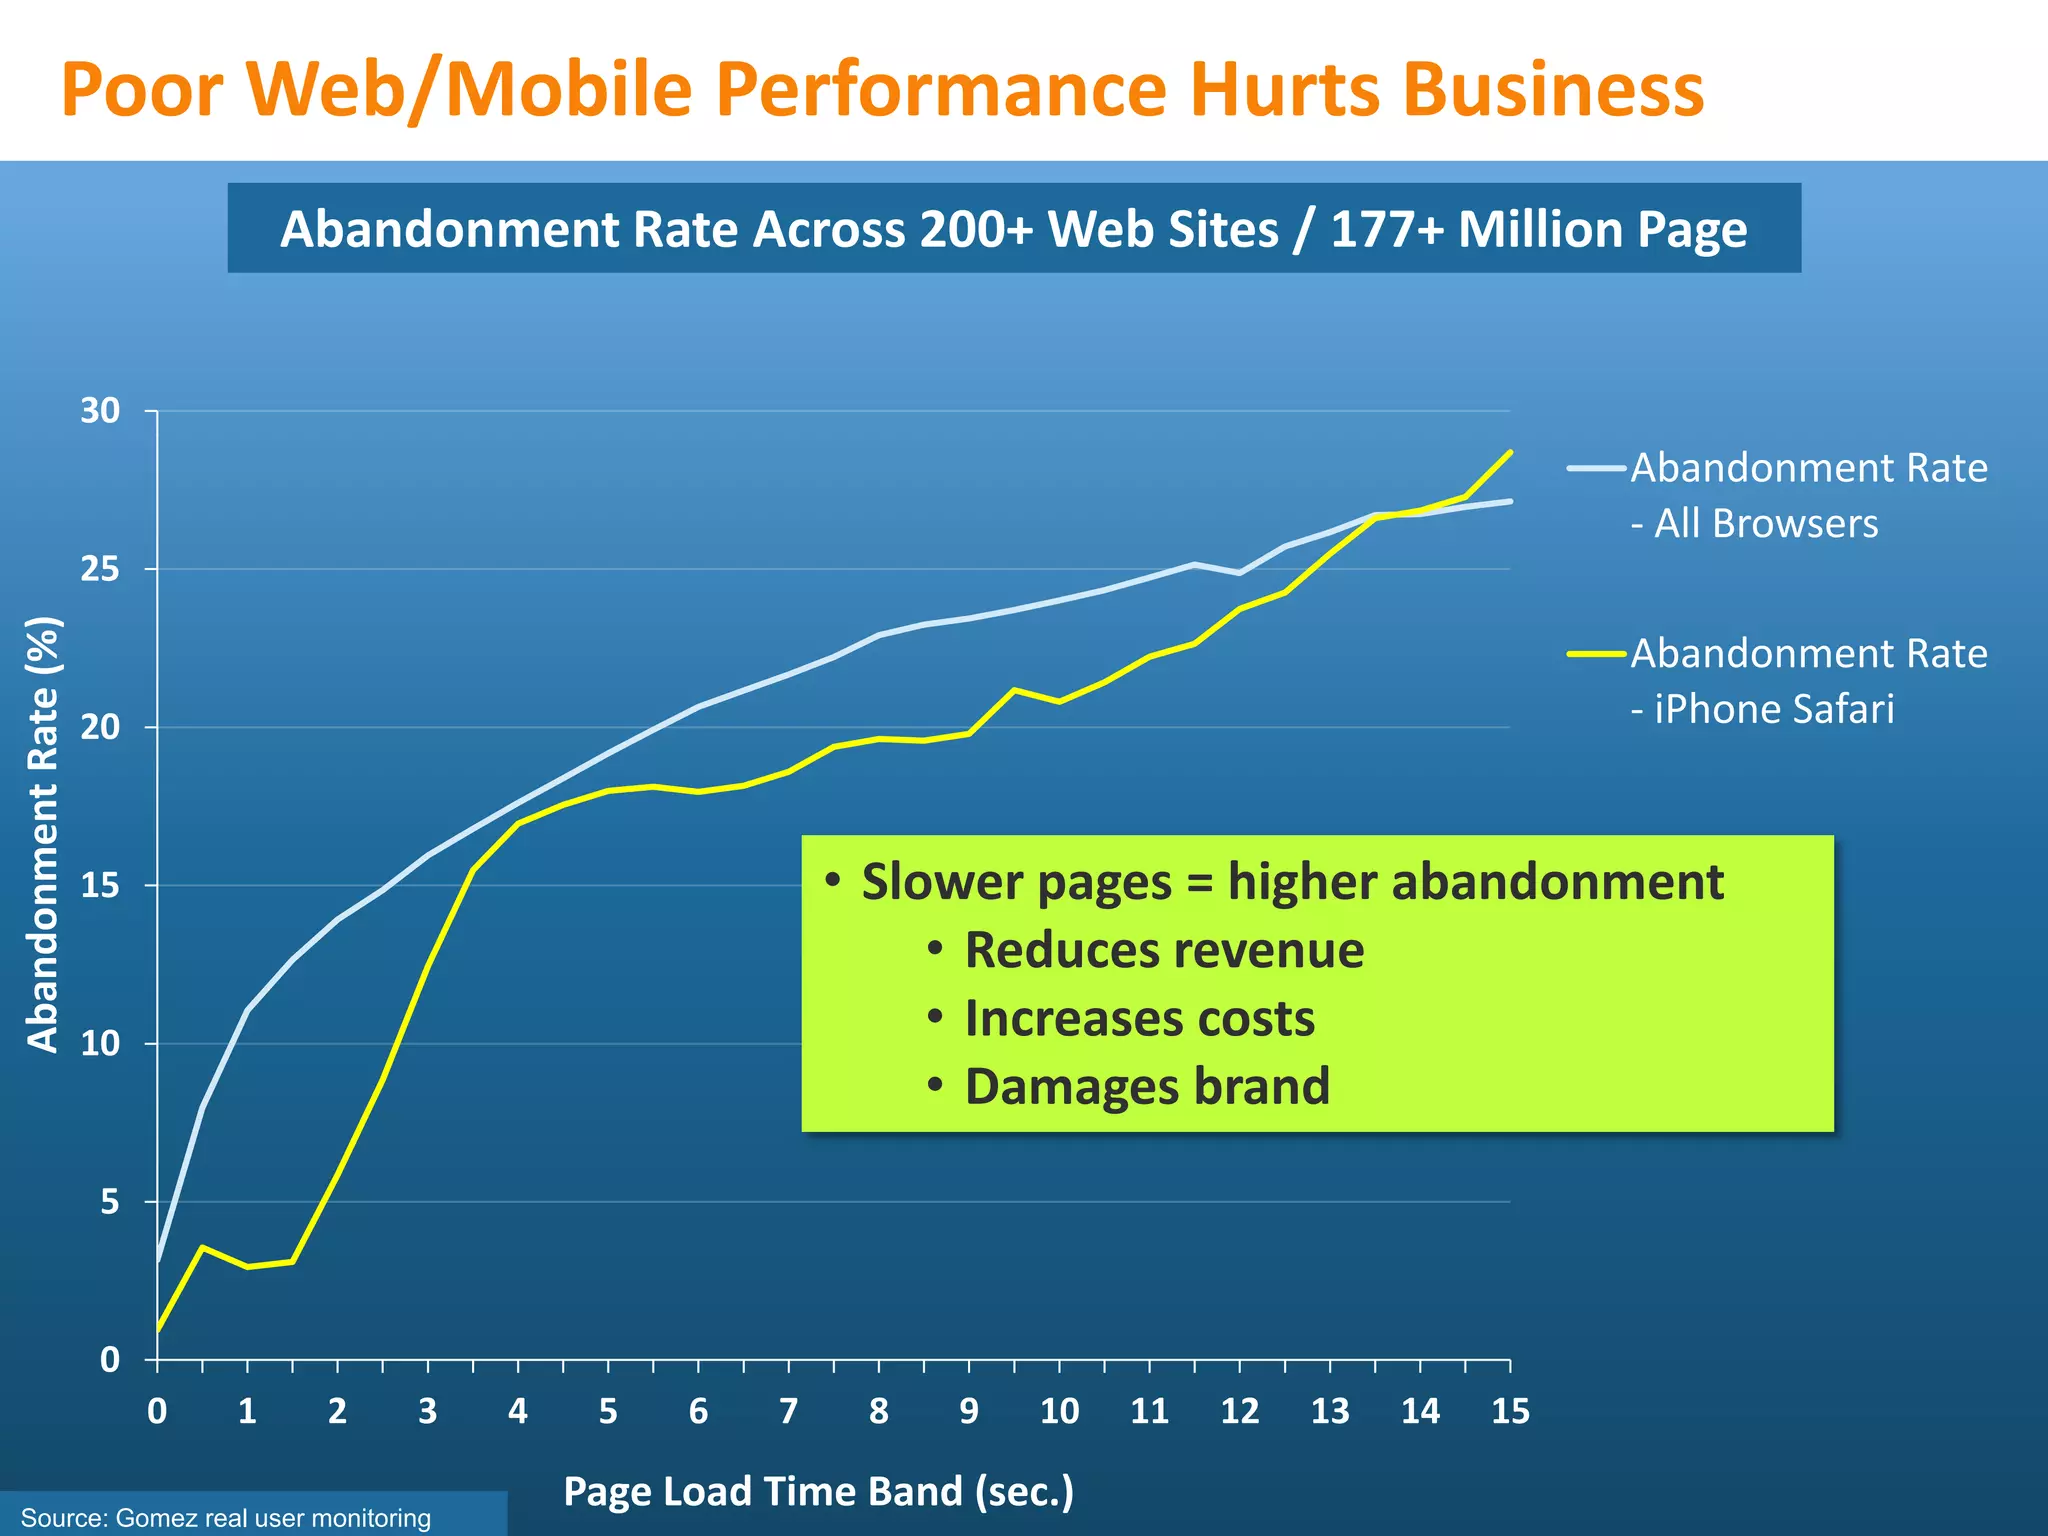
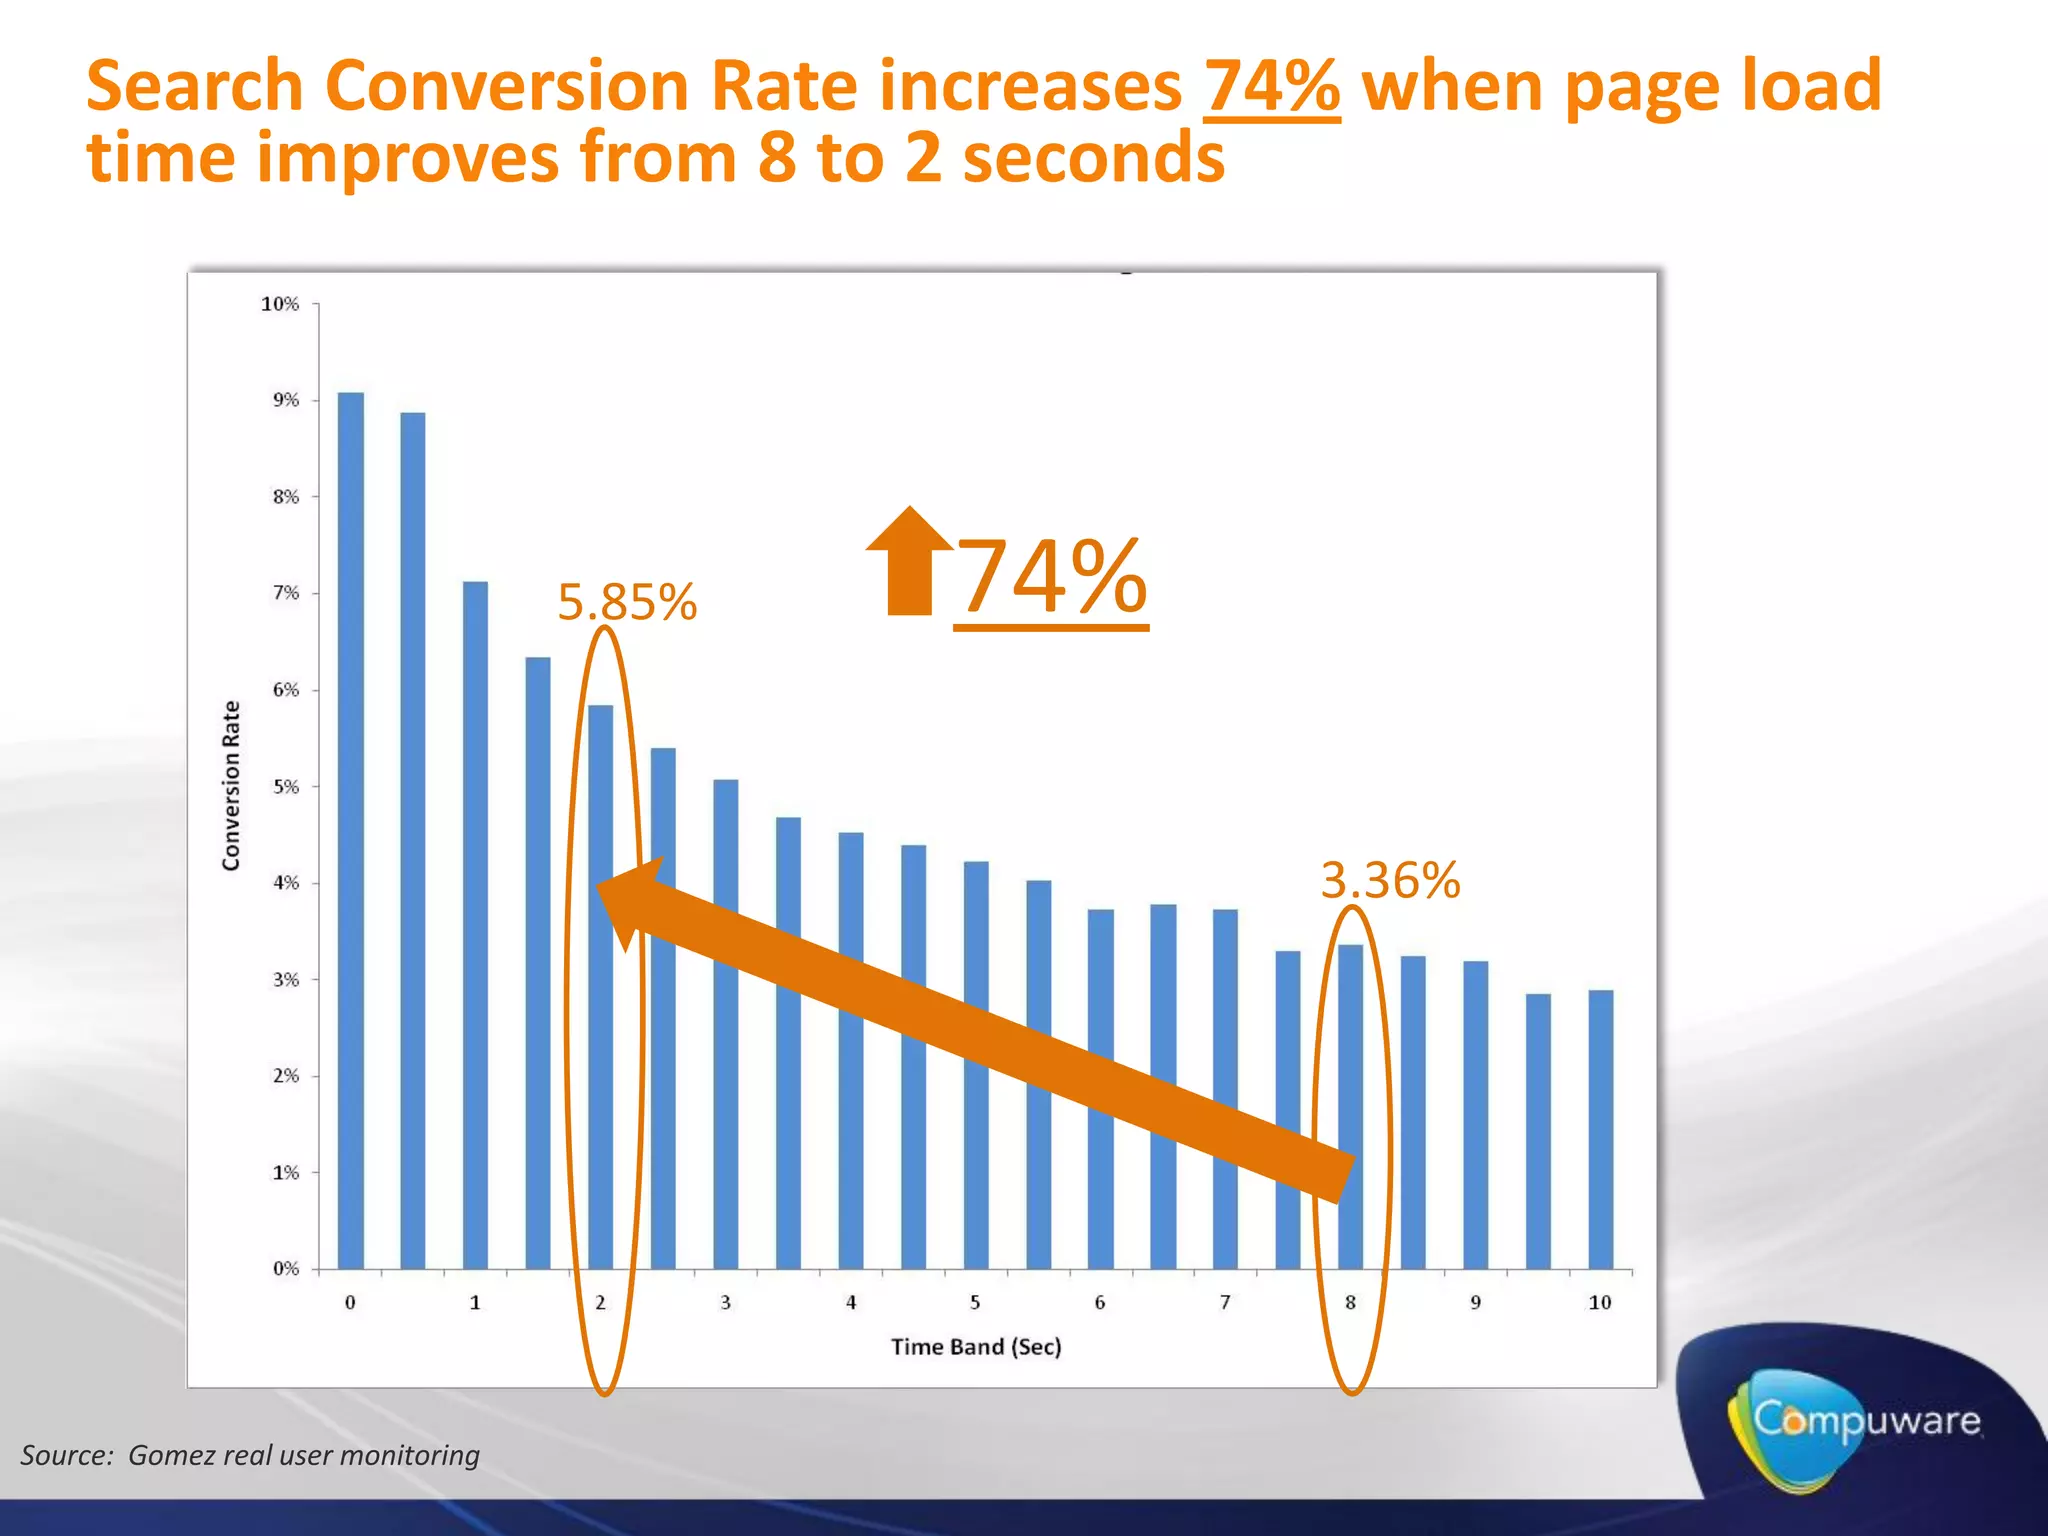
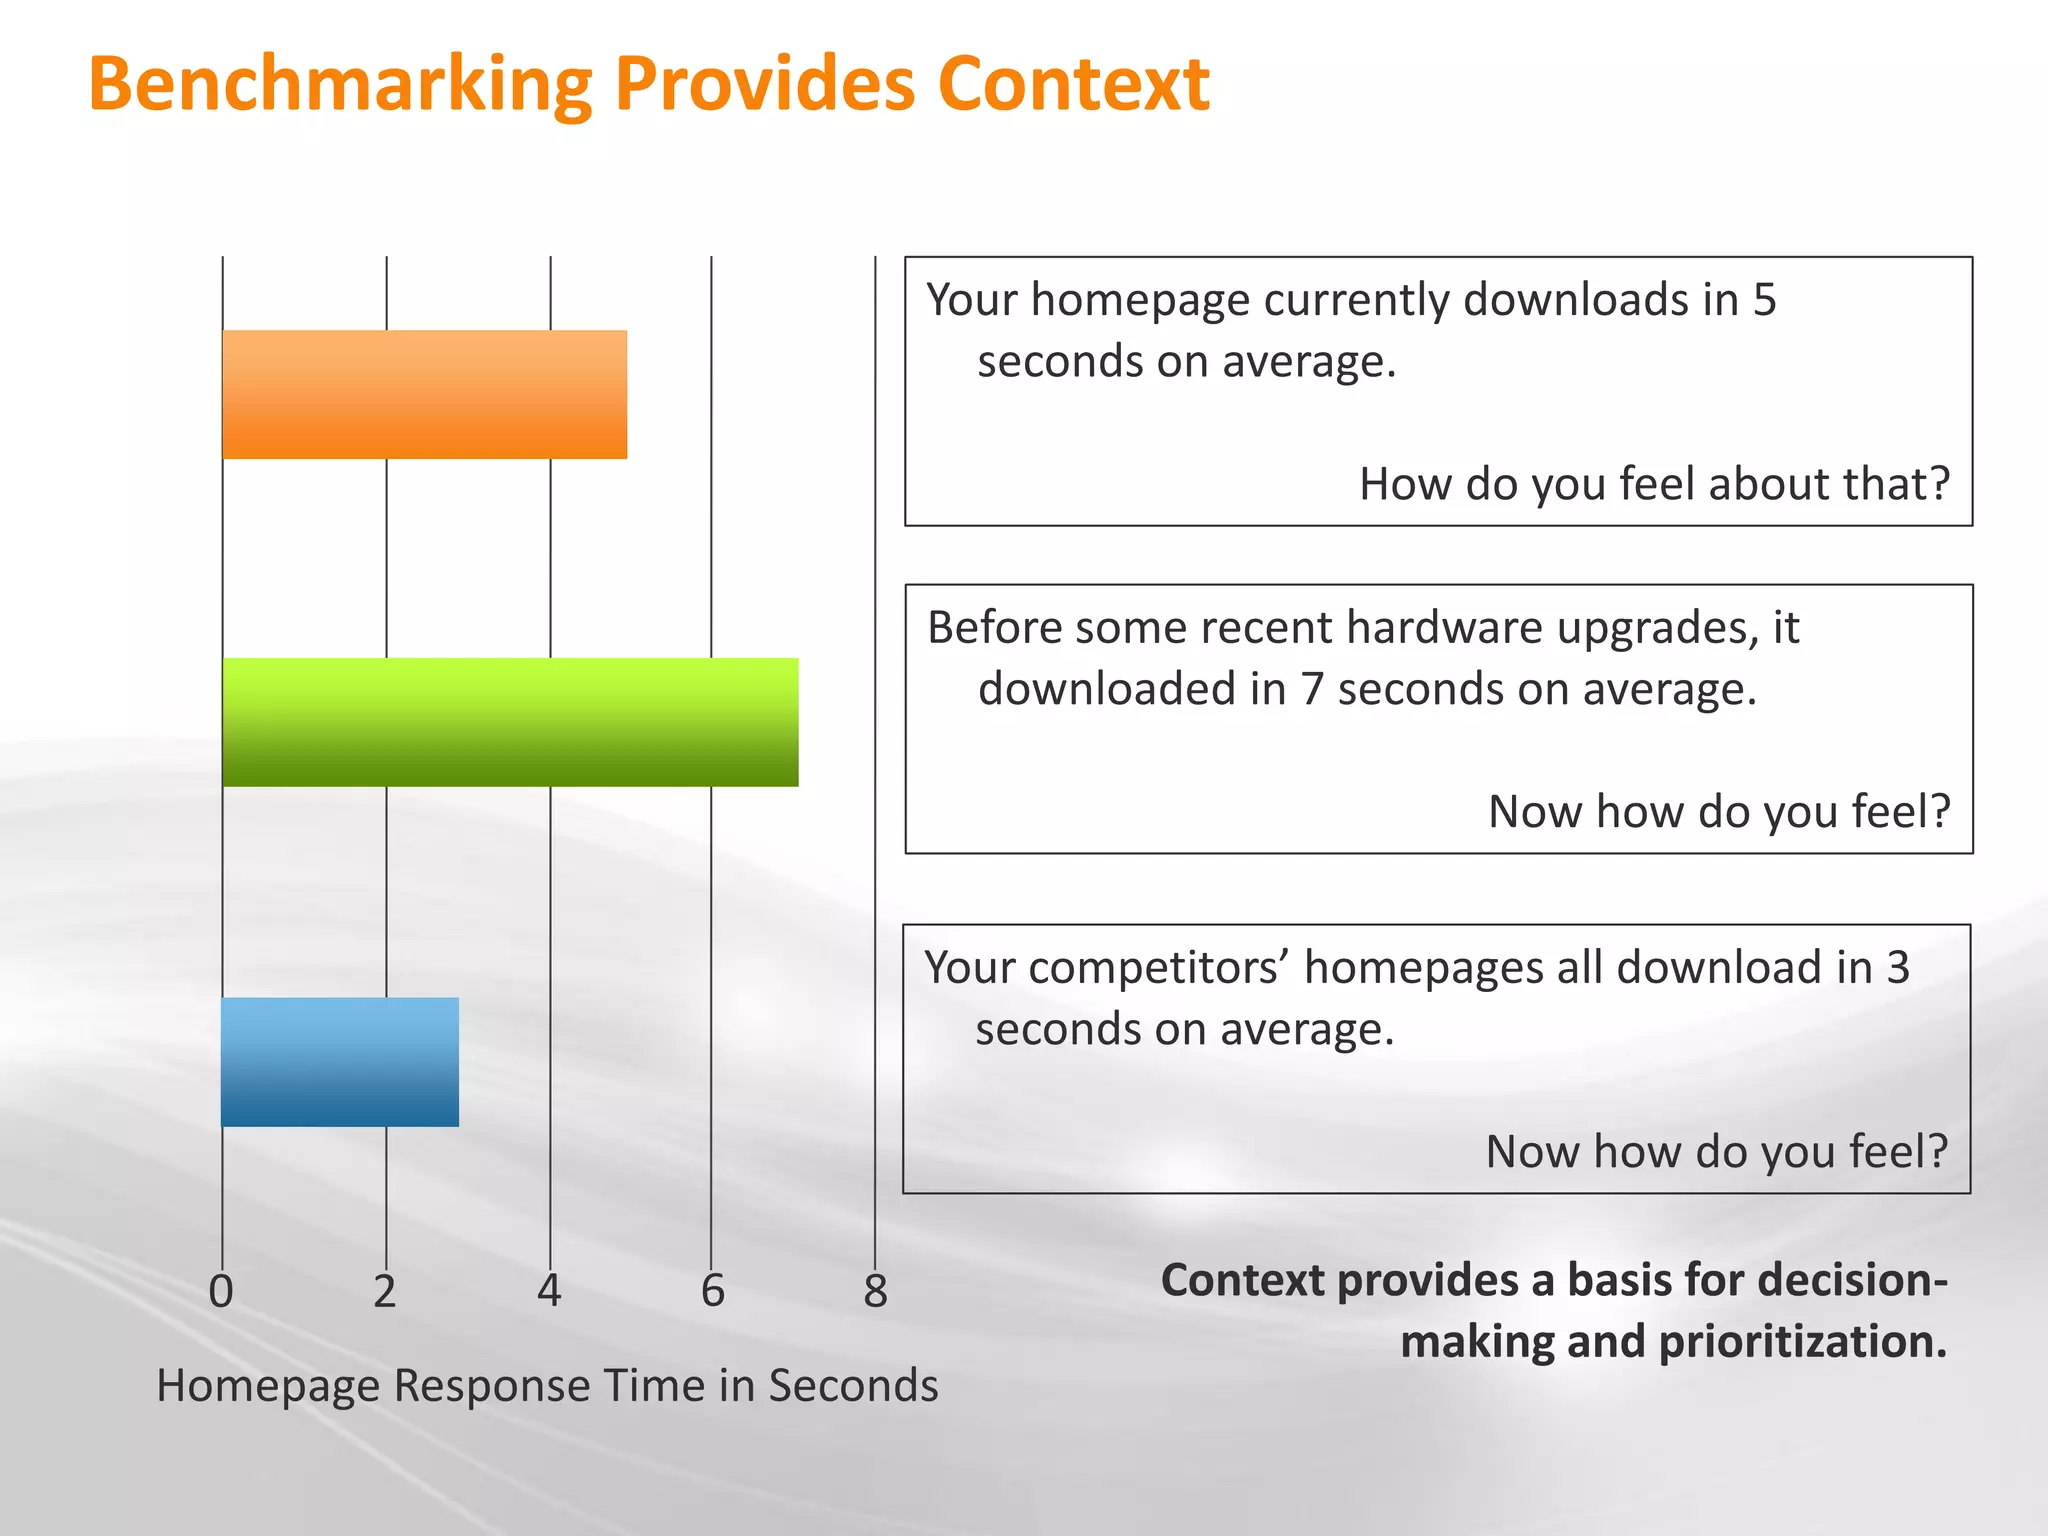
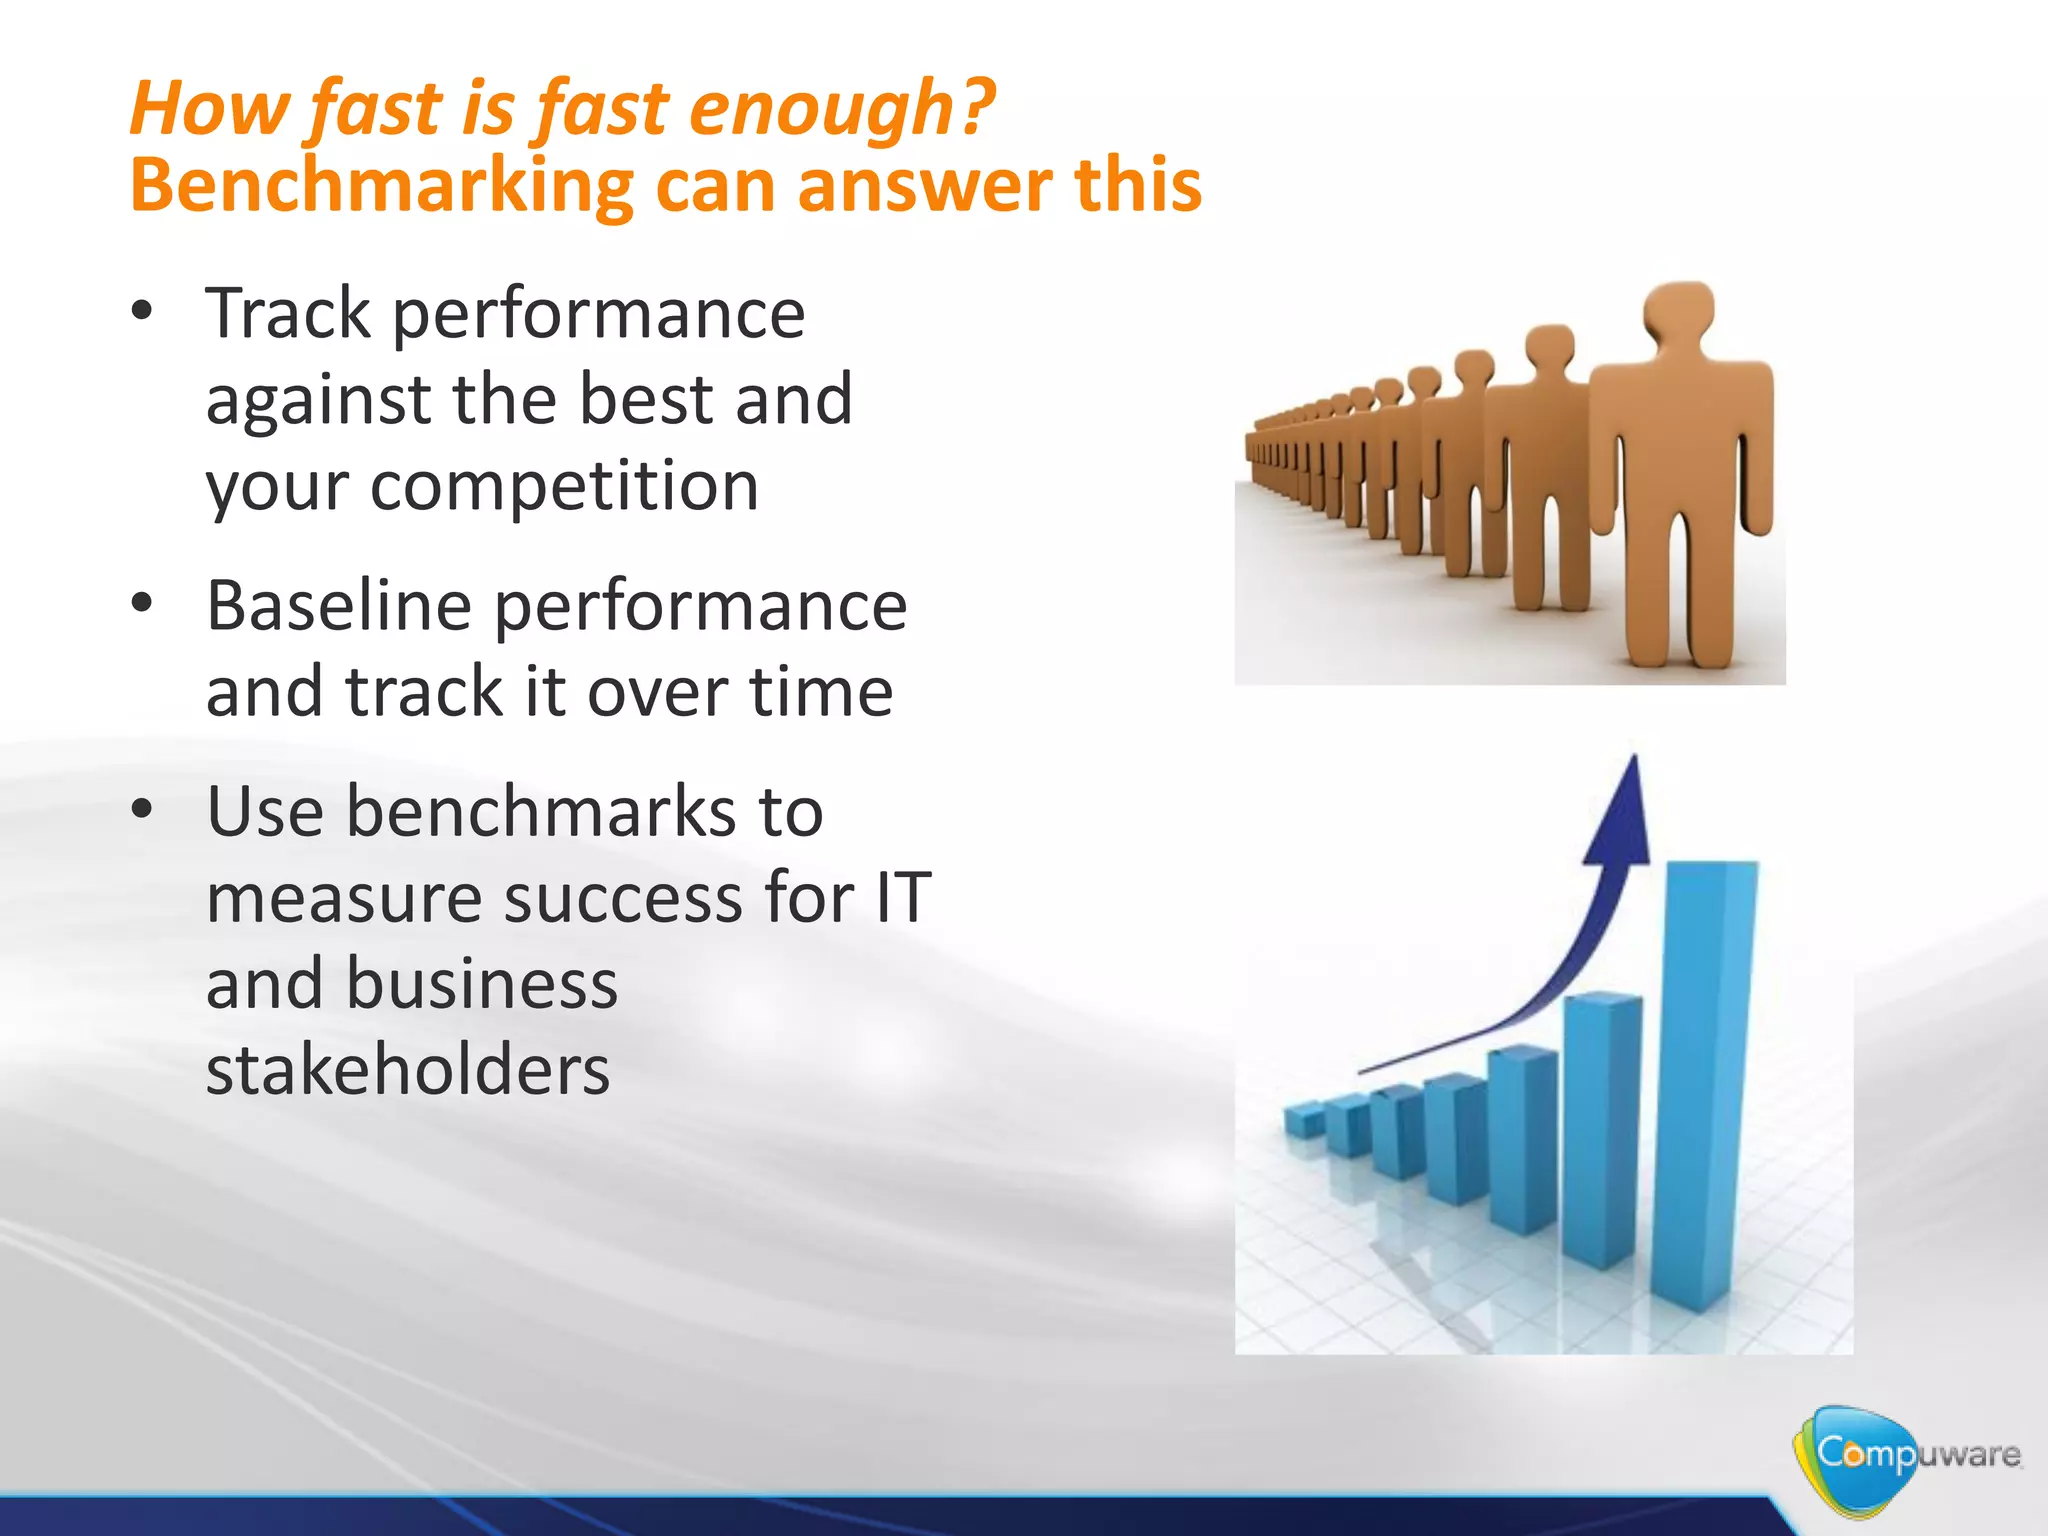
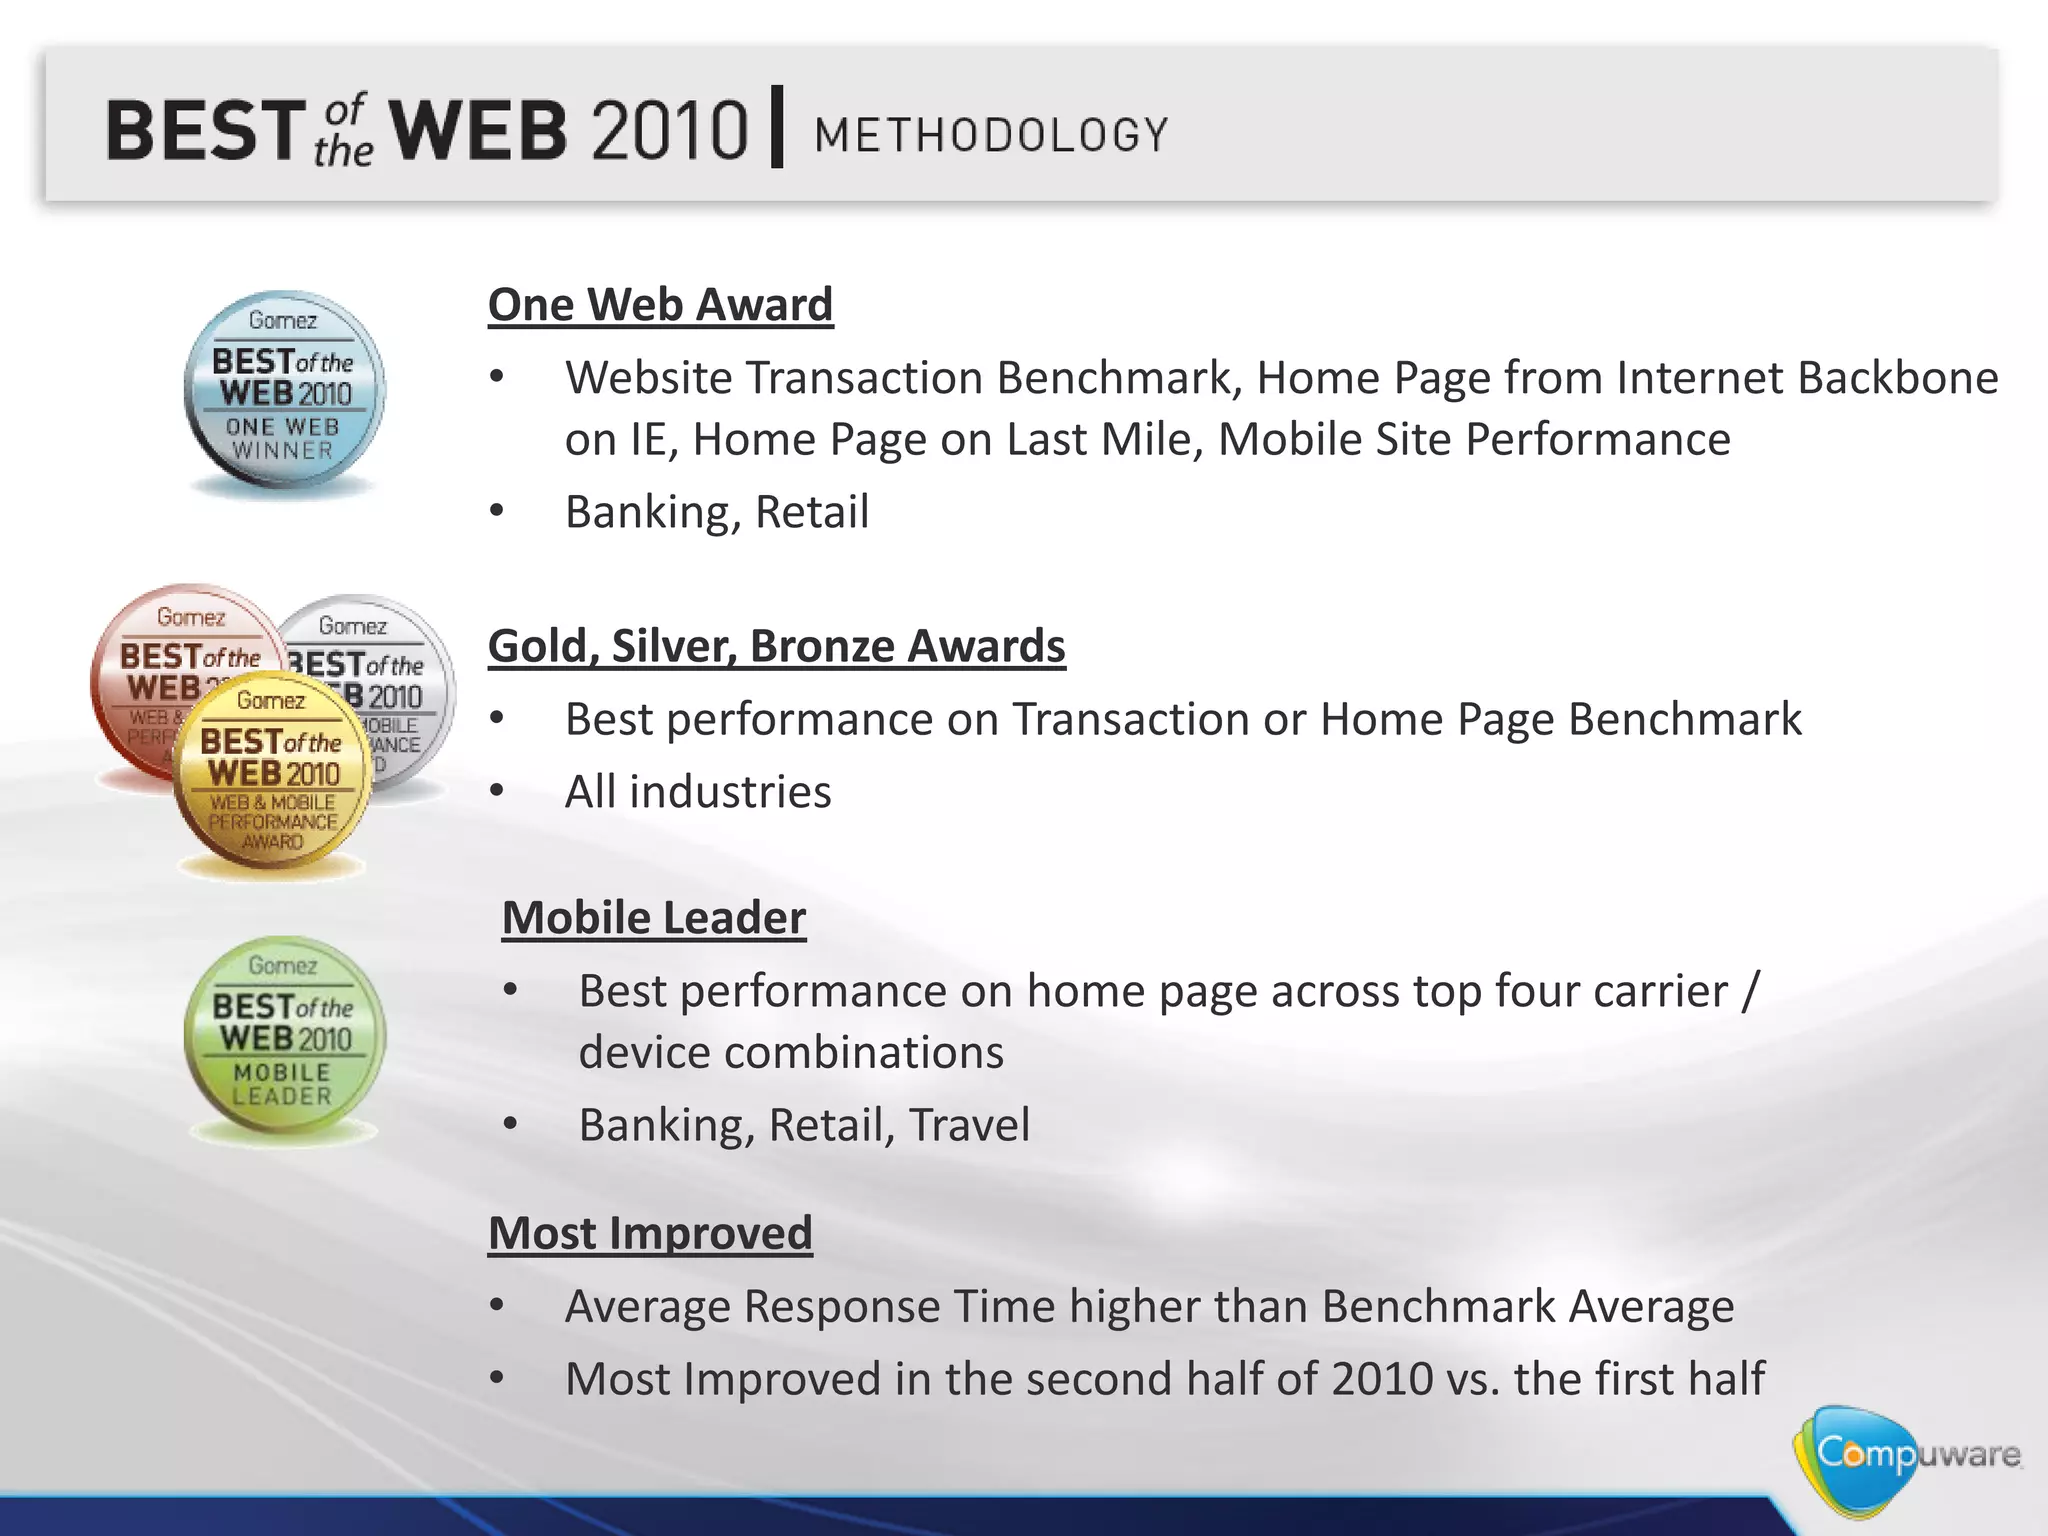
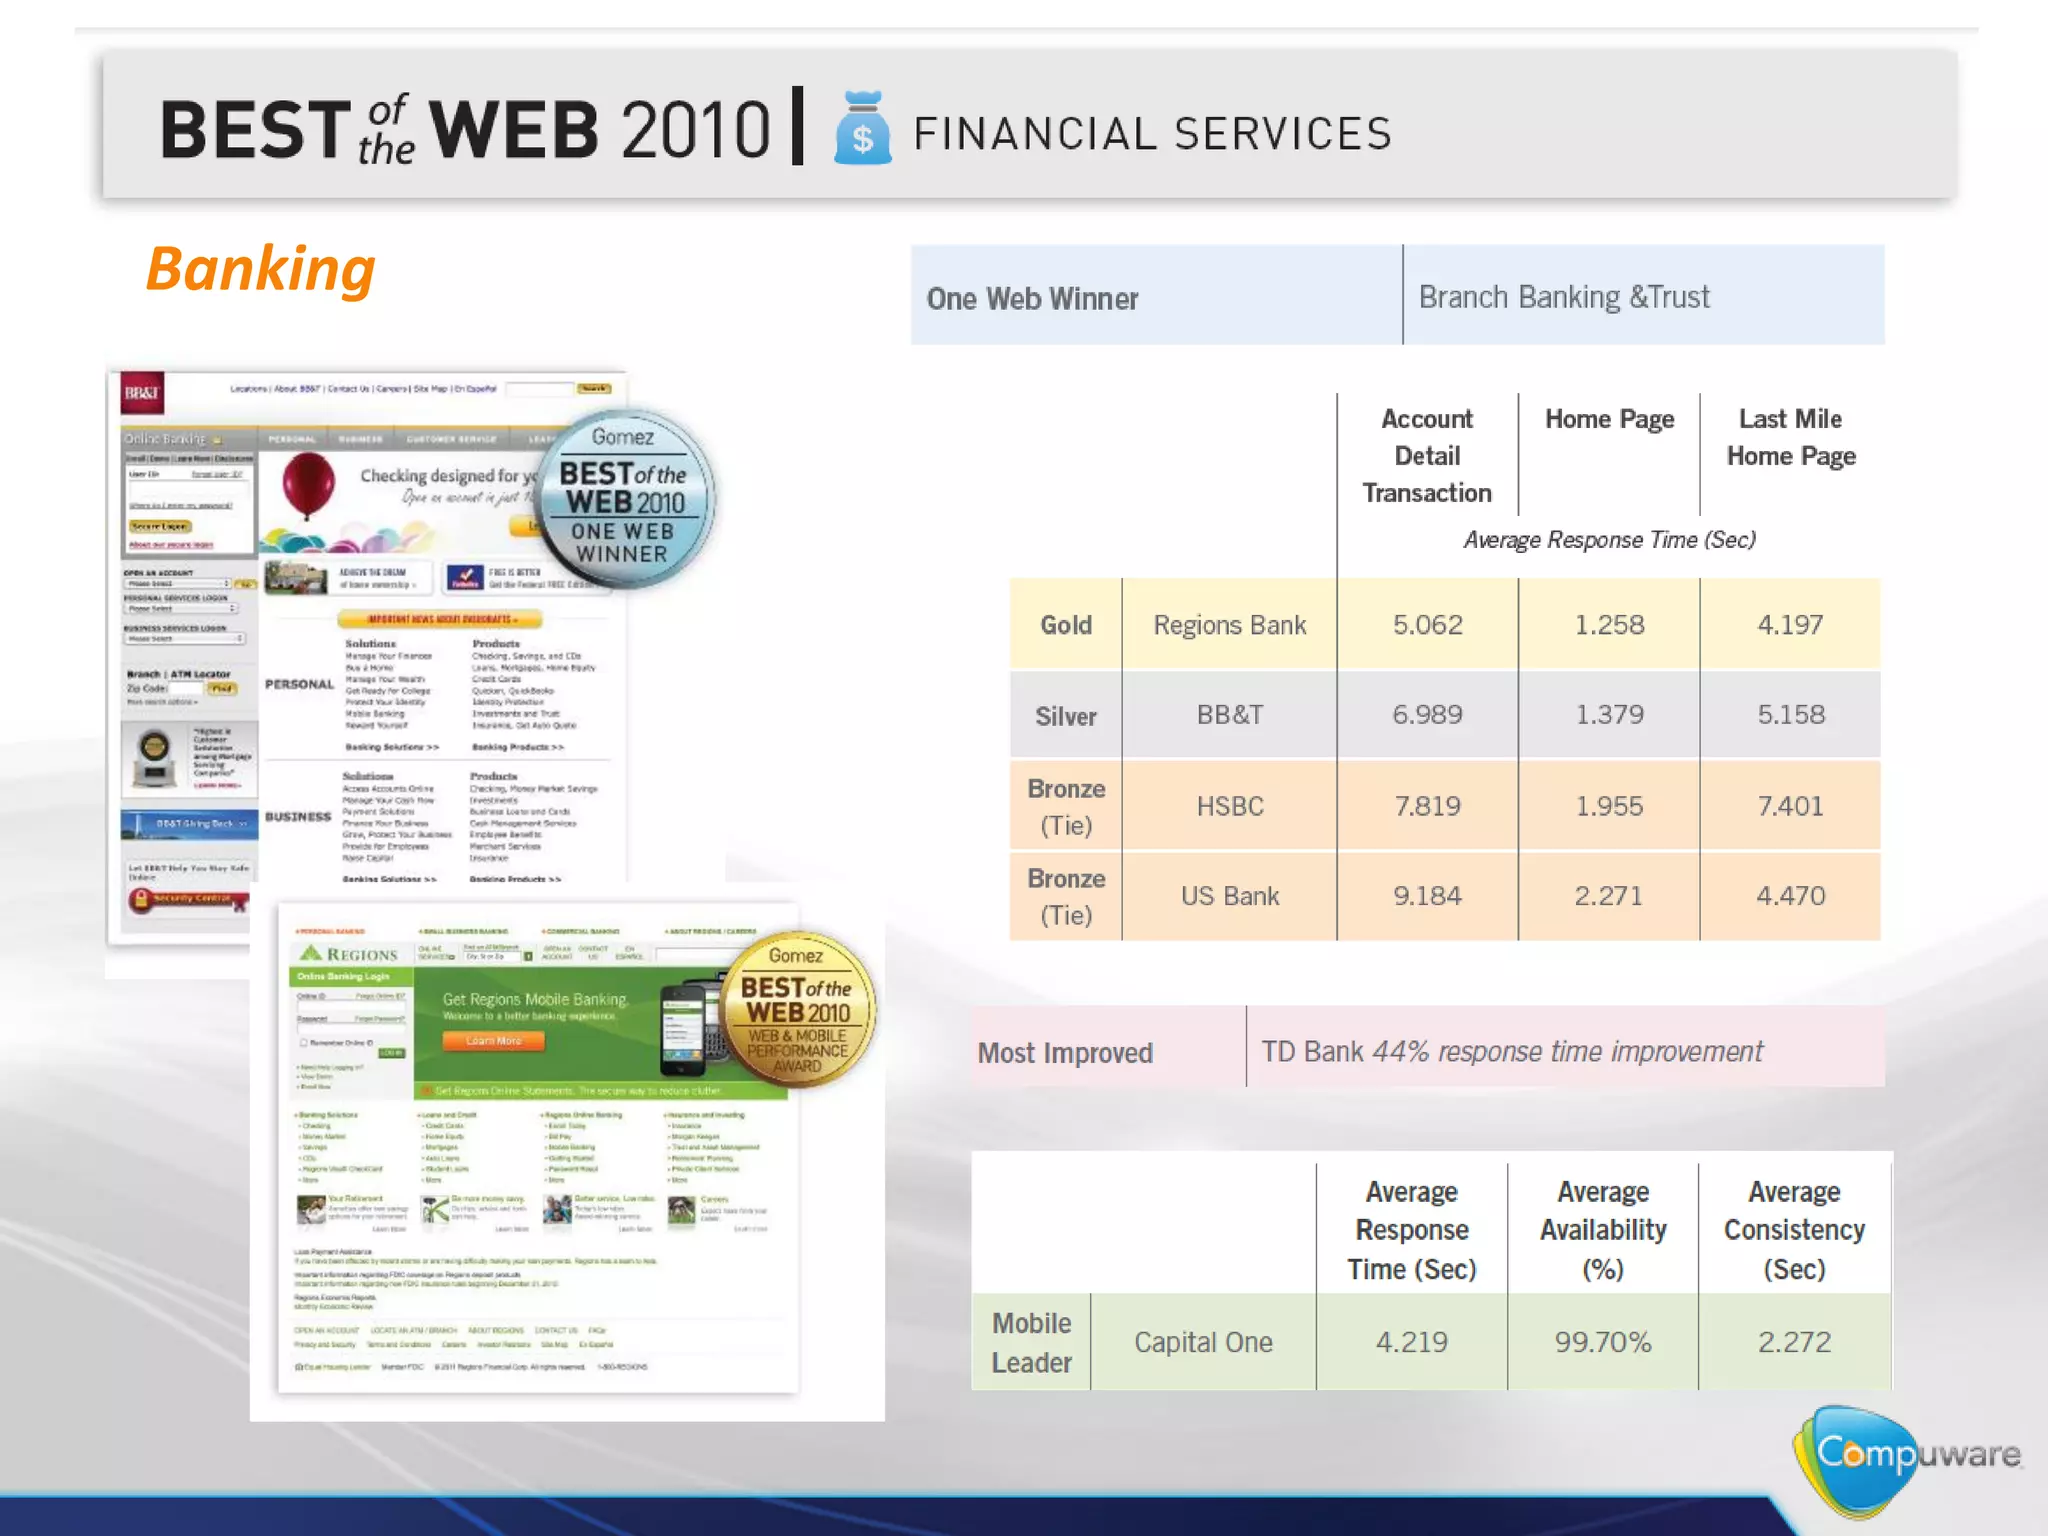
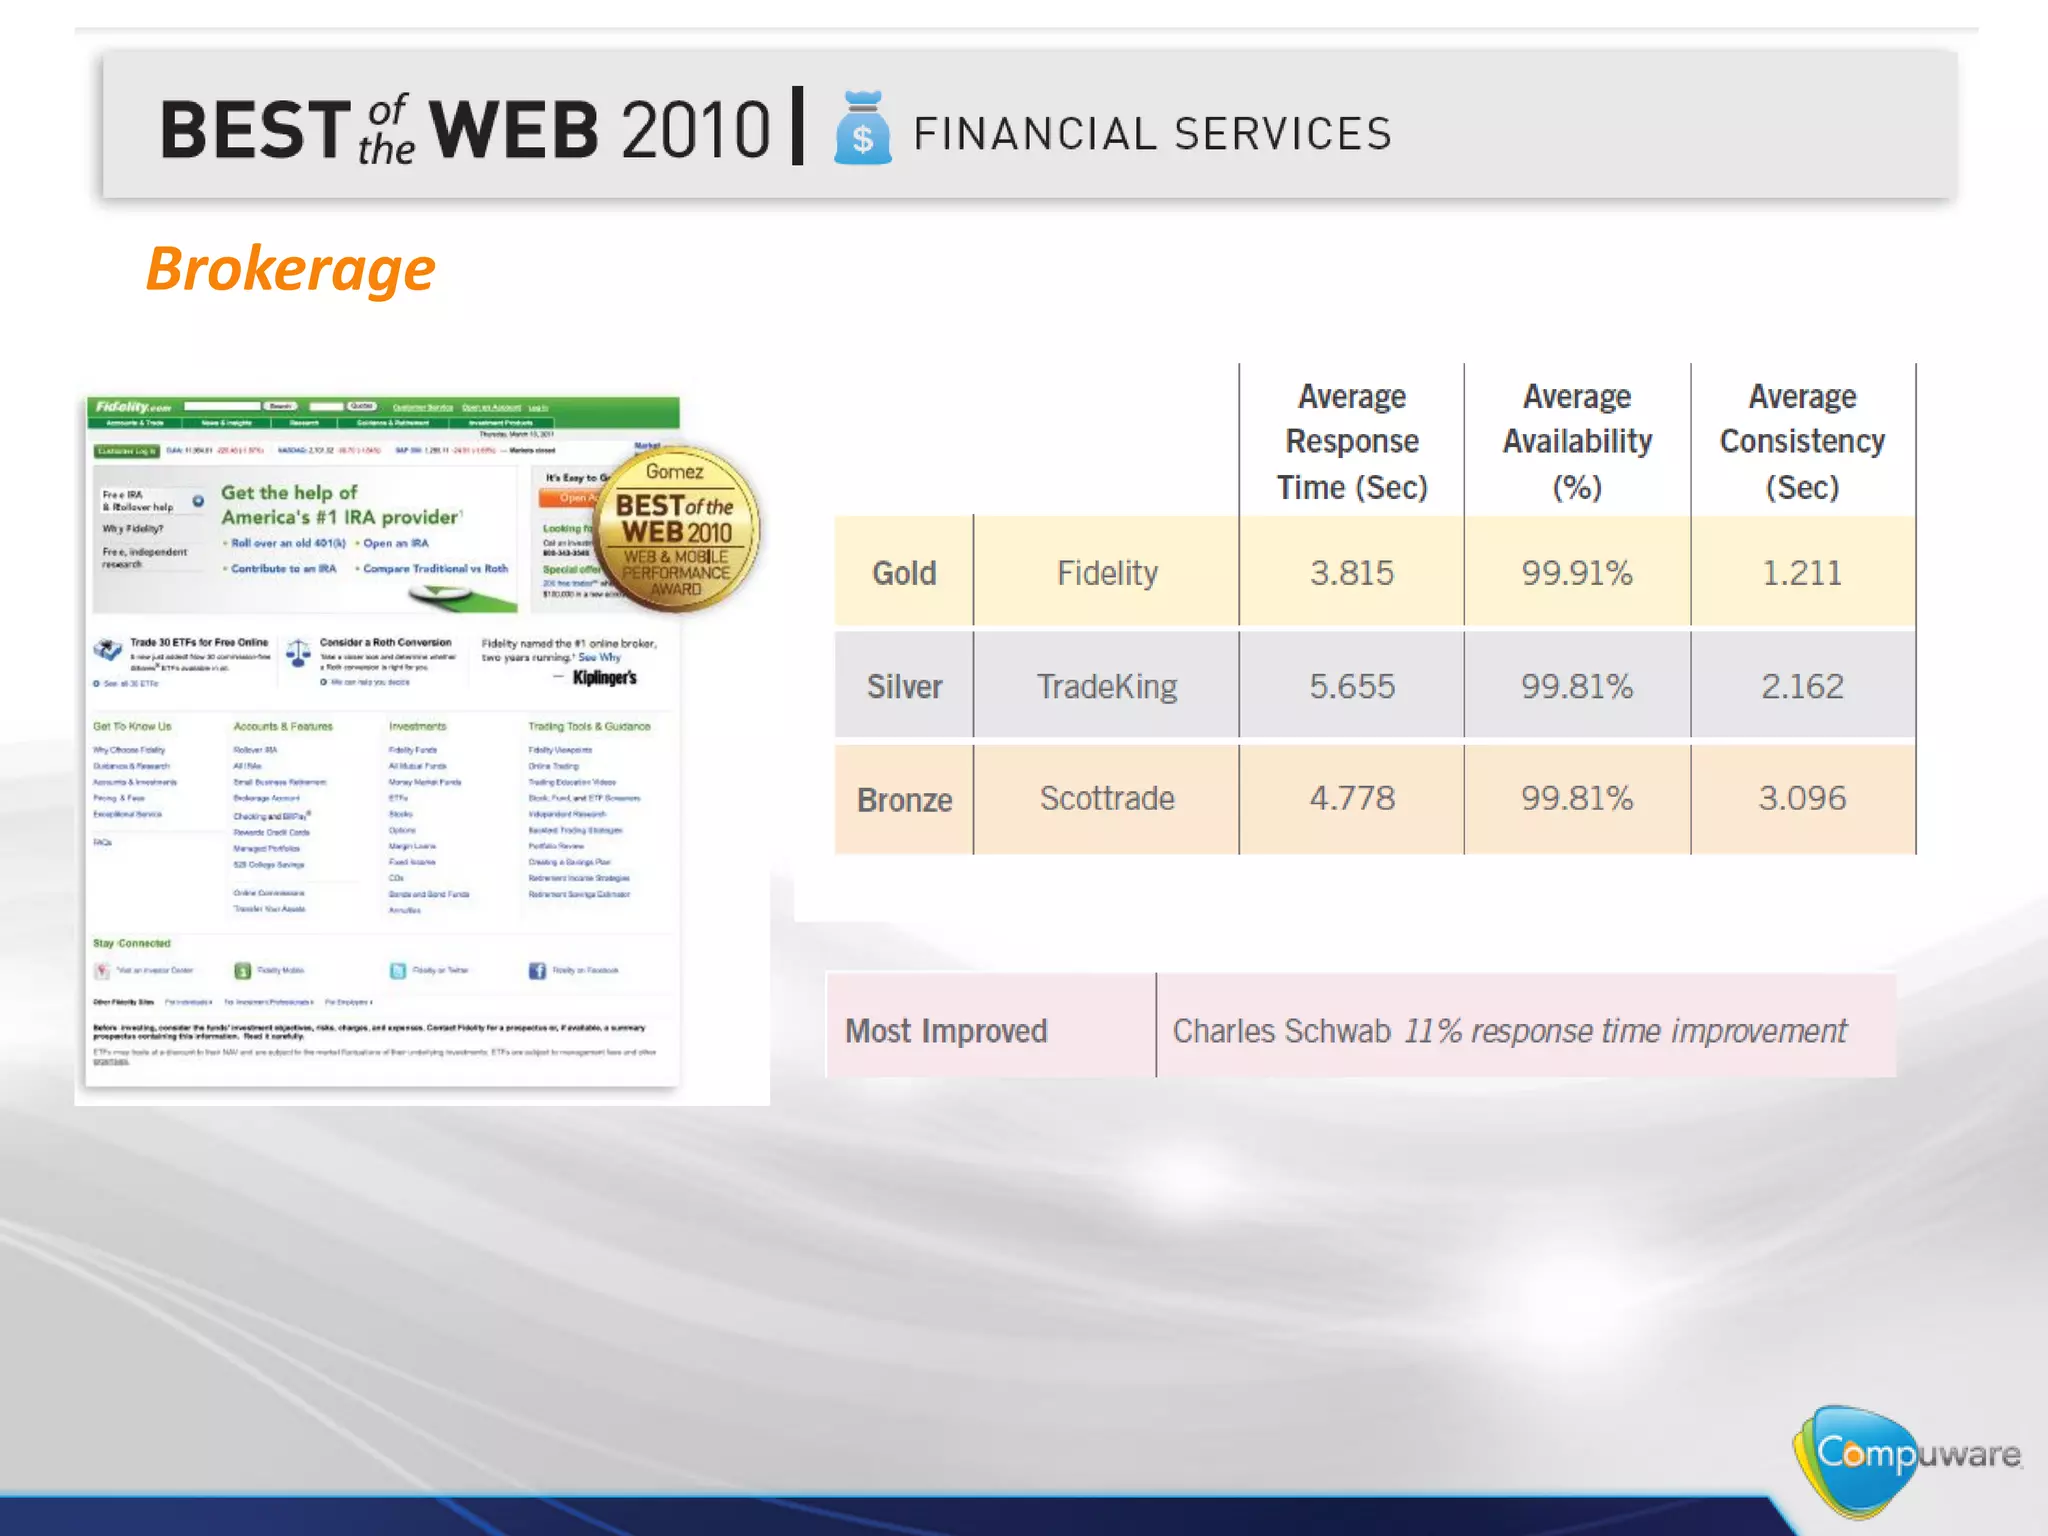
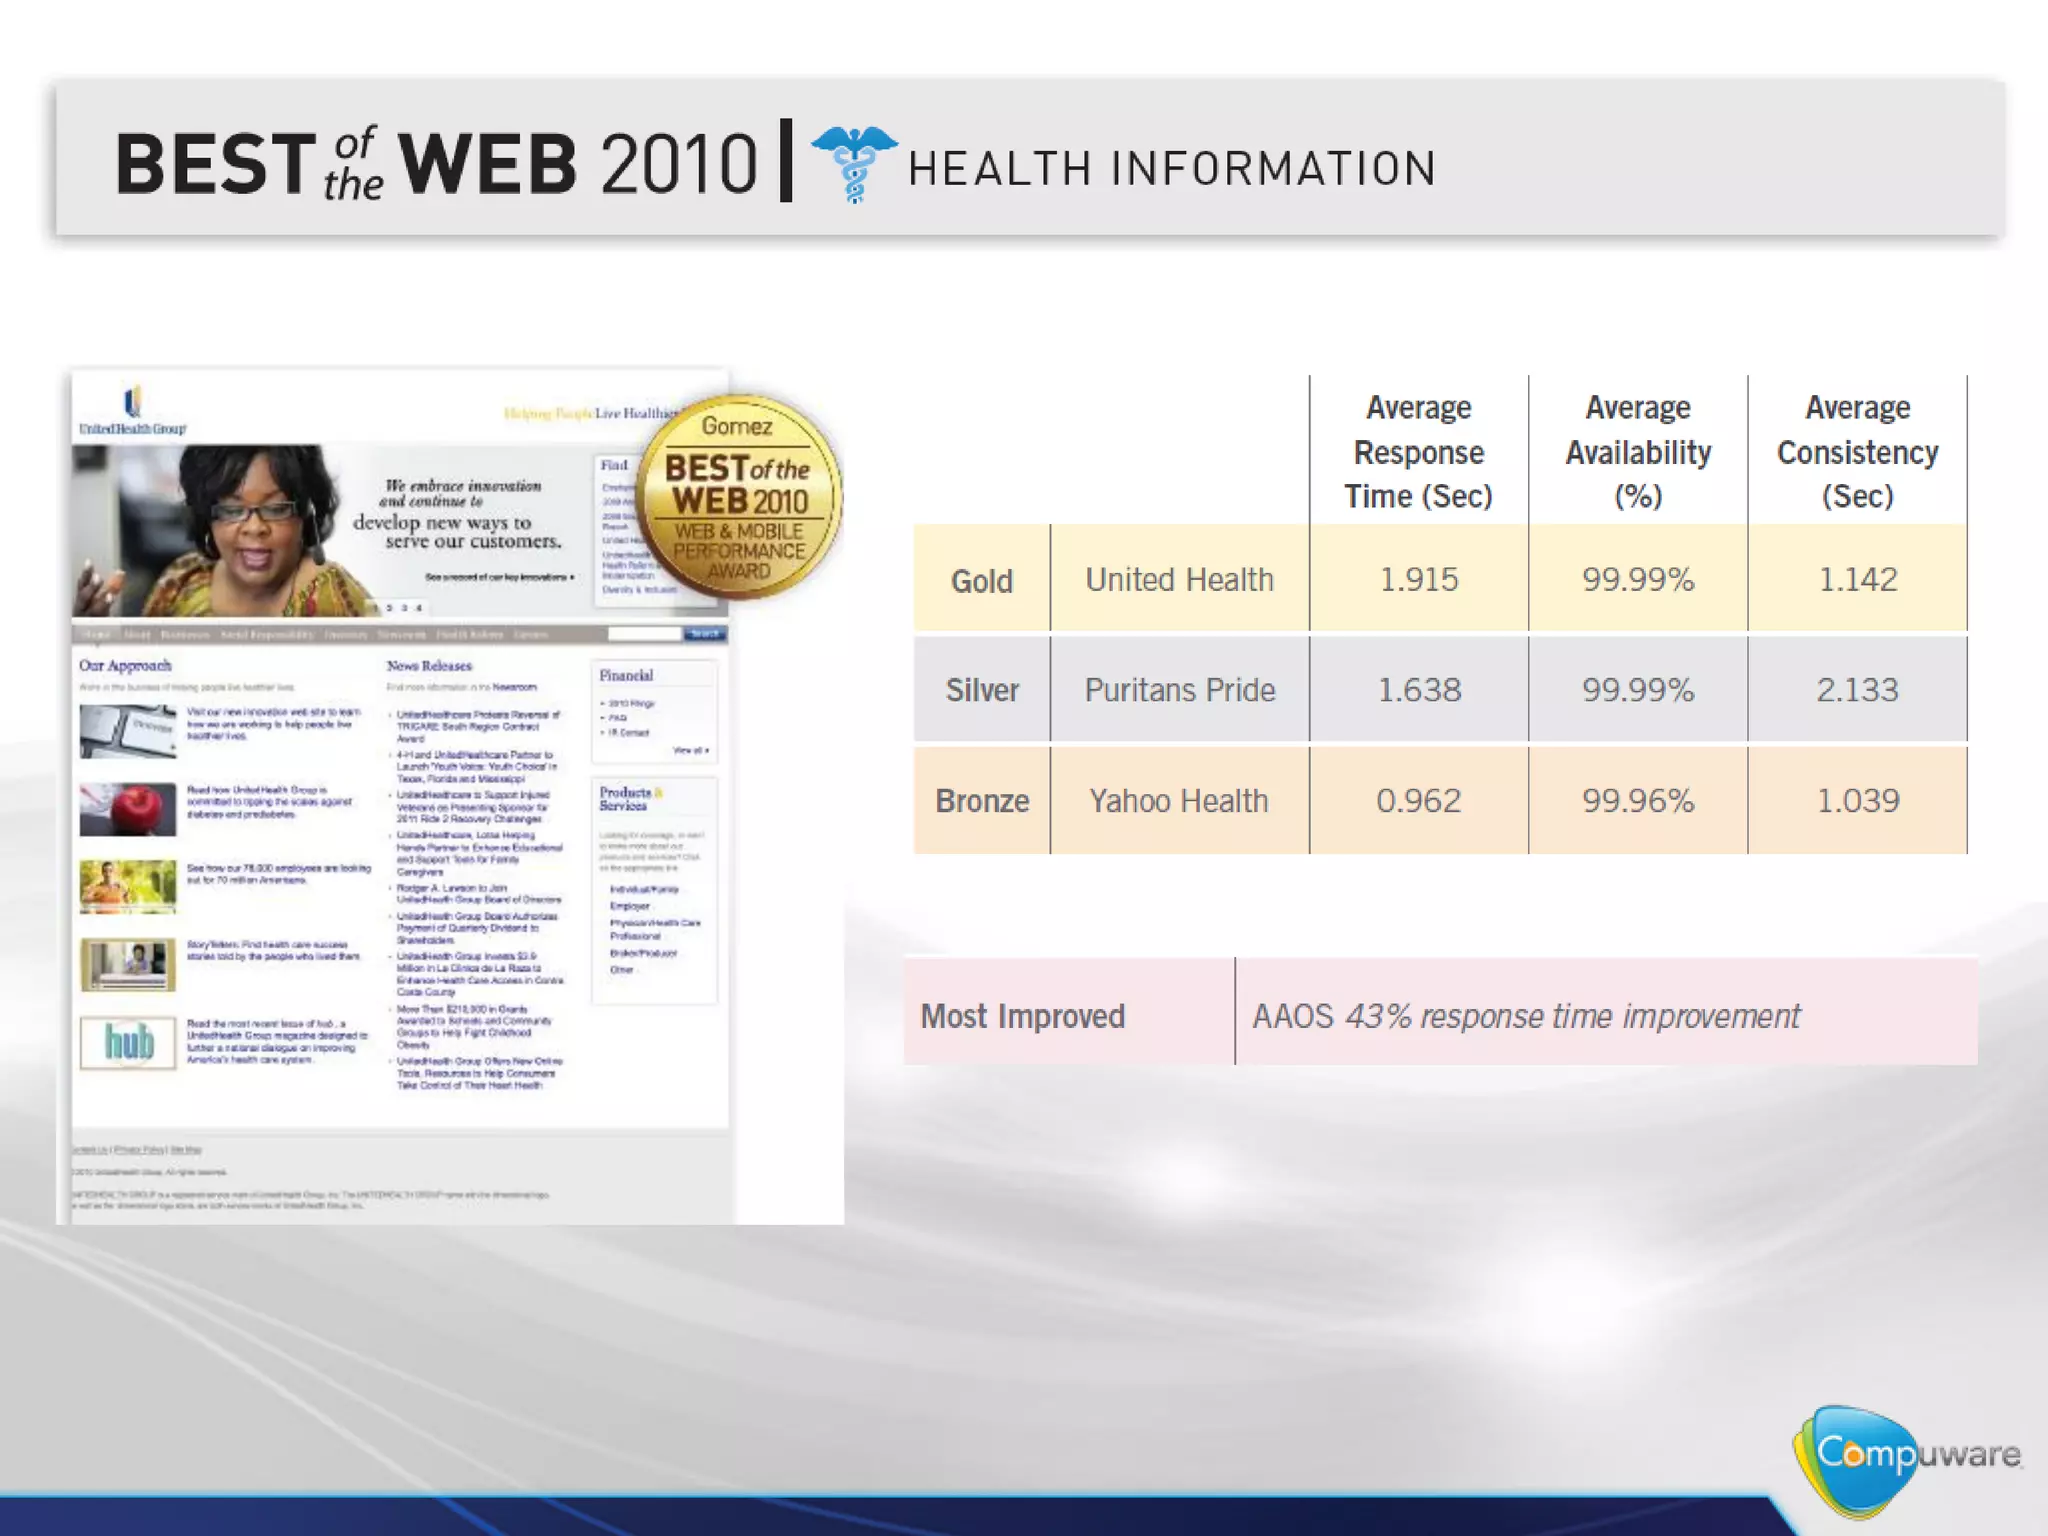
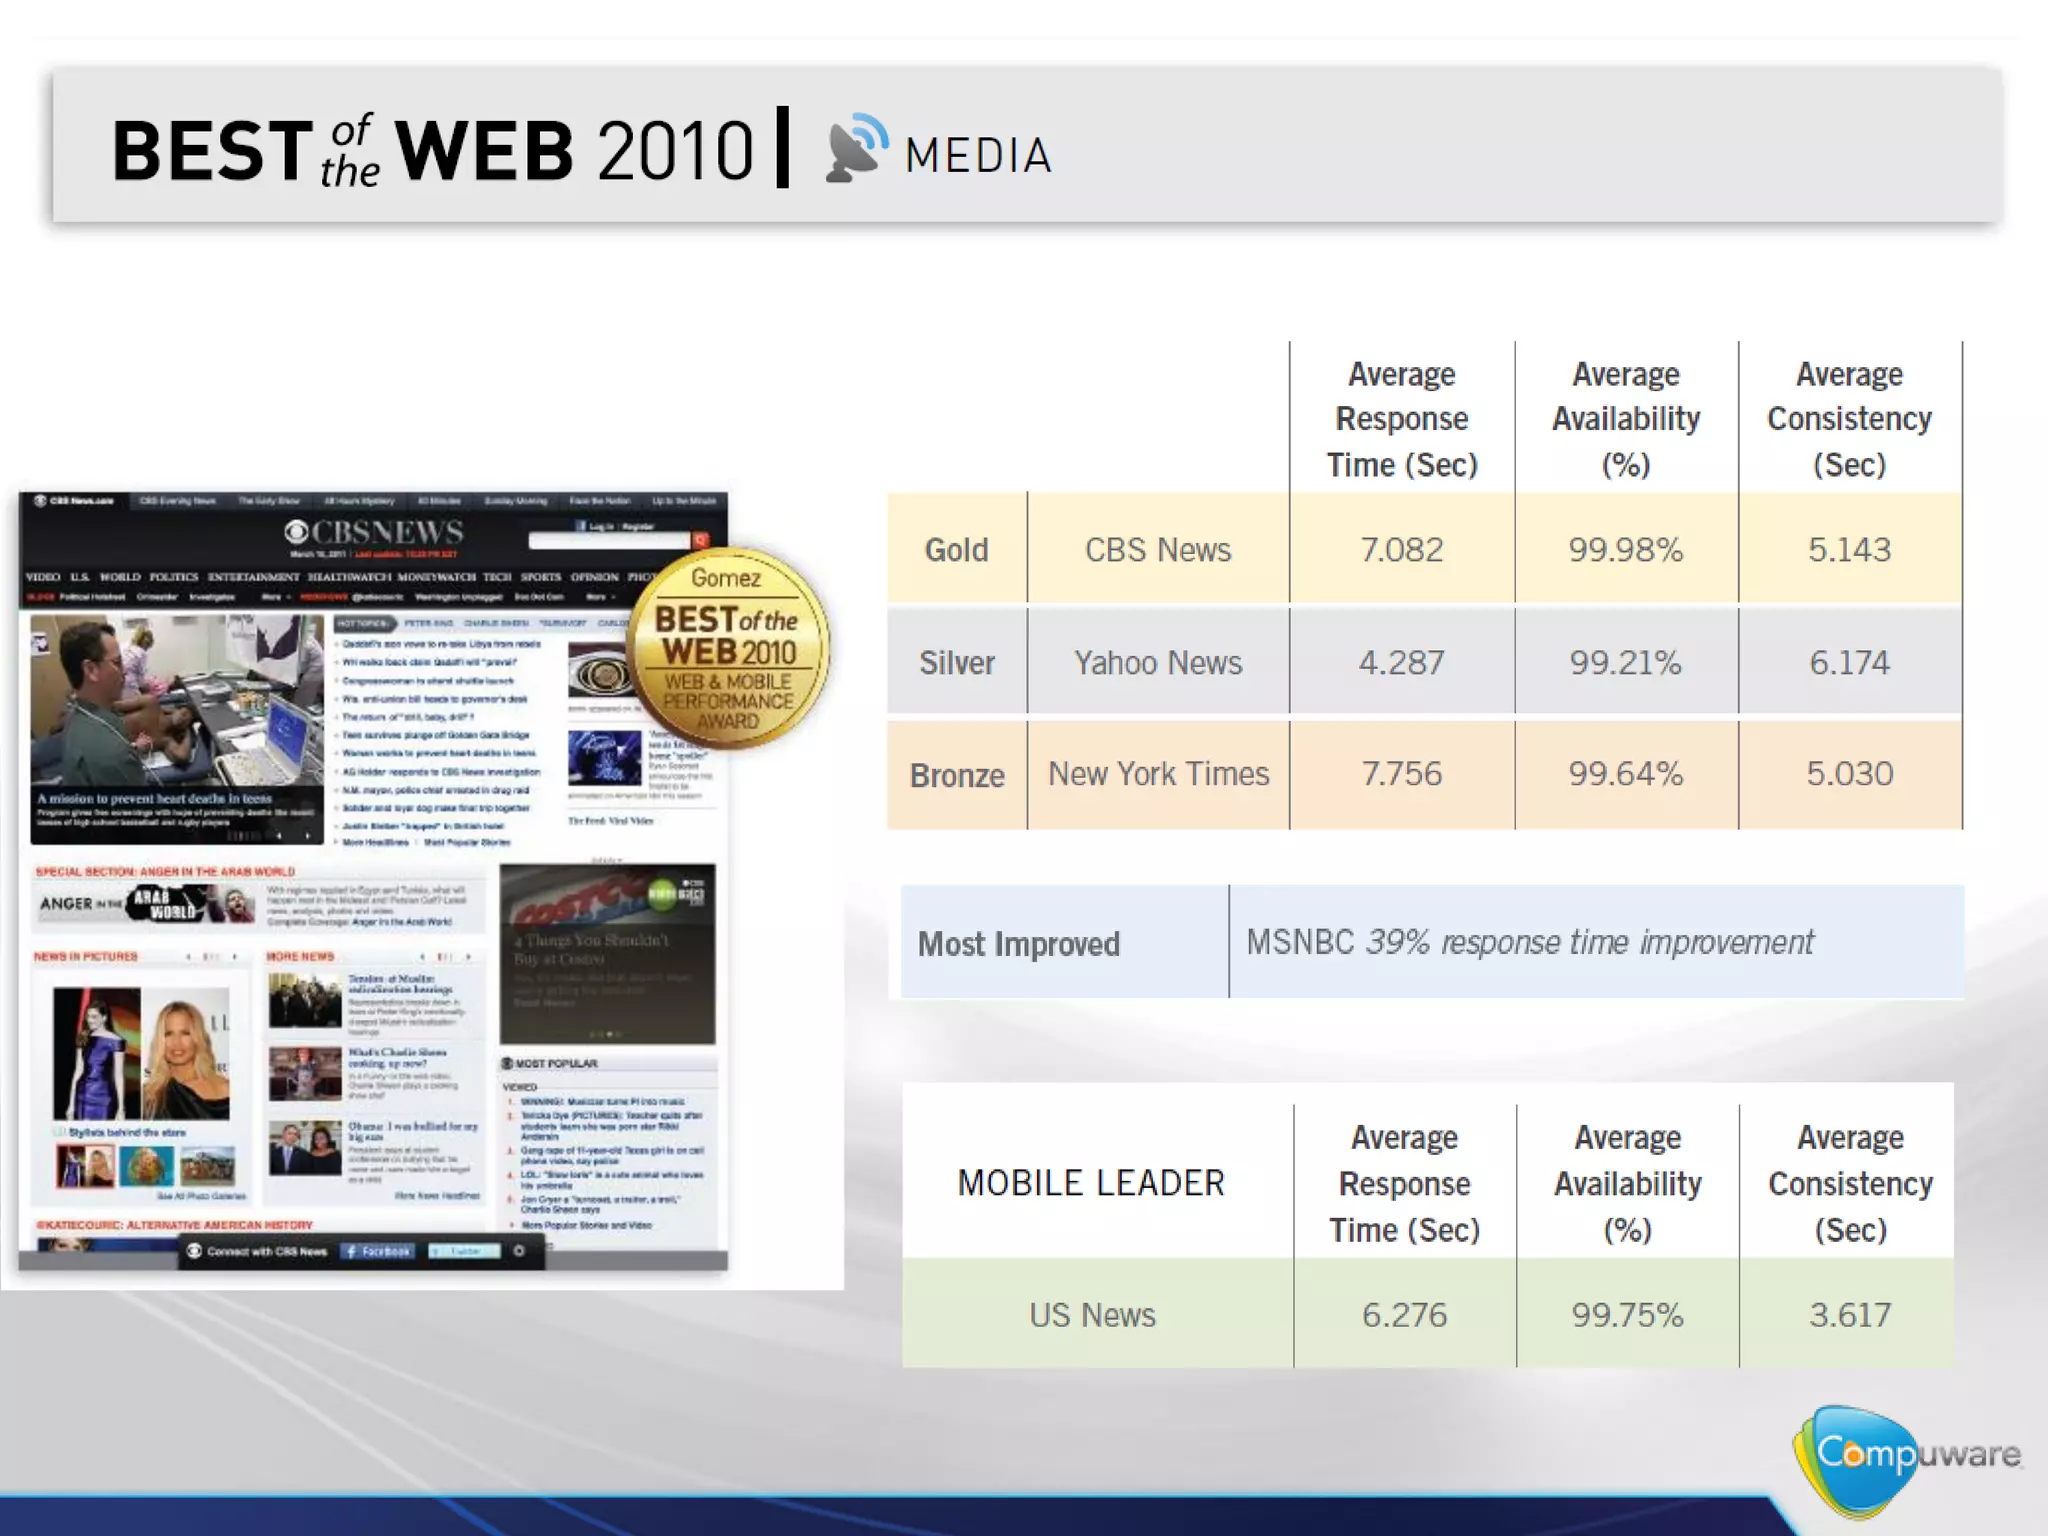
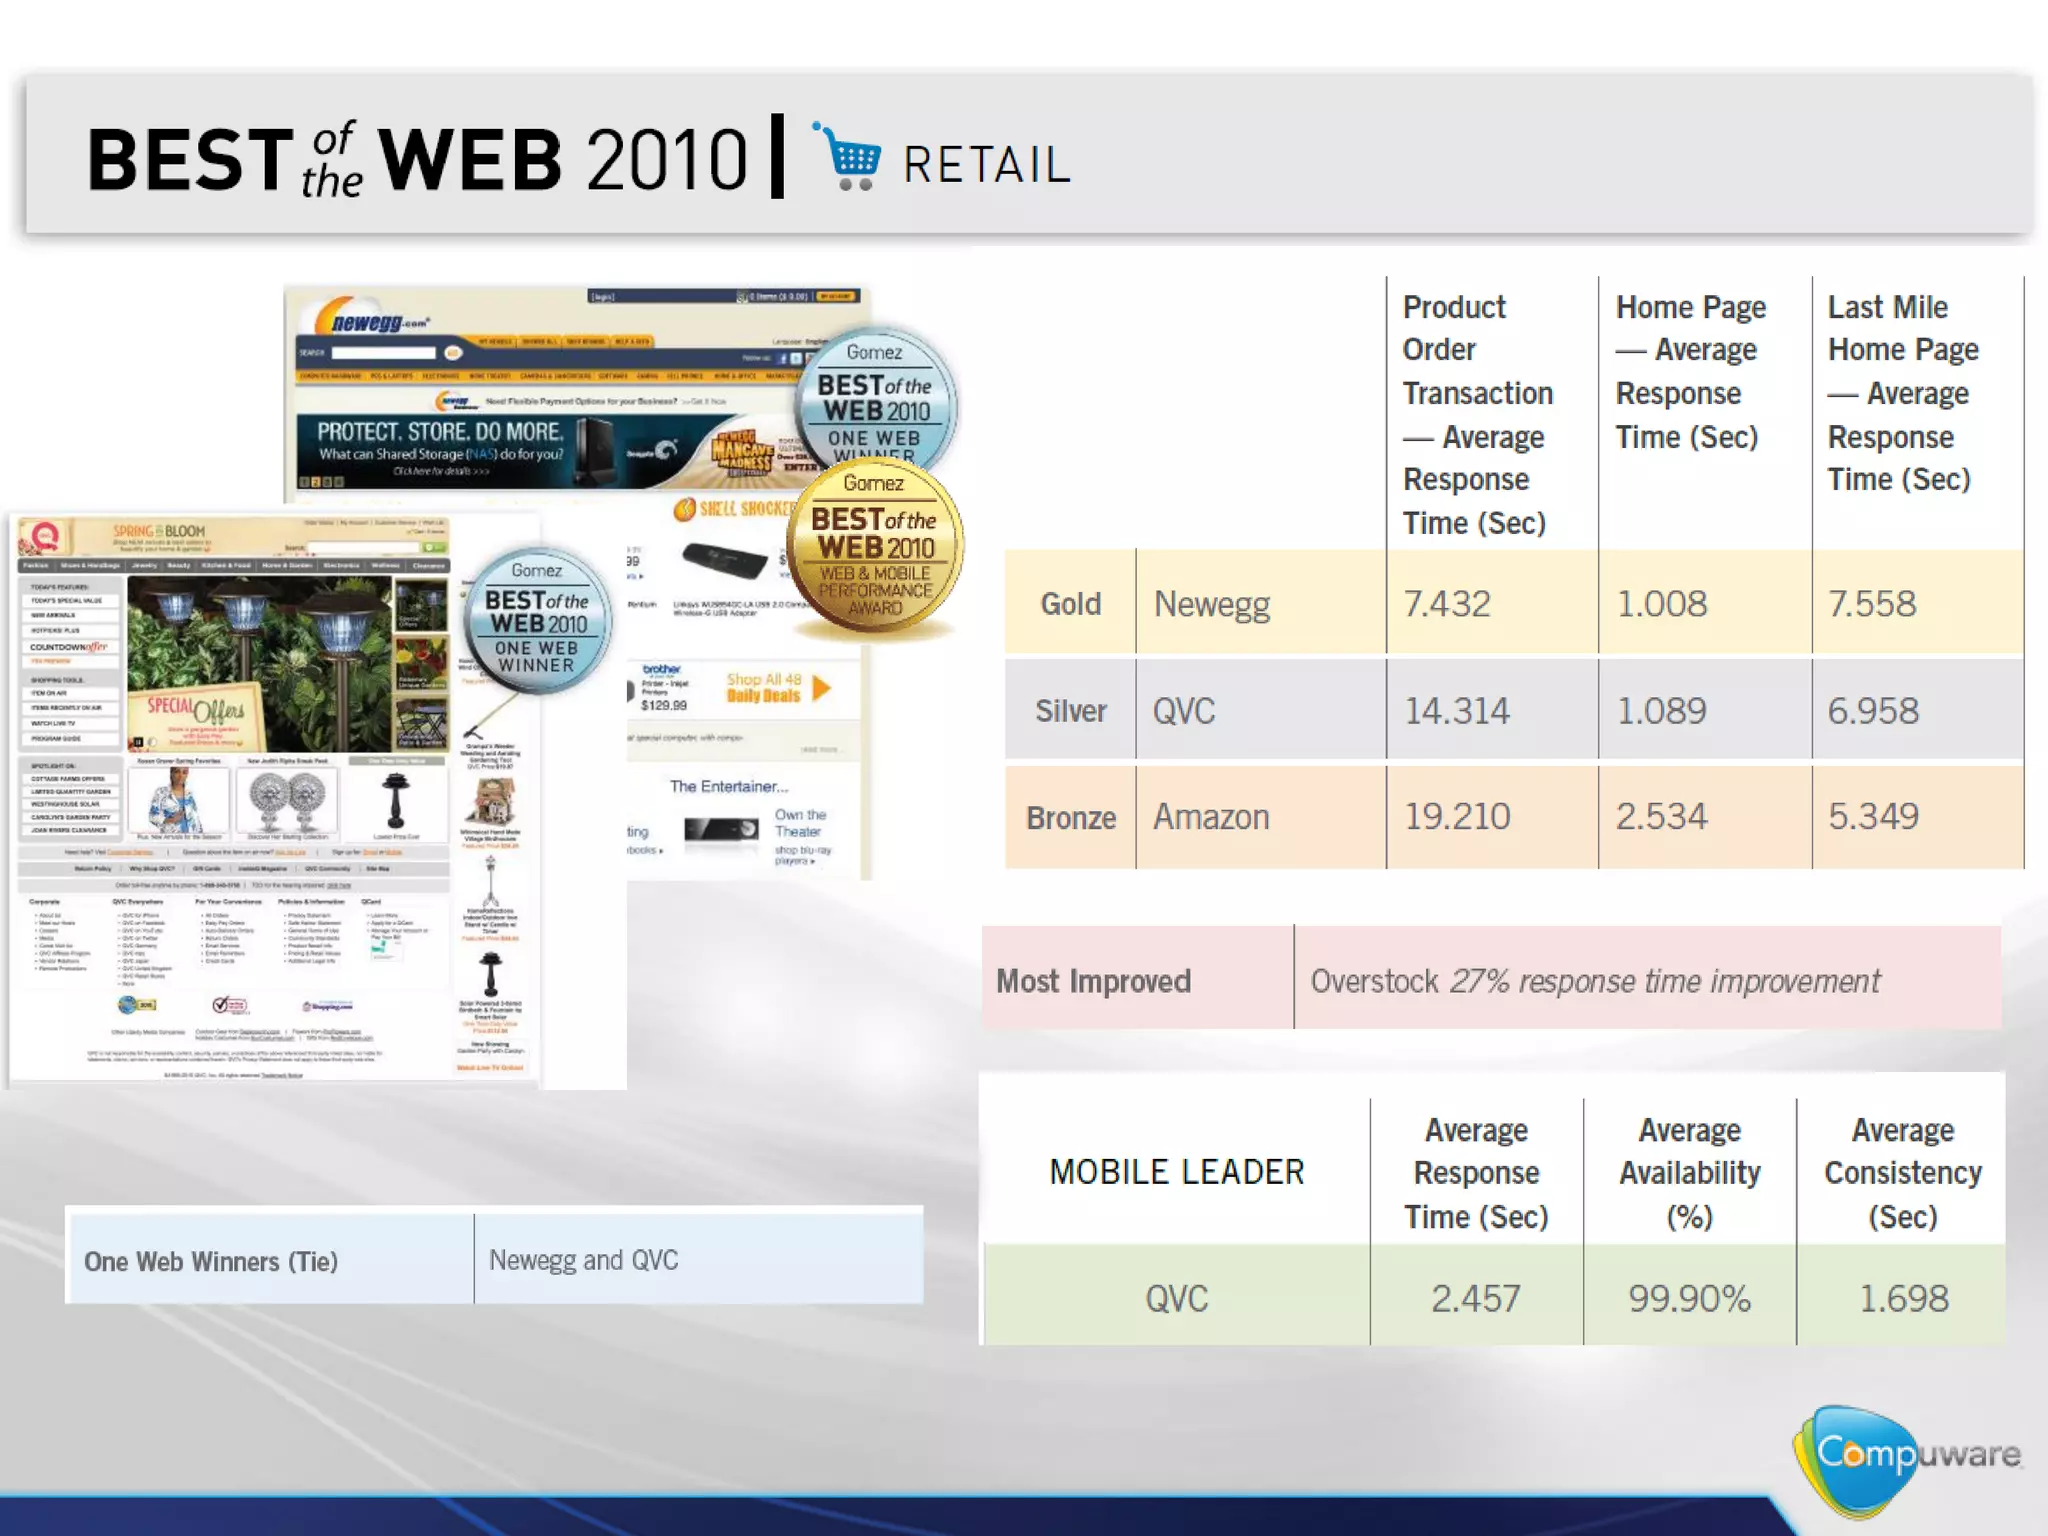
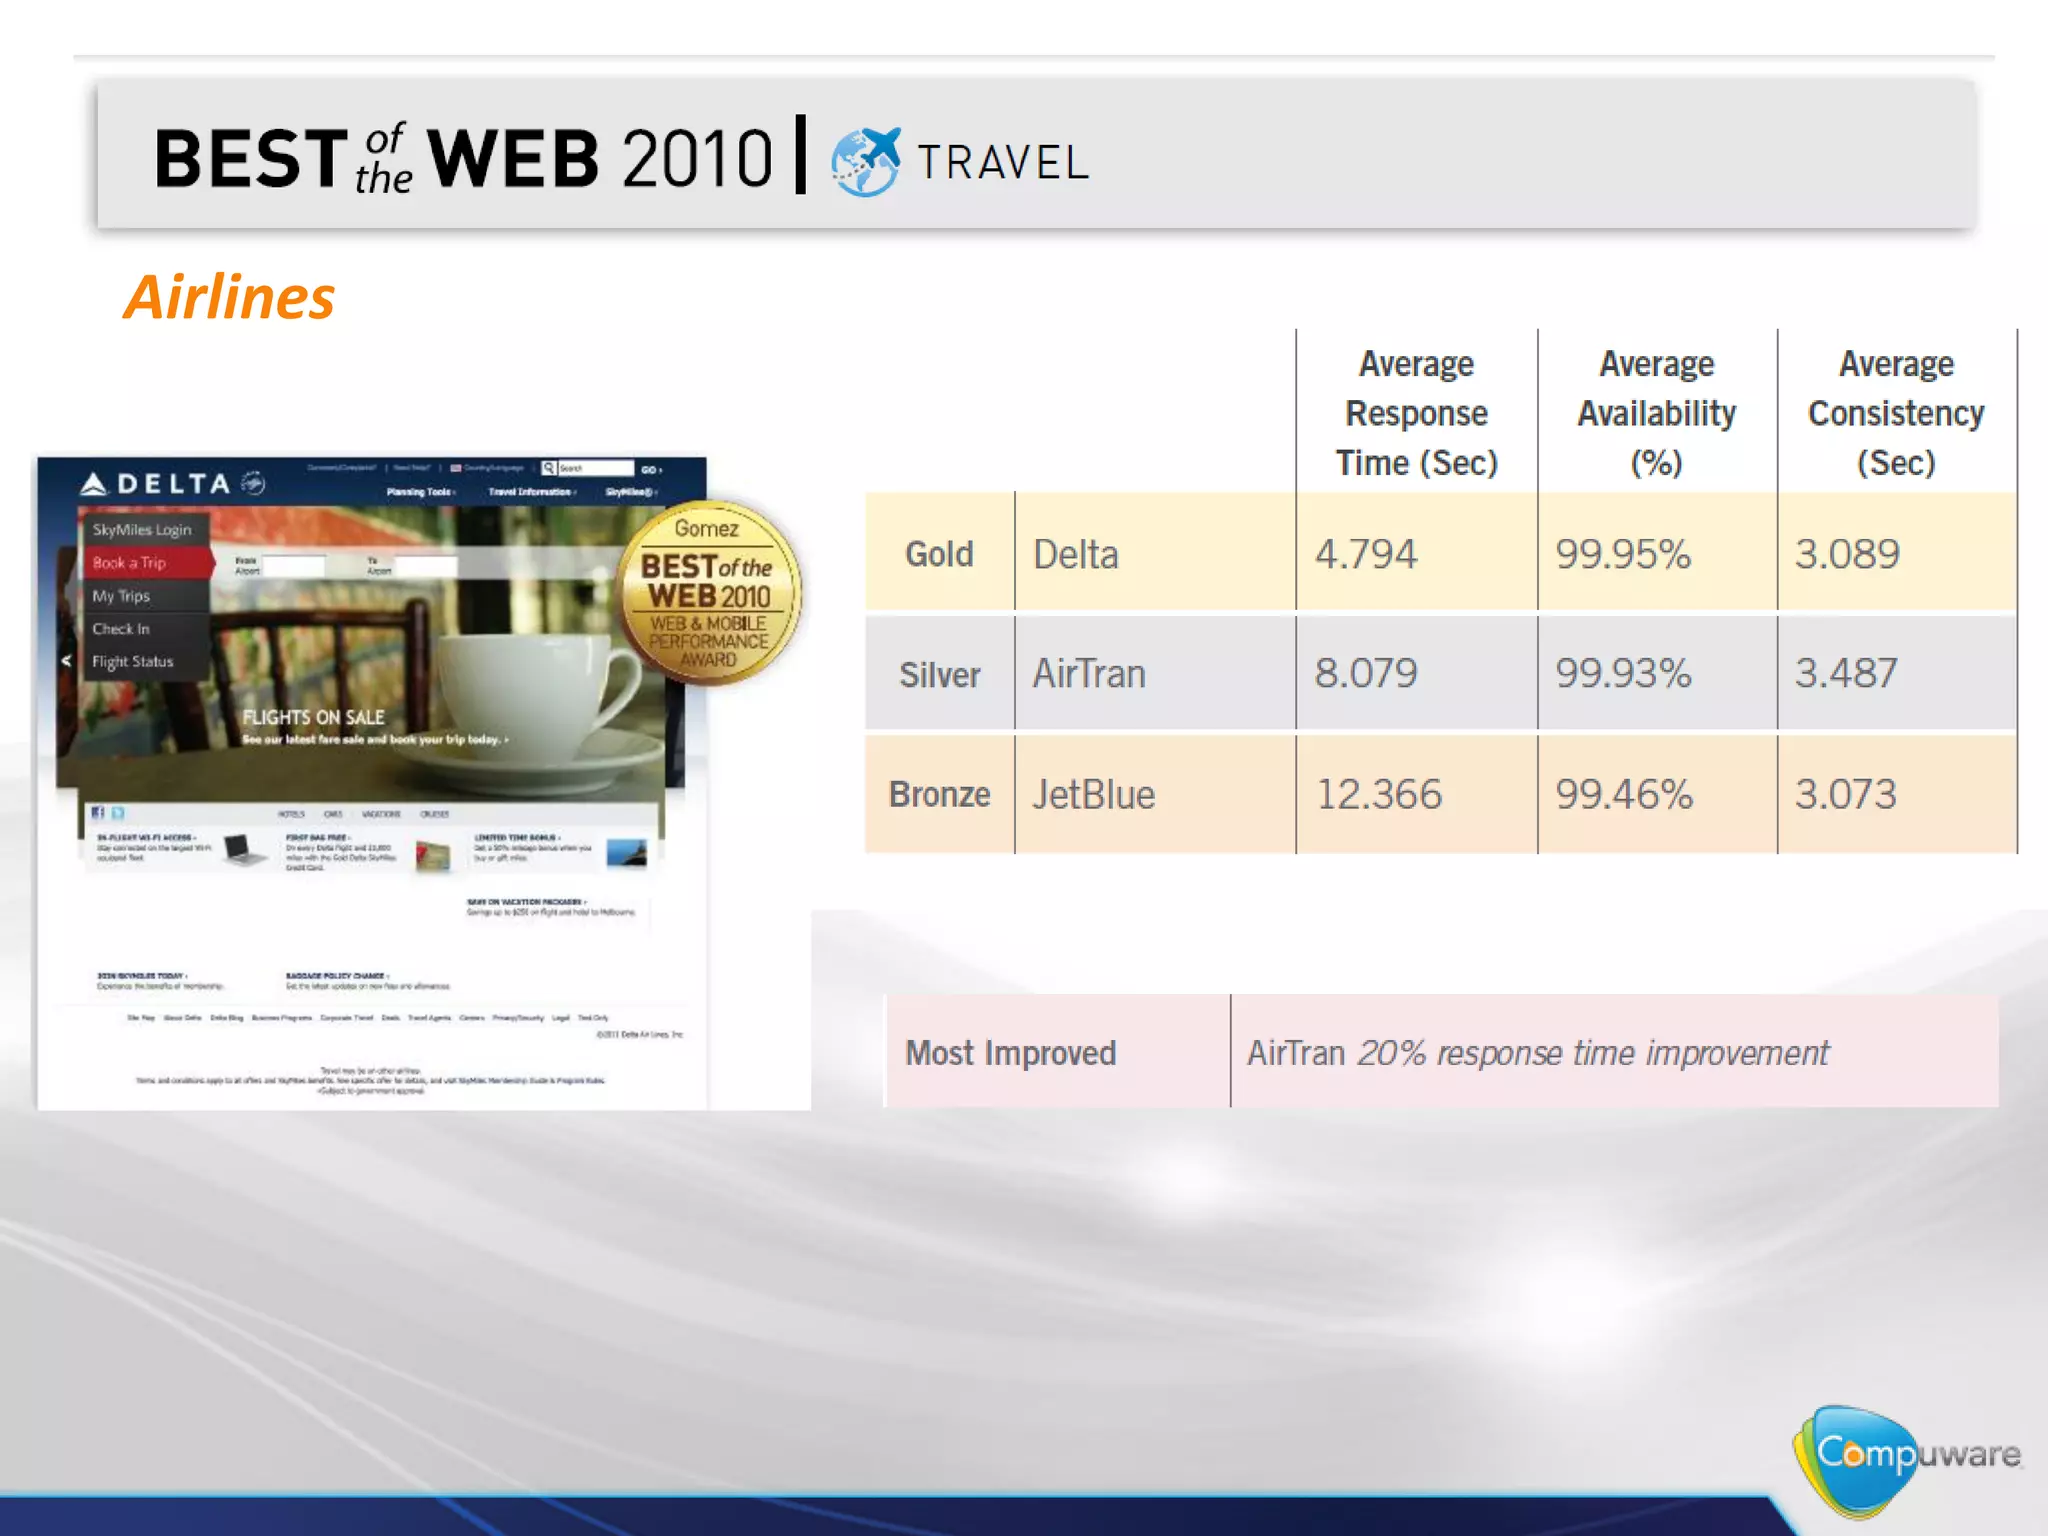
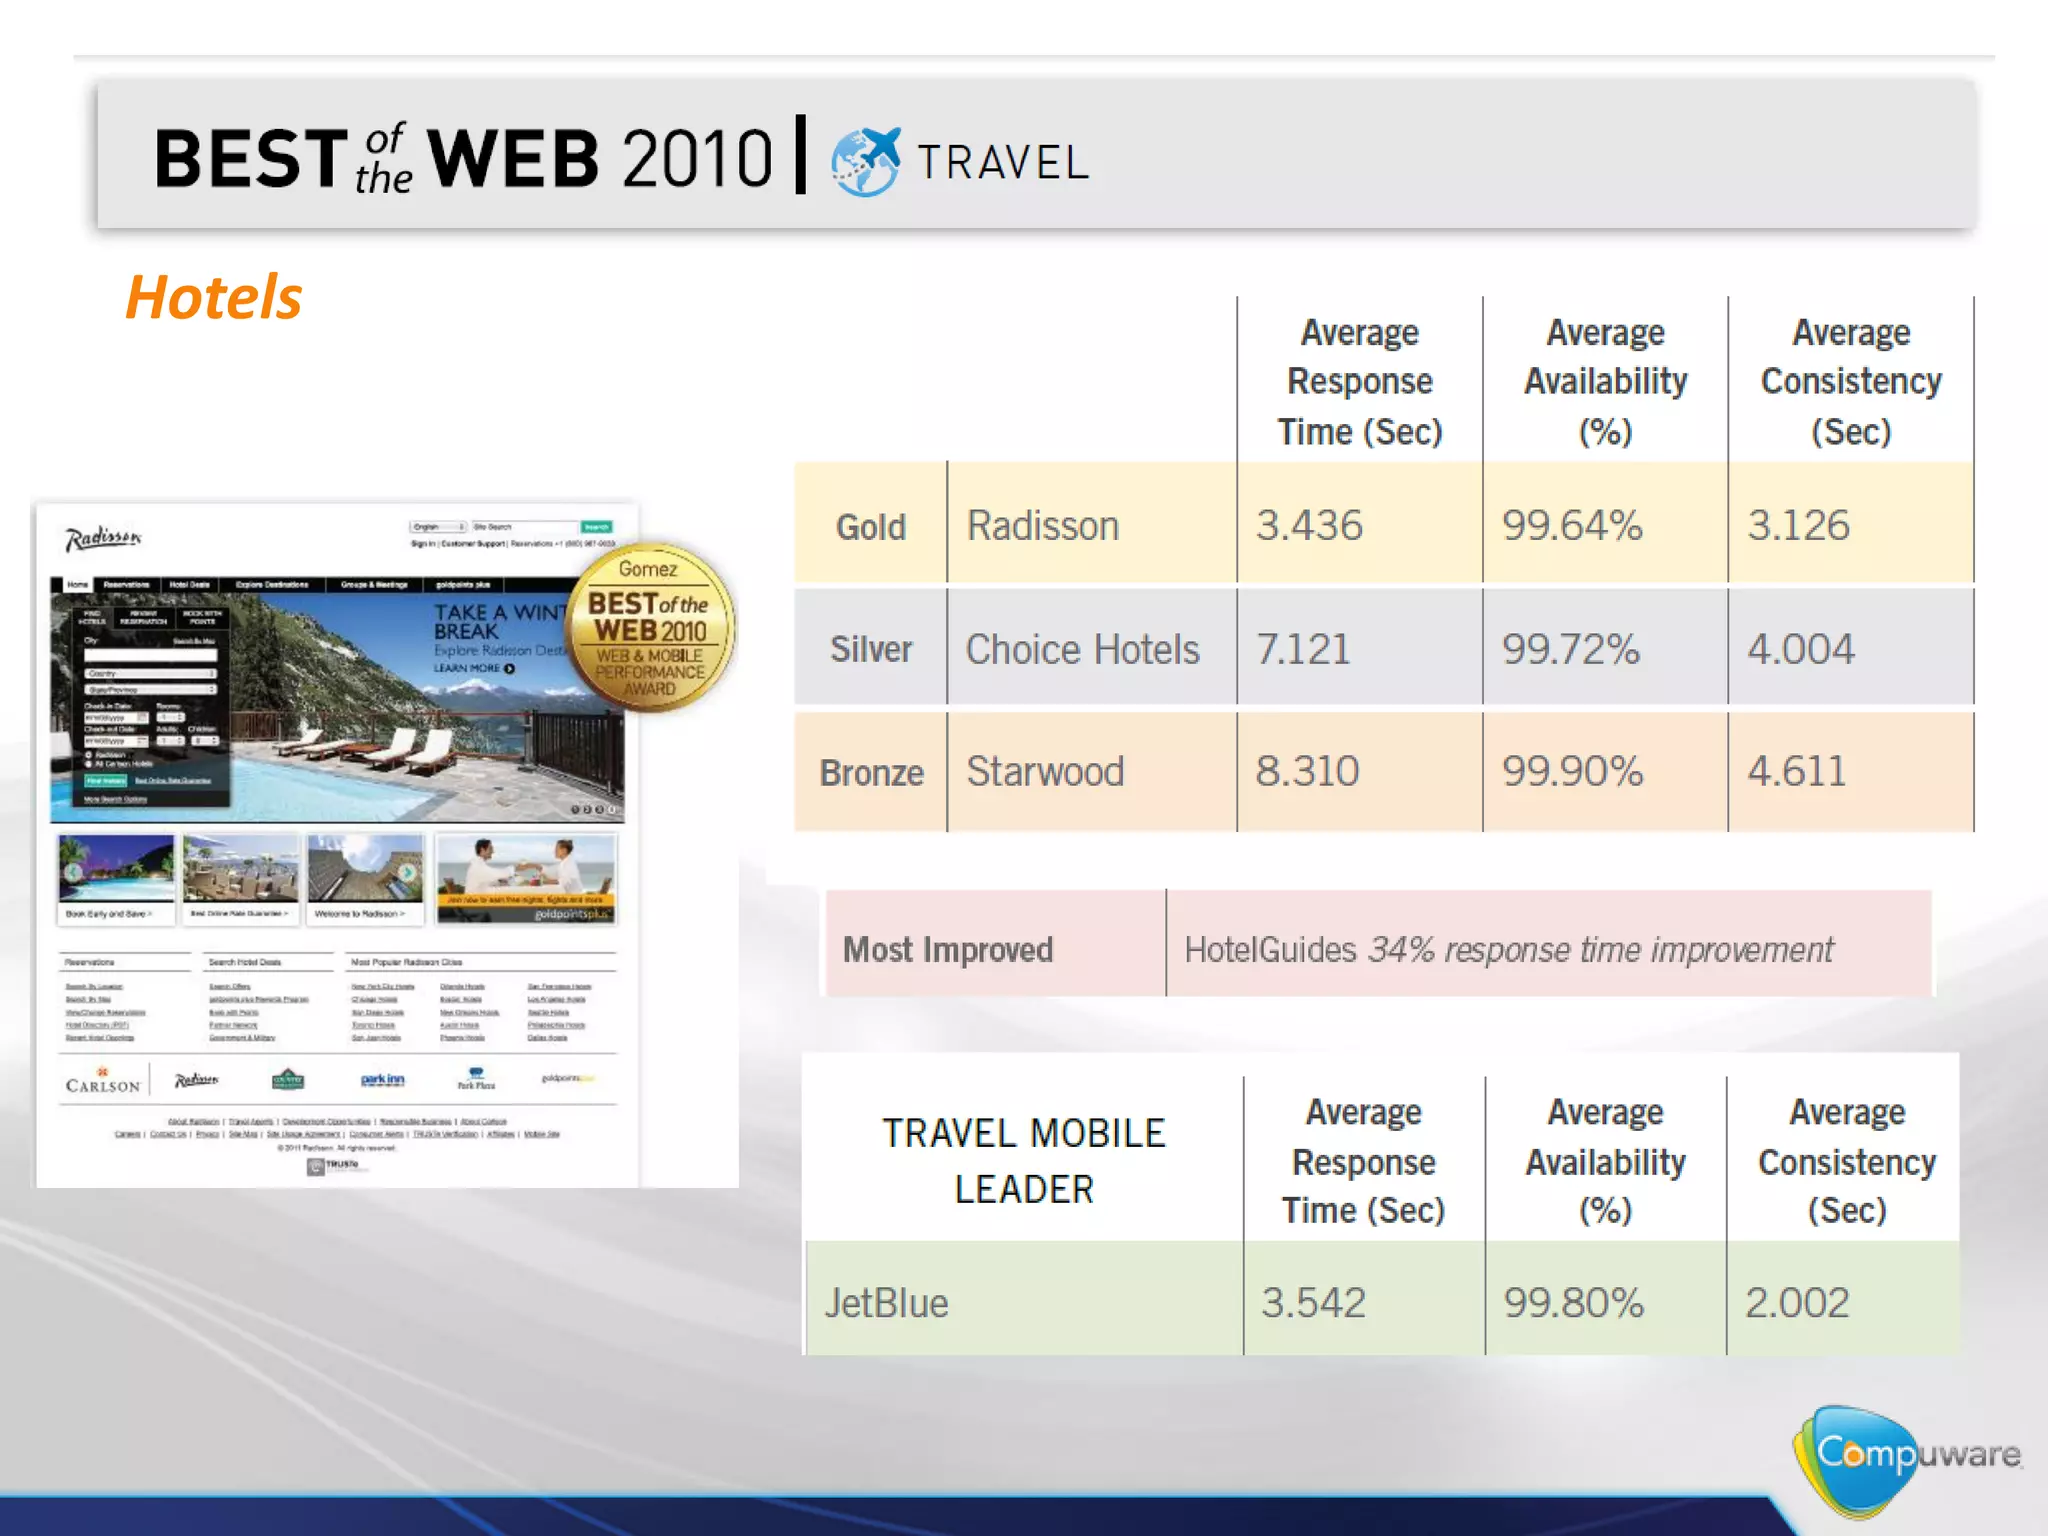
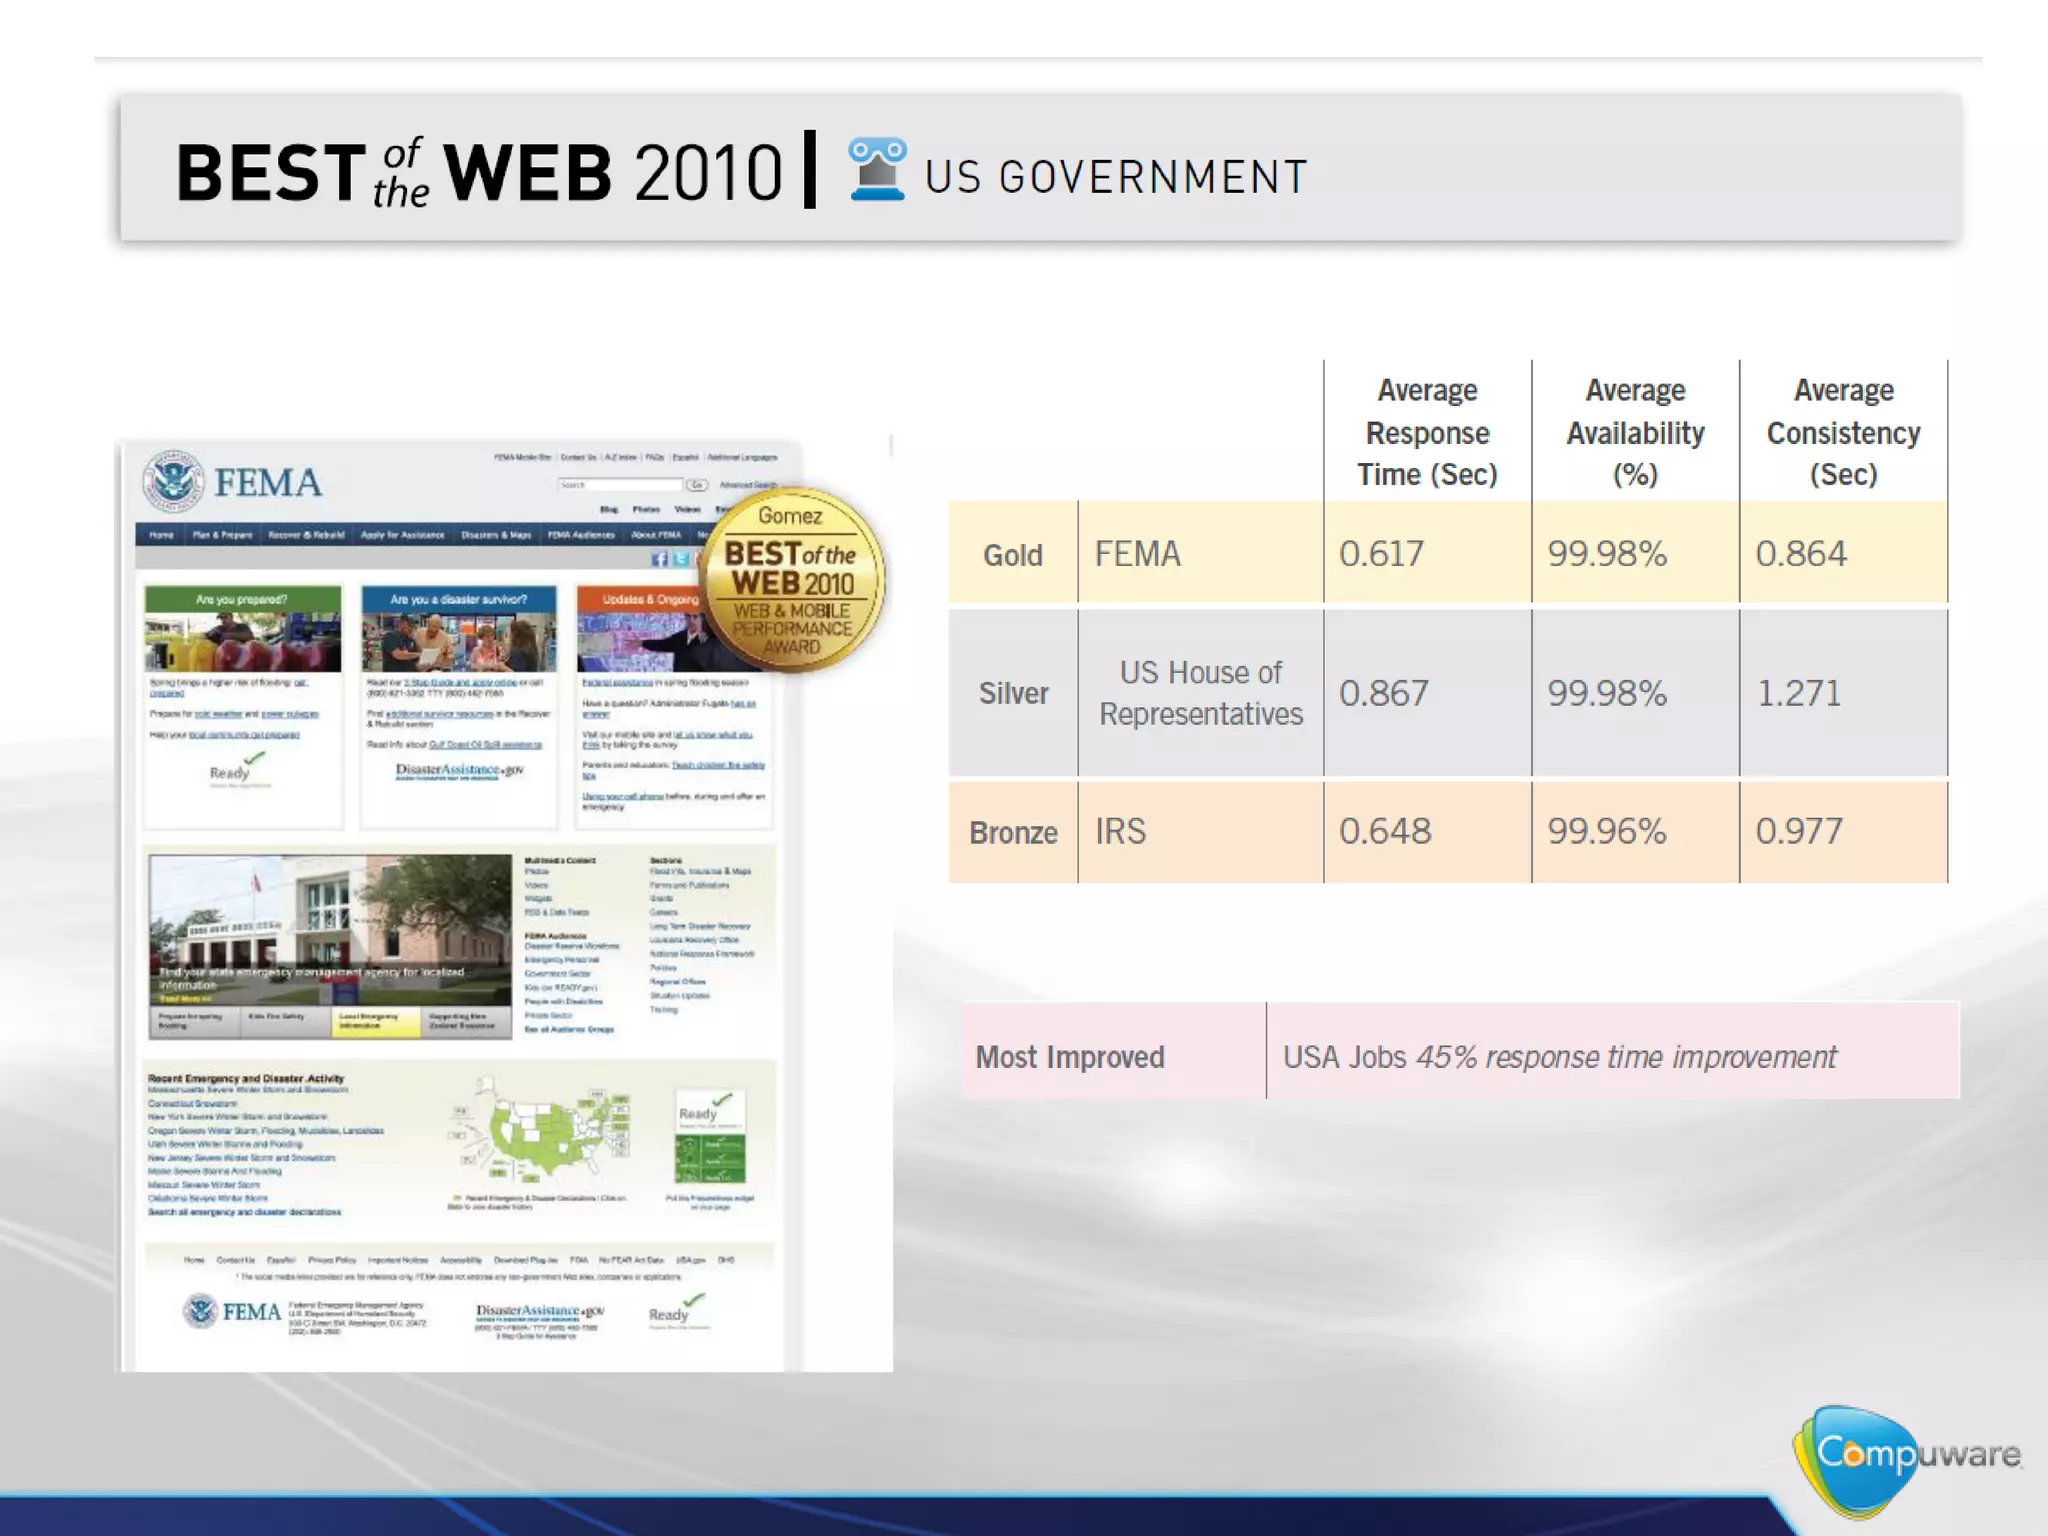
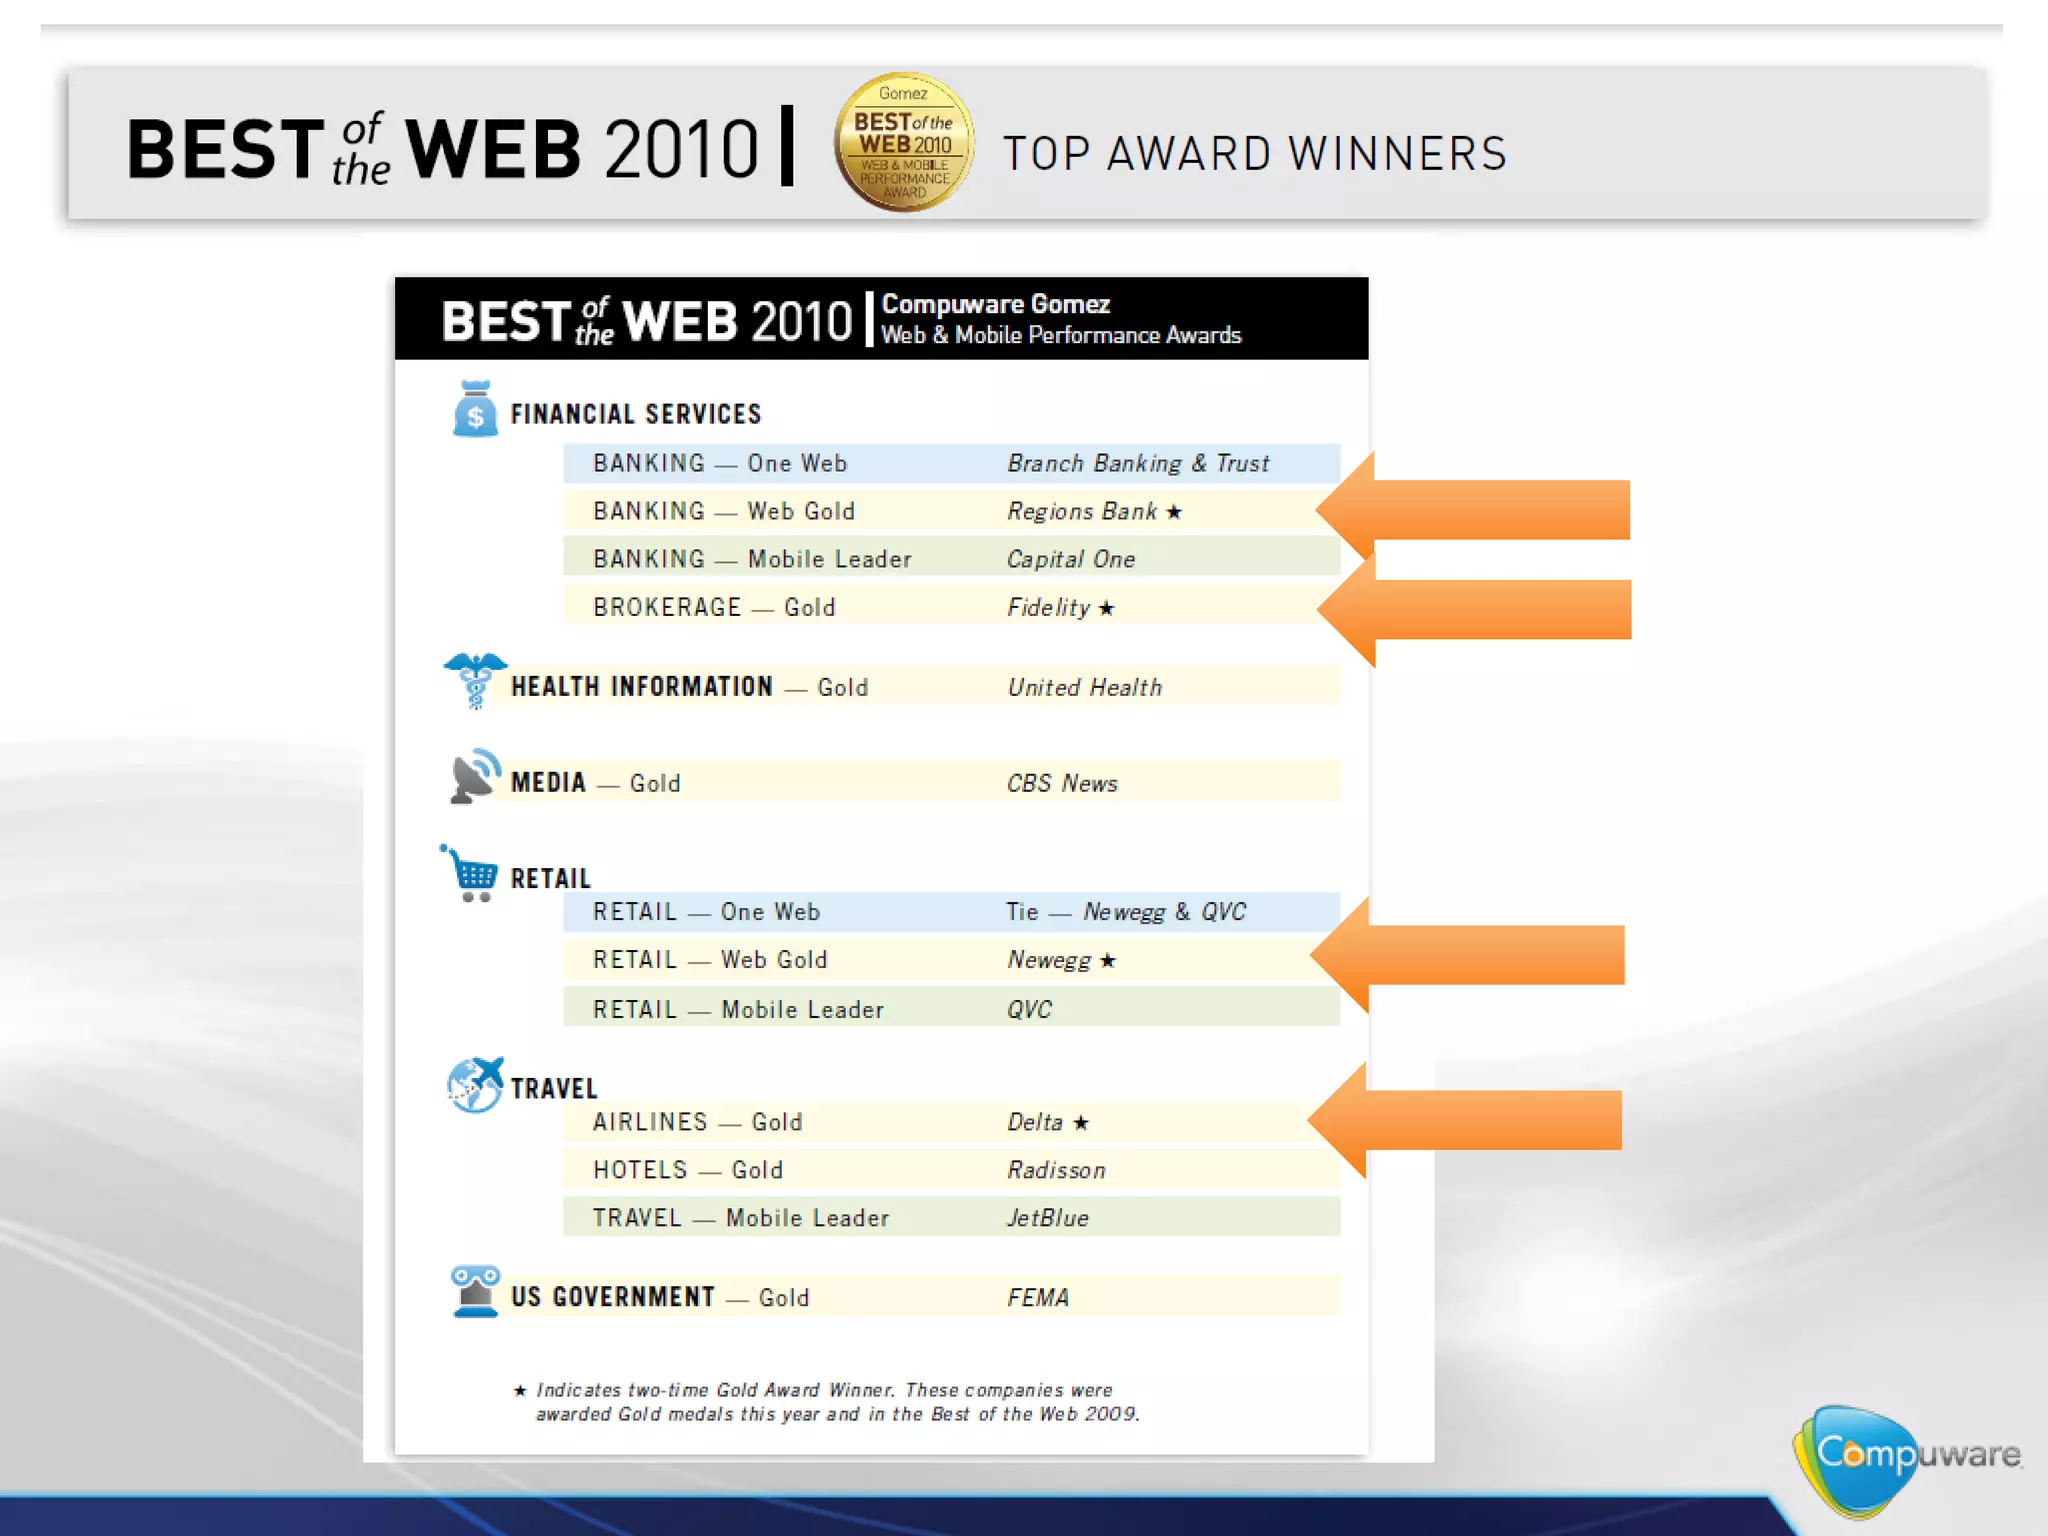
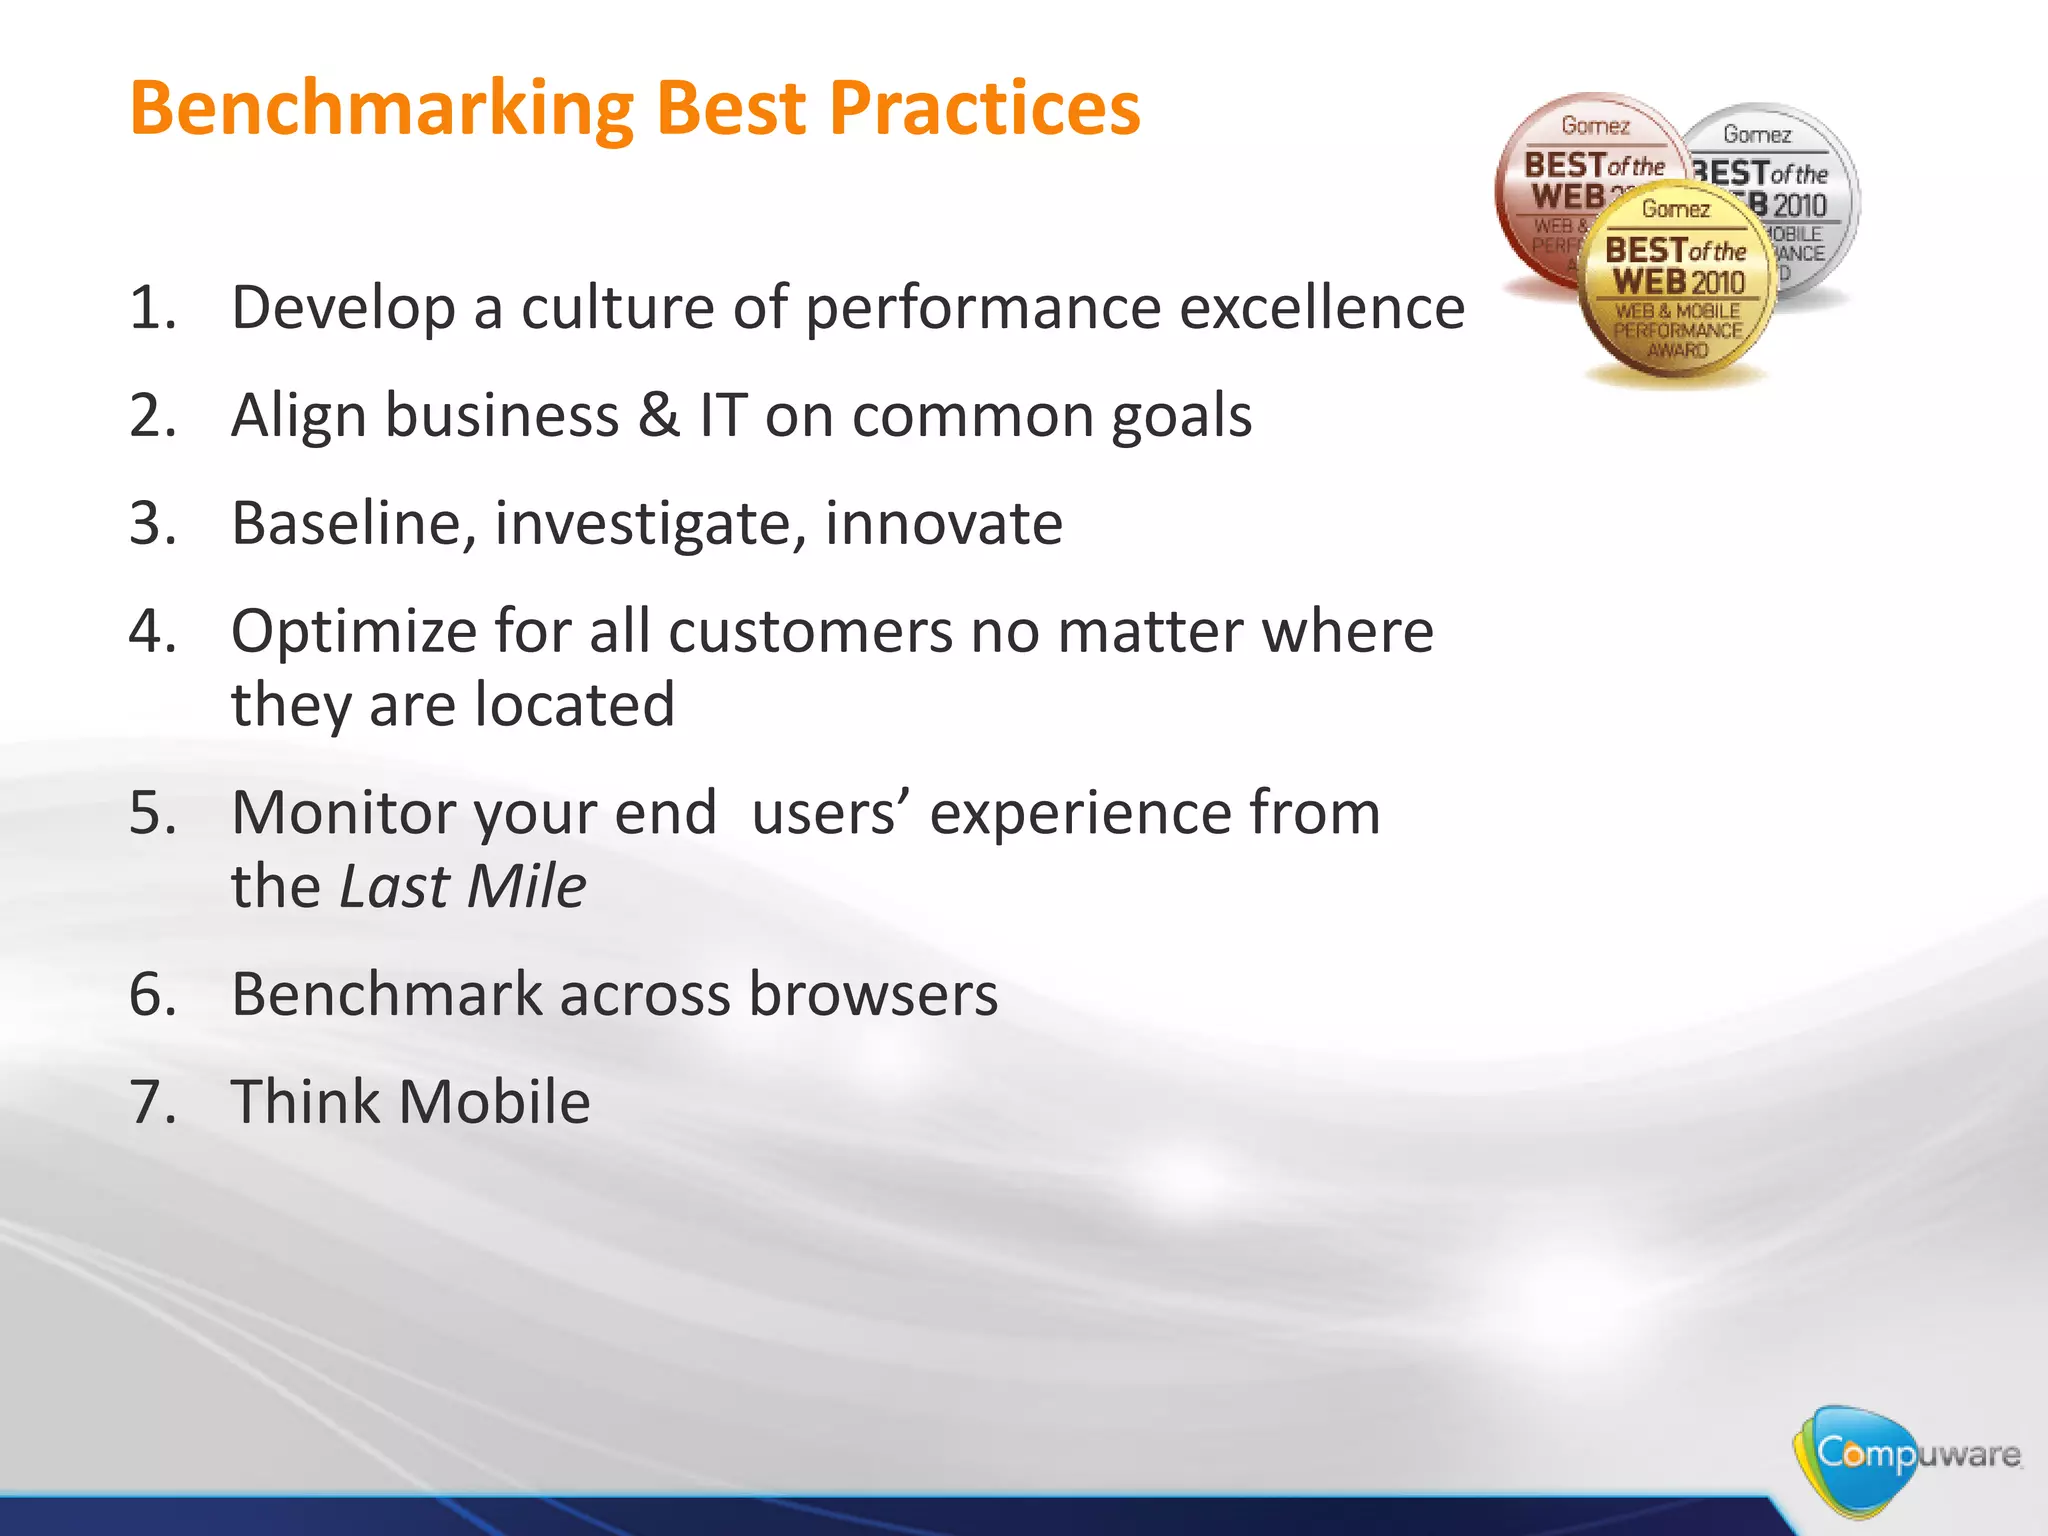
Matt Poepsel, VP Performance Strategies,
Compuware
Jonathan Ranger, Gomez Benchmarks Director,
Compuware
Agenda

• Why Web Performance Matters
• The Business Case for Benchmarking
• Announcing…the 2010 Winners!
• Winners’ Best Practices
Why Does Performance Matter?
           Everyone hates waiting.
Why Web Performance Matters: Customer
    Expectations
           40% of Consumers will abandon a site if made to wait
Consumer expectations for how                                         How long consumers will wait for a
quickly a web page should load                                        page to load before abandoning


  less than 1 second          5%                                                            1%
                                                                  less than 1 second

           1 second                12%                                                      2%
                                                                           1 second
          2 seconds                                 30%                                           10%
                                                                          2 seconds
          3 seconds                                   36%                                                 27%
                                                                          3 seconds
More than 4 seconds                      17%
                                                            More than 4 seconds                                         60%
                       0%   10%    20%        30%    40%
                                                                                       0%   20%     40%     60%   80%


                                          •    Lost revenues
                                          •    Increased costs
                                          •    Reduced customer satisfaction
                                          •    LOB dissatisfaction with IT

 “eCommerce Web Site Performance Today” white paper August 2009
Why Web Performance Matters: Customer
Expectations Growing
 “What are your expectations
  for how quickly a web site
        should load?”                                About online shoppers
seconds
5

4
                                                    79           %   who experience a dissatisfying visit are
                                                                     likely to no longer buy from that site


3

2
                                                    52%              stated that quick page loading is
                                                                     important to their site loyalty

                              50%


                                                    33
1                           reduction                                who abandoned a recent shopping
                                                      %              session were dissatisfied with site
0                                                                    performance
          2006               2009

“eCommerce Web Site Performance Today” white paper August 2009
Expectations for Mobile Experience = Web Experience
Why Performance Matters: Slow Websites Hurt
Business
     Average impact of 1 second delay in response time for Web users
                                                                    Customer
             Page Views                 Conversions                Satisfaction
    0%

   -2%

   -4%

   -6%

   -8%                                       -7%

   -10%

   -12%          -11%

   -14%
                          •   Lost revenues*
   -16%                   •   Brand damage
                          •   More support calls                          -16%
   -18%
                          •   Increase costs
                          •   LOB dissatisfaction with IT

          *Online business doing $100K/day = $2.5M/year in lost revenue
Poor Web/Mobile Performance Hurts Business
                                    Abandonment Rate Across 200+ Web Sites / 177+ Million Page


                       30
                                                                                                       Abandonment Rate
                                                                                                       - All Browsers
                       25
Abandonment Rate (%)


                                                                                                       Abandonment Rate
                       20                                                                              - iPhone Safari


                       15                                      • Slower pages = higher abandonment
                                                                    • Reduces revenue
                       10                                           • Increases costs
                                                                    • Damages brand
                       5


                       0
                            0   1    2   3   4    5    6   7    8    9   10   11   12   13   14   15

Source: Gomez real user monitoring
                                                 Page Load Time Band (sec.)
Search Conversion Rate increases 74% when page load
    time improves from 8 to 2 seconds


                                     5.85%   74%

                                                   3.36%


Source: Gomez real user monitoring
How fast is fast enough?
Benchmarking Provides Context

                                  Your homepage currently downloads in 5
                                    seconds on average.

                                                     How do you feel about that?

                                  Before some recent hardware upgrades, it
                                    downloaded in 7 seconds on average.

                                                           Now how do you feel?


                                  Your competitors’ homepages all download in 3
                                    seconds on average.

                                                           Now how do you feel?

   0      2      4     6      8             Context provides a basis for decision-
                                                       making and prioritization.
 Homepage Response Time in Seconds
How fast is fast enough?
Benchmarking can answer this
• Track performance
  against the best and
  your competition
• Baseline performance
  and track it over time
• Use benchmarks to
  measure success for IT
  and business
  stakeholders
And the 2010 winners are…
One Web Award
• Website Transaction Benchmark, Home Page from Internet Backbone
   on IE, Home Page on Last Mile, Mobile Site Performance
• Banking, Retail

Gold, Silver, Bronze Awards
• Best performance on Transaction or Home Page Benchmark
• All industries

Mobile Leader
• Best performance on home page across top four carrier /
  device combinations
• Banking, Retail, Travel

Most Improved
• Average Response Time higher than Benchmark Average
• Most Improved in the second half of 2010 vs. the first half
Banking
Brokerage
Airlines
Hotels
Winners’ Best Practices
A Culture of Performance Excellence


Cooperation Across Disciplines   Committed to Evaluation   Accept Change
Pervasive Strategy with Common Goals


 LOB                                    IT
  Top Line Revenue                      Cost Containment
  Customer                              Site Management
   Satisfaction                          Quality of Service


                          Goals
                       Profitability
                         Impact
Analysis In Context
      Baseline                Investigate          Innovate


                 Continually Assess vs. Baseline
Leaders vs. Laggards


Site      RT         AV

Leader     6.007     99.78

Laggard   24.589     93.70

BMK       15.453     93.54


Site      Consistency

Leader    < 20% variation

Laggard   > 25% variation

BMK       ~ 20% variation
Last Mile as a Complement to Backbone
Backbone Demographics
• Mirrored machines
• Select browsers
• Consistent ISPs
• 12 select locations
• Strong baselining


 Last Mile Demographics
 • End user machine
 • End user browser
 • End user ISP
 • End user locations
 • Real time end user
   comparisons
Optimize for your end users’ experience


                                             The Application Delivery Chain


                                                            Cloud                                                Customers
                                                      Private    Public                               Browsers
                                                                                             Local
  Data Center                                                                                 ISP
                                                                             3rd Party/
             Virtual/Physical Environment                                  Cloud Services
                 DB       App       Web        Load
Mainframe      Servers   Servers   Servers   Balancers             Major
                                                                    ISP
                                             Customer/user point of view
 Storage
                            Network                                          Content
                                                                             Delivery
                                                                             Networks
    Web              Mobile               WAN
  Services         Components          Optimization                                         Mobile
                                                                                            Carrier
                                                                                                      Devices
                                                      Employees                                                  Employees
Significant Performance Differences Across Browsers
                                     Load Time        Perceived Render
           25


           20


           15
 Seconds


           10


           5


           0


Source: Gomez Real-User Monitoring
   Real users around the world       466M pages over 30 days
   Broadband                         200+ sites
Think Mobile

• By end of 2011
  Nielsen expects
  more smartphones
  in U.S. than feature
  phones


• Keep the end
  users’ experience
  in mind
• Don’t sacrifice
  speed
Benchmarking Best Practices

1. Develop a culture of performance excellence
2. Align business & IT on common goals
3. Baseline, investigate, innovate
4. Optimize for all customers no matter where
   they are located
5. Monitor your end users’ experience from
   the Last Mile
6. Benchmark across browsers
7. Think Mobile
Q&A
                               Send questions via ‘chat’


                               Additional Resources

Full Report Mailed to Registrants                       Free Custom Benchmark
 Available on Gomez.com 3/21                    http://www.gomez.com/my-benchmark/

2010 Best of the Web Performers: What Makes Them Great?

  • 1.
    Matt Poepsel, VPPerformance Strategies, Compuware Jonathan Ranger, Gomez Benchmarks Director, Compuware
  • 2.
    Agenda • Why WebPerformance Matters • The Business Case for Benchmarking • Announcing…the 2010 Winners! • Winners’ Best Practices
  • 3.
    Why Does PerformanceMatter? Everyone hates waiting.
  • 4.
    Why Web PerformanceMatters: Customer Expectations 40% of Consumers will abandon a site if made to wait Consumer expectations for how How long consumers will wait for a quickly a web page should load page to load before abandoning less than 1 second 5% 1% less than 1 second 1 second 12% 2% 1 second 2 seconds 30% 10% 2 seconds 3 seconds 36% 27% 3 seconds More than 4 seconds 17% More than 4 seconds 60% 0% 10% 20% 30% 40% 0% 20% 40% 60% 80% • Lost revenues • Increased costs • Reduced customer satisfaction • LOB dissatisfaction with IT “eCommerce Web Site Performance Today” white paper August 2009
  • 5.
    Why Web PerformanceMatters: Customer Expectations Growing “What are your expectations for how quickly a web site should load?” About online shoppers seconds 5 4 79 % who experience a dissatisfying visit are likely to no longer buy from that site 3 2 52% stated that quick page loading is important to their site loyalty 50% 33 1 reduction who abandoned a recent shopping % session were dissatisfied with site 0 performance 2006 2009 “eCommerce Web Site Performance Today” white paper August 2009
  • 6.
    Expectations for MobileExperience = Web Experience
  • 7.
    Why Performance Matters:Slow Websites Hurt Business Average impact of 1 second delay in response time for Web users Customer Page Views Conversions Satisfaction 0% -2% -4% -6% -8% -7% -10% -12% -11% -14% • Lost revenues* -16% • Brand damage • More support calls -16% -18% • Increase costs • LOB dissatisfaction with IT *Online business doing $100K/day = $2.5M/year in lost revenue
  • 8.
    Poor Web/Mobile PerformanceHurts Business Abandonment Rate Across 200+ Web Sites / 177+ Million Page 30 Abandonment Rate - All Browsers 25 Abandonment Rate (%) Abandonment Rate 20 - iPhone Safari 15 • Slower pages = higher abandonment • Reduces revenue 10 • Increases costs • Damages brand 5 0 0 1 2 3 4 5 6 7 8 9 10 11 12 13 14 15 Source: Gomez real user monitoring Page Load Time Band (sec.)
  • 9.
    Search Conversion Rateincreases 74% when page load time improves from 8 to 2 seconds 5.85% 74% 3.36% Source: Gomez real user monitoring
  • 10.
    How fast isfast enough?
  • 11.
    Benchmarking Provides Context Your homepage currently downloads in 5 seconds on average. How do you feel about that? Before some recent hardware upgrades, it downloaded in 7 seconds on average. Now how do you feel? Your competitors’ homepages all download in 3 seconds on average. Now how do you feel? 0 2 4 6 8 Context provides a basis for decision- making and prioritization. Homepage Response Time in Seconds
  • 12.
    How fast isfast enough? Benchmarking can answer this • Track performance against the best and your competition • Baseline performance and track it over time • Use benchmarks to measure success for IT and business stakeholders
  • 13.
    And the 2010winners are…
  • 14.
    One Web Award •Website Transaction Benchmark, Home Page from Internet Backbone on IE, Home Page on Last Mile, Mobile Site Performance • Banking, Retail Gold, Silver, Bronze Awards • Best performance on Transaction or Home Page Benchmark • All industries Mobile Leader • Best performance on home page across top four carrier / device combinations • Banking, Retail, Travel Most Improved • Average Response Time higher than Benchmark Average • Most Improved in the second half of 2010 vs. the first half
  • 15.
  • 16.
  • 20.
  • 21.
  • 24.
  • 25.
    A Culture ofPerformance Excellence Cooperation Across Disciplines Committed to Evaluation Accept Change
  • 26.
    Pervasive Strategy withCommon Goals LOB IT  Top Line Revenue  Cost Containment  Customer  Site Management Satisfaction  Quality of Service Goals  Profitability  Impact
  • 27.
    Analysis In Context Baseline Investigate Innovate Continually Assess vs. Baseline
  • 28.
    Leaders vs. Laggards Site RT AV Leader 6.007 99.78 Laggard 24.589 93.70 BMK 15.453 93.54 Site Consistency Leader < 20% variation Laggard > 25% variation BMK ~ 20% variation
  • 29.
    Last Mile asa Complement to Backbone Backbone Demographics • Mirrored machines • Select browsers • Consistent ISPs • 12 select locations • Strong baselining Last Mile Demographics • End user machine • End user browser • End user ISP • End user locations • Real time end user comparisons
  • 30.
    Optimize for yourend users’ experience The Application Delivery Chain Cloud Customers Private Public Browsers Local Data Center ISP 3rd Party/ Virtual/Physical Environment Cloud Services DB App Web Load Mainframe Servers Servers Servers Balancers Major ISP Customer/user point of view Storage Network Content Delivery Networks Web Mobile WAN Services Components Optimization Mobile Carrier Devices Employees Employees
  • 31.
    Significant Performance DifferencesAcross Browsers Load Time Perceived Render 25 20 15 Seconds 10 5 0 Source: Gomez Real-User Monitoring Real users around the world 466M pages over 30 days Broadband 200+ sites
  • 32.
    Think Mobile • Byend of 2011 Nielsen expects more smartphones in U.S. than feature phones • Keep the end users’ experience in mind • Don’t sacrifice speed
  • 33.
    Benchmarking Best Practices 1.Develop a culture of performance excellence 2. Align business & IT on common goals 3. Baseline, investigate, innovate 4. Optimize for all customers no matter where they are located 5. Monitor your end users’ experience from the Last Mile 6. Benchmark across browsers 7. Think Mobile
  • 34.
    Q&A Send questions via ‘chat’ Additional Resources Full Report Mailed to Registrants Free Custom Benchmark Available on Gomez.com 3/21 http://www.gomez.com/my-benchmark/