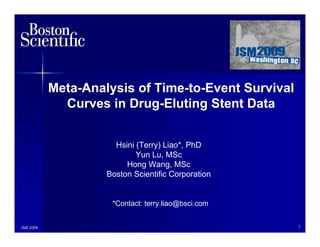
This document presents a meta-analysis of time-to-event survival curves in drug-eluting stent data, aimed at consolidating study outcomes and deriving statistical inferences. It discusses various methodologies, such as the log hazard ratio and different models for calculating hazard ratios, while also presenting a case study comparing diabetic and non-diabetic patients. The analysis covers challenges like patient-level versus study-level data, and future work involves addressing missing values and improving methodologies for survival data.


![(Current) Application to
Survival Curves
• Extract data from KM curves
• Estimate ln(HRij) and var[ln(HRij)] for each
study
• The HR is a summary of the difference
between two KM curves
• Consider time-to-event and censoring,
otherwise HR=RR
• Variety of scenarios (e.g. CI)
• MS Excel spreadsheet computation
JSM 2009 6](https://image.slidesharecdn.com/2009jsmmetasurvivalliao-12720560946369-phpapp01/85/2009-JSM-Meta-Time-to-Event-Data-6-320.jpg)

![Application to Survival Curves
(Cont’d)
• Formal definition of the log hazard ratio
• Reported number of observed events and
number of expected events:
For each study i and each time j,
OTij / ETij
ln( HRij ) = ln( )
OCij / ECij
1 1
var[ln(HRij )] = +
ETij ECij
JSM 2009 8](https://image.slidesharecdn.com/2009jsmmetasurvivalliao-12720560946369-phpapp01/85/2009-JSM-Meta-Time-to-Event-Data-8-320.jpg)
![Application to Survival Curves
(Cont’d)
For each study i=1,…,K and each time point j,
K
∑ var[ln(HR )]
ln( HRij )
ij
ln( HR⋅ j ) = i =1
K
∑i =1
1
var[ln(HRij )]
−1
⎡ K ⎤
var[ln(HR⋅ j )] = ⎢
⎢ ∑
⎢ i =1
1 ⎥
var[ln(HRij )] ⎥
⎥
⎣ ⎦
JSM 2009 9](https://image.slidesharecdn.com/2009jsmmetasurvivalliao-12720560946369-phpapp01/85/2009-JSM-Meta-Time-to-Event-Data-9-320.jpg)

![Method 1: Proposed
(Overall Observed and Expected Events)
• For each study i, compute the sum of observed
events (OTi., OCi.) and the sum of expected events
(ETi., ECi.) across all time points
• Use the formal definition of the log hazard ratio
OTi⋅ / ETi⋅
ln( HRi⋅ ) = ln( )
OCi⋅ / ECi⋅
1 1
var[ln(HRi⋅ )] = +
ETi⋅ ECi⋅
JSM 2009 11](https://image.slidesharecdn.com/2009jsmmetasurvivalliao-12720560946369-phpapp01/85/2009-JSM-Meta-Time-to-Event-Data-11-320.jpg)
![Method 2: Parmar
(Observed and Expected Events)
• For each study i, compute log(HR) and associated
variance for each time point with observed events
(OTij, OCij) and expected events (ETij, ECij)
• Calculate the weighted mean of log(HR) across time
points for each study i
OTij / ETij
ln( HRij ) = ln( )
OCij / ECij
1 1
var[ln(HRij )] = +
ETij ECij
JSM 2009 12](https://image.slidesharecdn.com/2009jsmmetasurvivalliao-12720560946369-phpapp01/85/2009-JSM-Meta-Time-to-Event-Data-12-320.jpg)
![Method 3: Williamson
(Observed Events and #Patient-At-Risk)
• For each study i, compute log(HR) and associated
variance for each time point with the observed
events (OTij, OCij) and #patient-at-risk (NTij, NCij)
• Calculate the weighted mean of log(HR) across
time points for each study i
OTij / NTij
ln( HRij ) = ln( )
OCij / NCij
1 1 1 1
var[ln(HRij )] = − + −
OTij NTij OCij NCij
JSM 2009 13](https://image.slidesharecdn.com/2009jsmmetasurvivalliao-12720560946369-phpapp01/85/2009-JSM-Meta-Time-to-Event-Data-13-320.jpg)

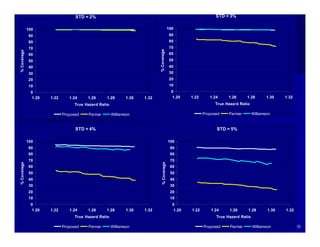
![Comparison of Estimates for
Overall HR
Fixed Effect Model Random Effects Model
HR [95% CI] HR [95% CI]
Method1
1.31 [1.03, 1.67] 1.34 [0.99, 1.81]
(Proposed)
Method 2
1.31 [1.03, 1.66] 1.46 [0.90, 2.37]
(Parmar)
Method 3
1.31 [1.04, 1.67] 1.33 [1.02, 1.75]
(Williamson)
Cox Model in
1.32 [1.03, 1.67] 1.33 [0.98, 1.82]
IPD
JSM 2009
IPD = Individual Patient Data 16](https://image.slidesharecdn.com/2009jsmmetasurvivalliao-12720560946369-phpapp01/85/2009-JSM-Meta-Time-to-Event-Data-16-320.jpg)