Download to read offline

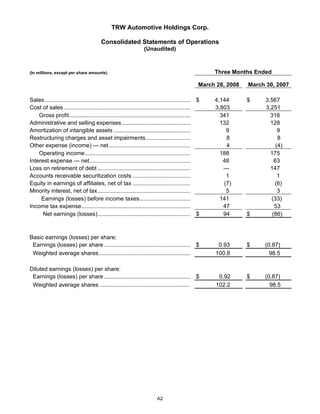


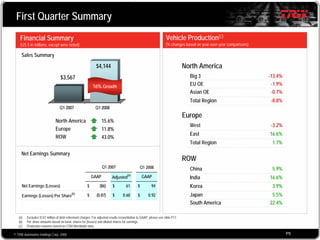


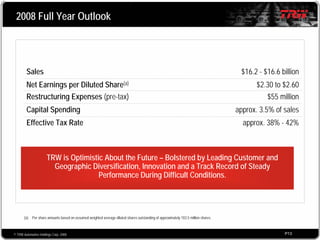

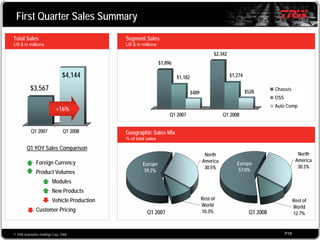
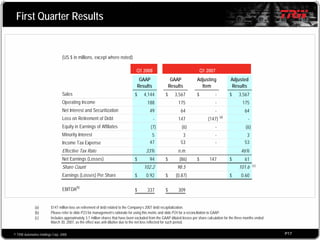
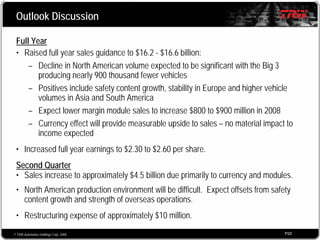


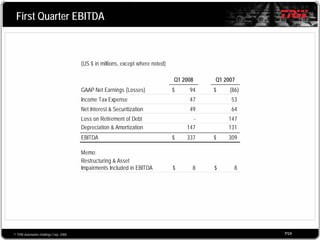
TRW Automotive Holdings Corp. reported first quarter 2008 financial results with sales of $4.1 billion, a 16.2% increase over the same period in 2007. Net earnings were $94 million or $0.92 per diluted share, compared to a net loss of $86 million or $0.87 per share in 2007. The company increased its full year 2008 sales outlook to a range of $16.2 to $16.6 billion and net earnings per share outlook to a range of $2.30 to $2.60.


