Download as PDF, PPTX

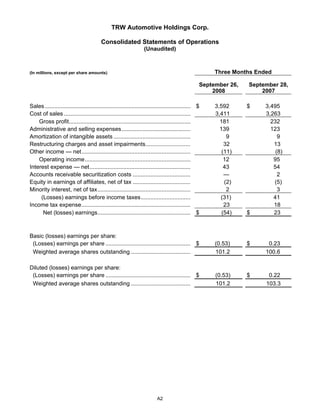
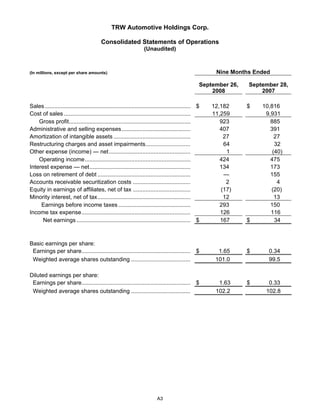
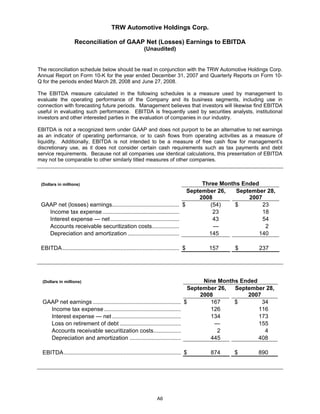
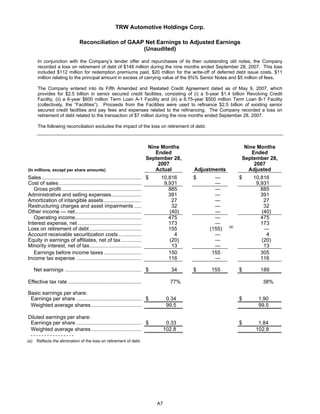


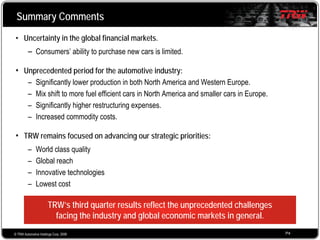
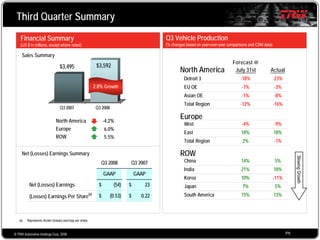
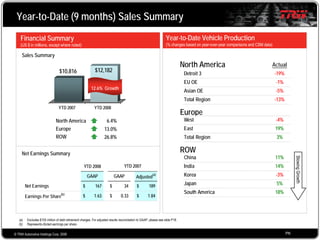


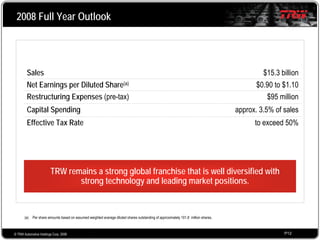

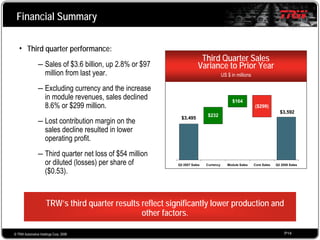
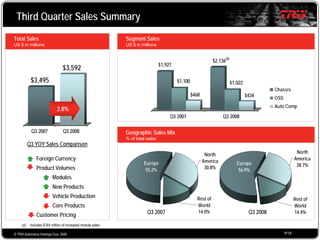
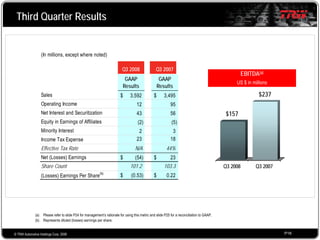
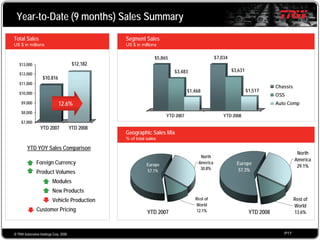
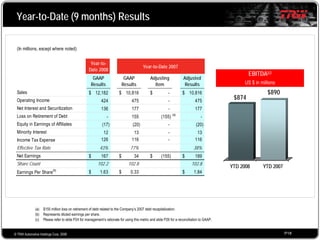
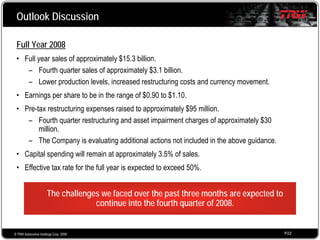

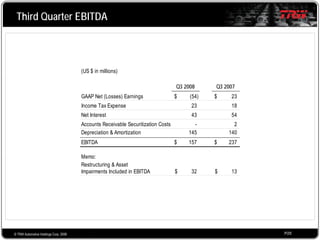
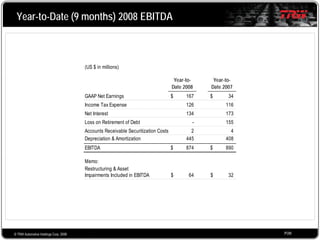
TRW Automotive reported third quarter 2008 financial results with sales of $3.6 billion, up 2.8% from the prior year. However, the company reported a net loss of $54 million compared to net earnings of $23 million in the prior year. Sales increased due to currency movements and module sales, but core product sales declined sharply, driving the earnings decrease. For 2008, TRW expects sales of $15.3 billion and net earnings per share of $0.90 to $1.10, reflecting challenges in the automotive industry.


