Download to read offline


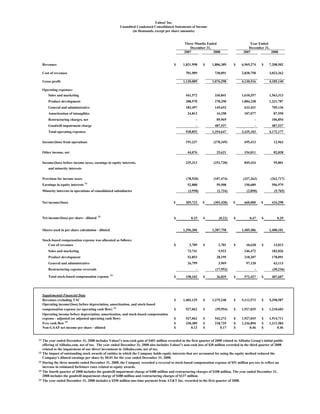


Yahoo reported financial results for Q4 2008 and full year 2008. Revenues for Q4 2008 were $1.8 billion, a 1% decrease from the prior year. For the full year, revenues were $7.2 billion, a 3% increase. The company reported a Q4 operating loss of $278 million compared to operating income of $191 million in the prior year. However, adjusted for restructuring and other charges, operating income was $542 million for Q4 2008. Yahoo also saw declines in cash flow from operating activities but ended the year with $3.5 billion in cash and marketable securities.


