SlideShare a Scribd company logo
10.1177/1094428103257364ARTICLEORGANIZATIONAL RESEARCH METHODSGelade, Gilbert / DATA ENVELOPMENT ANALYSIS
Work Climate and Organizational Effectiveness:
The Application of Data Envelopment Analysis in
Organizational Research
GARRY GELADE
Business Analytic Ltd., London
PATRICK GILBERT
International Survey Research, London
Previous research examining the climate-effectiveness relationship in organiza-
tions has largely failed to take due note of the complex multidimensional nature of
organizational effectiveness. This article describes the data envelopment analysis
(DEA) technique for evaluating the relative efficiencies of organizations that con-
sume multiple inputs and produce multiple outputs and demonstrates its applica-
tion to organizational research. The use of DEA is illustrated by calculating the
relative efficiencies of the branch offices in a retail banking network, and it is
shown that measures of efficiency calculated using the DEA method correlate sig-
nificantly with organizational climate as measured by employee’s perceptions of
operational and management practices. It is suggested that researchers studying
the relationship between organizational effectiveness and the psychology of the
workplace should consider using DEA, especially when multiple dimensions of ef-
fectiveness are involved.
Keywords: data envelopment analysis; DEA; efficiency; organizational effec-
tiveness; organizational climate
As West, Smith, Feng, and Lawthom (1998) noted, evidence for the relationship
between organizational climate and organizational effectiveness is currently some-
what limited. Nevertheless, a number of studies conducted in the past 20 years have
shown links between climate, or other job-related attitudes, and performance at the
organizational and organizational subunit level (e.g., Abbey & Dickson, 1983;
Authors’Note: The authors gratefully acknowledge the comments of Larry J. Williams and two anony-
mous referees on the first draft of this article. Correspondence may be addressed to Garry Gelade, Business
Analytic Ltd, 1, Circus Lodge, Circus Road, London NW8 9JL, UK, or email garry@business-ana-
lytic.co.uk. Patrick Gilbert is now at Mercer Human Resource Consulting, Dexter House, 2 Royal Mint
Court, London, EC3N 4NA, UK.
Organizational Research Methods, Vol. 6 No. 4, October 2003 482-501
DOI: 10.1177/1094428103257364
© 2003 Sage Publications
482
at Universitas Gadjah Mada on June 14, 2015orm.sagepub.comDownloaded from
Denison, 1990; Kwok, 1997; Ostroff, 1992; Ryan, Schmit, & Johnson, 1996; West et al.,
1998).
In most of these studies, climate is implicitly or explicitly regarded as the independ-
ent variable and effectiveness as the outcome. Our interest in this article, however,
focuses not on the issue of causality or direction of influence but rather on how the
dependent variable, effectiveness, is measured. We suggest that previous research in
this area has generally failed to recognize that organizational effectiveness is a multidi-
mensional variable, the facets of which are interdependent and cannot be adequately
assessed in isolation.
We are primarily concerned here with the performance and effectiveness of organi-
zations (or organizational subunits) rather than of individuals; nevertheless, the proce-
dures described in this article are equally applicable to evaluating the effectiveness of
groups and individuals. To preserve consistency, we shall refer to the unit of analysis as
a “production unit.” Depending on the circumstances, a production unit may be an
organization, a group, or an individual. Each of the production units in a given analysis
is assumed to use a common set of inputs and produce a common set of outputs but in
potentially different amounts.
Perhaps the most widely used measure of production unit performance is effi-
ciency, usually expressed as the ratio of the amount of output produced to the amount
of input (resource) consumed. In practice, however, production units usually consume
multiple inputs and produce multiple outputs, and more than one efficiency ratio needs
to be measured to give a full picture of a unit’s effectiveness. The efficiency of a restau-
rant, for example, might be measured by the number of customers served per waiter,
revenue per square foot, controllable expenses as a percentage of sales, and so on.
It is unlikely, however, that in any given sample of restaurants, these different effi-
ciency measures will all give rise to the same rank ordering of units. This poses a prob-
lem to organizational researchers studying climate-effectiveness relationships
because the observed correlations are likely to be different for each performance indi-
cator studied. For example, Ryan et al.’s (1996) study used eight indicators of
employee attitude and 12 business performance indicators (customer satisfaction, staff
turnover, and 10 productivity measures). In their main analysis, a single latent variable
was constructed to represent employee attitudes, and this was used in 12 separate
structural equation models, 1 for each performance indicator.
However, conducting multiple separate analyses is vulnerable to capitalization on
chance and consequent Type I error. Furthermore, differing results for each indicator
may introduce problems of interpretation requiring post hoc explanation. Such diffi-
culties are evident in (and acknowledged by) Ryan et al. (1996). For example, of their
10 productivity indicator models, only the model developed for 30-day delinquency
showed a significant cross-lagged correlation between attitude and performance; the
other 9 productivity models, including that for 60-day delinquency, did not show this
pattern.
A further difficulty with separate analyses is that each performance indicator repre-
sents only one aspect of effectiveness; because of finite limitations on resources, the
various aspects of effectiveness are unlikely to be independent, making it difficult to
draw conclusions about the overall relationship between climate (or other psychologi-
cal variables) and effectiveness. This problem can be acute when production units use
different production strategies. For example, Production Unit A may use its inputs to
Gelade, Gilbert / DATA ENVELOPMENT ANALYSIS 483
at Universitas Gadjah Mada on June 14, 2015orm.sagepub.comDownloaded from
maximize one subset of outputs (O1) at the expense of the rest (O2), whereas Produc-
tion Unit B may direct its resources to maximizing O2 at the expense of O1. Hence, cor-
relations between climate and individual performance indicators may not be easily
interpretable.
One approach to overcoming these difficulties is to use a single measure of produc-
tive efficiency that encapsulates all the aspects of performance that are deemed rele-
vant to the study at hand. This single indicator can then be used as the dependent (or
independent) variable of the study.
The most obvious way to construct such an indicator is to divide, for each produc-
tion unit, a weighted sum of the outputs by a weighted sum of the inputs. In practice,
however, this approach has the serious drawback that it requires an a priori decision to
be made about how each input and each output should be weighted. In some cases, it
may be advisable to generate a weighting scheme by referring all the inputs and out-
puts to a common base such as market cost price, but this is not always advisable or
practical. Consider, for example, the problem of constructing an overall efficiency
measure for university departments whose main products are student degrees and
research papers. Although various schemes might be proposed for weighting these two
outputs, it is difficult to see how any one scheme could be demonstrated to be uniquely
correct; and the observed correlation between climate and performance would vary
depending on the particular weighting scheme adopted. Two researchers using the
same raw data might thus reach differing conclusions.
Charnes, Cooper, and Rhodes (1978) introduced a method for deriving the relative
efficiencies of multiple-input multiple-output production units, which they called data
envelopment analysis (DEA). The DEA technique combines multiple input and output
measures to produce a single efficiency measure for each production unit in the analy-
sis. DEA does not require the analyst to devise a weighting scheme and hence avoids
the subjectivity associated with simpler forms of consolidation. Furthermore, each
production unit is assigned its own unique weighting scheme, thus avoiding the prob-
lems that occur when different units in the sample, perhaps operating under different
external constraints, adopt different production strategies.
Although DEA was explicitly formulated to measure efficiencies in the nonprofit
sector, where inputs and outputs cannot easily be expressed using a single scale of eco-
nomic value, the power and flexibility of the DEA approach has led to its widespread
adoption in the commercial sector too. DEA has been used to study efficiency in, for
example, the steel industry (e.g., Ray & Kim, 1995), retailing (e.g., Athanassopoulos,
1995), air transport (e.g., Chan & Sueyoshi, 1991; Ray & Hu, 1997), electricity distri-
bution (e.g., Miliotis, 1992), education (e.g., Bessent & Bessent, 1980; Sarrico &
Dyson, 2000; Thanassoulis, 1996; Thanassoulis & Dunstan, 1994), banking (e.g.,
Drake & Howcroft, 1994; Soteriou & Stavrinides, 1997), software engineering and
information technology (e.g., Banker & Kemerer, 1989; Lee & Menon, 2000), and
health care (e.g., Banker, Conrad, & Strauss, 1986; Chirikos & Sear, 2000). For further
examples, the reader is referred to the catalogues of Seiford (1997); Cooper, Seiford,
and Tone (1999); and Emrouznejad (2001).
In organizational research, DEA has been used to investigate the dependence of
organizational effectiveness on, for example, ownership and control structures and
organizational form (e.g., Brockett, Cooper, Golden, Rousseau, & Wang, 1998; But-
ton & Weyman-Jones, 1992; Daft & Lewin, 1990; Day, Lewin, & Li, 1995; Ferrantino,
484 ORGANIZATIONAL RESEARCH METHODS
at Universitas Gadjah Mada on June 14, 2015orm.sagepub.comDownloaded from
Ferrier, & Linvill, 1995; Lewin & Minton, 1986; Tankersley, 1990). However, despite
the potential relevance of DEA to the psychology of work, organizational behavior
researchers and occupational psychologists seem largely to have ignored or dis-
counted the technique. A search of PsycINFO uncovered only three articles applying
DEA (Bhargava, Dubelaar, & Ramaswami, 1994; Boles, Donthu, & Lohtia, 1995;
Chebat, Filiatrault, Katz, & Tal, 1994); none of these were published in an organiza-
tional or occupational psychology journal.
The purpose of this article is to describe how DEA works and to illustrate its rele-
vance to the psychology of organizational effectiveness. First, we provide an introduc-
tion to the principles of DEA and give an illustrative example of efficiency evaluation.
Next, we develop climate measures for two retail banks. We then use DEA to develop
efficiency scores for the two banks, and finally, we examine the relationships between
climate and the DEA efficiency measures.
The Principles of DEA
Since its introduction by Charnes, Cooper, and Rhodes (1978, 1981), DEA has
received considerable theoretical attention and undergone much methodological
enhancement. This section is restricted to describing the fundamentals of DEA in a
nontechnical manner; the reader is referred to the excellent chapters on DEA in Coelli,
Rao, and Battese (1998) for a more detailed and rigorous treatment of the basic
concepts.
To illustrate the principles of the DEA model, consider the performance statistics of
players on the USA Professional Golfers Association (PGA) 2002 tour. To be success-
ful, a golfer must, among other things, be able to hit the ball a long way (driving dis-
tance) and land it accurately on the fairway (driving accuracy). In the PGA statistics,
driving distance is the average number of yards per drive, measured on two holes per
round in opposite directions to counteract the effects of wind. Drives are measured to
the point they come to rest regardless of whether they are in the fairway. Driving accu-
racy is the percent of time a player is able to hit the fairway with his tee shot. For the
200 players listed on the PGA’s Web site, the correlation between driving distance and
driving accuracy is –.49 (p < .01).
Table 1 shows the statistics for the five players with the longest driving distance (big
hitters) and the five with the highest driving accuracy (sharp shooters) and for two
average players.
The efficiency ratios in data Columns 3 and 6 of Table 1 illustrate why ranking is
nontrivial when there are multiple indicators of performance. Daly is clearly the big-
gest hitter but ranks next to bottom on accuracy; Funk, on the other hand, is the sharp-
est shooter but ranks only sixth on distance. Woods, a middling (!) performer on both
measures, outperforms both Daly on accuracy and Funk on distance. The differing
production strategies of the players result in a negative correlation between the two
efficiency measures, driving distance and driving accuracy.
A major advantage of DEA is that it enables this type of multidimensional perfor-
mance data to be ordered along a single continuum of efficiency without requiring any
a priori weighting assumptions. In the general case, DEA efficiencies are estimated by
linear programming, but for the two efficiency ratios of our example, the principle of
the method can be illustrated graphically.
Gelade, Gilbert / DATA ENVELOPMENT ANALYSIS 485
at Universitas Gadjah Mada on June 14, 2015orm.sagepub.comDownloaded from
First, the driving distance and driving accuracy for each player are plotted against
each other, and a segmented boundary line or “efficient frontier” is drawn to envelop
the data and projected onto the axes (see Figure 1).
Mathematically, the efficient frontier is the convex hull of the data (Farrell, 1957)
and defines the limits of the production process in the data sample, that is, all the feasi-
ble input-output combinations evident from the data points under consideration. The
horizontal and vertical segments of the efficiency frontier represent the economic
assumption of “strong disposability.” Under strong disposability, a production unit can
always dispose of unwanted outputs without incurring costs. Thus, the perpendicular
line drawn from Daly to the x-axis represents the assumption that if Daly can drive
303.6 yards and hit the fairway 58.7% of the time, he can also drive 303.6 yards with-
out hitting the fairway at all. A similar argument holds for the horizontal line drawn
from Funk to the y-axis. (The data provide no evidence for or against the conjecture
that either golfer could increase his performance on one measure by reducing his per-
formance on another.)
Existing units lying on the efficient frontier (in this case, Daly, Woods, and Funk),
or hypothetical units that would lie on the frontier if they existed, are given an effi-
ciency of 1. It is clear why Daly is efficient: He is a top performer with respect to one of
the two ratios under consideration. However, it is not necessary to be a top performer
on any one measure to be efficient under DEA; Woods is 100% efficient without top-
ping either the distance or accuracy figures. All the units lying within the frontier are
less than totally efficient. It should be noted in this context that DEA does not address
efficiency in any absolute sense, because the true limits of production are unknown. If
it could be drawn, however, the true efficiency frontier would lie to the right of the sam-
ple frontier. The sample frontier thus represents a lower bound of efficient perfor-
mance based on the evidence to hand; addition of new data could in theory bring the
486 ORGANIZATIONAL RESEARCH METHODS
Table 1
Performance Figures of Selected Professional Golfers’ Association Golfers
Number Total Driving
of Distance Driving Possible Fairways Accuracy
Player Rounds Drives (yards) Distance Fairways Hit %
Big hitters
John Daly 53 100 30,358 303.6 712 418 58.7
Mathew Goggin 48 96 28,595 297.9 667 411 61.6
Tiger Woods 56 104 30,717 295.4 731 500 68.4
Boo Weekley 43 86 25,399 295.3 599 409 68.3
Dennis Paulson 69 136 40,151 295.2 962 564 58.6
Sharp shooters
Fred Funk 88 174 47,714 274.2 1,230 991 80.6
Jim Furyk 64 123 33,524 272.6 871 674 77.4
Fulton Allem 51 102 27,202 266.7 713 552 77.4
Scott Verplank 75 140 37,331 266.7 996 769 77.2
Heath Slocum 72 142 38,180 268.9 1,003 773 77.1
Average players
Jose Maria Olazabal 54 104 28,275 271.9 727 432 59.4
Esteban Toledo 85 159 41,952 263.8 1,131 796 70.4
at Universitas Gadjah Mada on June 14, 2015orm.sagepub.comDownloaded from
sample boundary closer to the true boundary, in which case further inefficiencies
would appear. In an organizational context, DEA can thus be seen as a technique for
determining relative levels of efficiency within a finite sample, based on benchmarks
of existing best practice.
For the purposes of clarifying the geometrical interpretation of DEA, Figure 2
shows a simplified version of the data. One difference between the players evident
from Figure 2 is that each favors a different performance mix m, defined as the ratio of
distance to accuracy; Daly (m = 5.2) goes for distance rather than accuracy, Funk and
Toledo place more emphasis on hitting the fairway than on distance (m = 3.4 and 3.7,
respectively), whereas Woods (m = 4.3) and Olazabel (m = 4.6) have, by comparison, a
balanced strategy. The geometry of Figure 2 implies that all hypothetical golfers that
lie on the line from the origin through Olazabel would also have a performance mix of
4.6. Thus, by projecting a line (OV) from the origin through Olazabel to the frontier,
we can construct a virtual golfer (V) that were he to exist would have the same balance
between distance and accuracy as Olazabel but would have an efficiency of 1. The
driving distance of this virtual golfer can be determined by dropping a line from V to
the x-axis, which produces a value of 298 yards. Similarly, by projecting horizontally
Gelade, Gilbert / DATA ENVELOPMENT ANALYSIS 487
Figure 1: Efficient Frontier for Professional Golfers’ Association Golfers
at Universitas Gadjah Mada on June 14, 2015orm.sagepub.comDownloaded from
from V to the y-axis, we find V’s driving accuracy to be 65%. In DEA studies, V’s per-
formance figures are referred to Olazabel’s “targets.”
Dividing Olazabel’s driving distance by V’s driving distance (or dividing his driv-
ing accuracy by V’s driving accuracy) yields the same value, to within rounding error,
of 0.91. In DEA terminology, this value is known as Olazabel’s “technical efficiency”
(TE).
It is apparent from Figure 2 that the radial projections for Olazabel and Toledo fall
within different segments of the frontier. In DEA terminology, players Olazabel and
Toledo are said to have different “peers.” The peers for Olazabel are Woods and Daly
and the peers for Toledo are Woods and Funk. The virtual efficient players with which
Olazabel and Toledo are compared (V and V′, respectively) are linear combinations of
their relevant peers; this means we can express the target for an inefficient player by
identifying his peers and specifying their weightings. Thus, if the performance of
Olazabel’s peers are represented, respectively, by the column vectors p1 and p2 then
Olazabel’s target t can be written: t = w1 × p1 + w2 × p2, where w1 and w2 are peer
weights.
488 ORGANIZATIONAL RESEARCH METHODS
Figure 2: Determining Efficiencies of Inefficient Golfers
at Universitas Gadjah Mada on June 14, 2015orm.sagepub.comDownloaded from
For the golfing data, it can be shown that Olazabel’s peer weights are .66 (Woods)
and .34 (Daly). (That is, V’s driving distance can be expressed as .66 × 295.4 + .34 ×
303.6 = 298 yards, and V’s driving accuracy can be expressed as .66 × 68.4 + .34 × 58.7
= 65%). Similarly, Toledo’s peer weights are .42 (Woods) and .58 (Funk). In a complex
efficiency evaluation, identifying the peers and the peer weights of an inefficient unit is
often of practical importance, allowing relevant examples of best practice to be identi-
fied and providing clues to sources of inefficiency and tactics for improvement.
For analyses involving more than two dimensions of performance, efficiency esti-
mates are calculated by linear programming methods. These are described next.
In DEA terminology, a production unit is called a decision-making unit (DMU).
Following Coelli, Rao, and Battese (1998, p. 140) let each of N DMUs consume K
inputs and produce M outputs and let xi and yi be column vectors representing, respec-
tively, the inputs and outputs for the ith DMU. Let v be a K × 1 vector of input weights,
and u be an M × 1 vector of input weights. Then the efficiency Ei of the ith DMU can be
written as follows:
Ei = u′yi/v′xi .
In the DEA model, weights for the ith DMU are chosen to maximize its efficiency,
subject to the restriction that no other DMU in the evaluation sample using the same
weights would have an efficiency greater than one. This allows each DMU to have a
unique set of weights—those under which its efficiency is maximized—and avoids the
problem of enforcing a common set of weights on all the DMUs. This leads to the fol-
lowing fractional program for the ith DMU:
Maxu, v
(u′yi
/v′xi
),
Subject to u′yj
/v′xj
≤ 1, j = 1, 2 . . . N
u, v ≥ 0. For all u in u, all v in v.
This program is not solvable but can be made so by noting that in maximizing the
objective function, it is the ratio of the numerator and the denominator that matters and
not their individual values. By constraining the denominator to a fixed quantity (e.g.,
1) and maximizing the numerator, we achieve the same effect. This is the standard
Charnes-Cooper transformation of Linear fraction programming (Charnes & Cooper,
1962) and leads to the following, solvable, linear programming formulation:
Maxu
, vu′yi
,
Subject to Bv′xi
= 1,
u′yj
– v′xj
≤ 0, j = 1, 2 . . . N
u, v ≥ 0. For all u in u, all v in v.
It is important to see that the efficiency evaluation requires solving N linear pro-
grams, one for each DMU in the data set. If the efficiency of a DMU turns out to be 1, it
isontheefficientfrontier;ifitturnsouttobelessthan1,itistosomedegreeinefficient.
A computer program designed to calculate DEA efficiencies using linear program-
ming (DEAP) (Coelli, 1996) was used to process the data in Table 1. The input was the
Gelade, Gilbert / DATA ENVELOPMENT ANALYSIS 489
at Universitas Gadjah Mada on June 14, 2015orm.sagepub.comDownloaded from
number of rounds, and the outputs were the expected total distance based on the driv-
ing distance assuming 18 drives per round and the expected total number of fairways
hit, based on 18 fairways per round. The results are shown in Table 2. For ease of com-
parison with Table 1, the targets produced by DEAP for the total distance and the total
fairways hit have been converted back into an average driving distance and a percent-
age accuracy.
As would be expected from the preceding discussion, Funk, Woods, and Daly turn
out to be the only fully efficient players. Note that because the data in Table 2 were
derived from total driving and fairway scores rather than averages, the peer weights
differ from those derived for Figure 2. (To derive the weights for the total scores, the
weights for the average scores are multiplied by the ratio of rounds played by each
player, e.g., for Toledo, the peer weight for Woods is .42 × 85/56 = .64.)
So far, efficiencies have been treated on the assumption that inputs and outputs are
linearly related, which is known as the “constant returns to scale” (CRS) assumption.
In practice, this assumption may not be realistic; economies of scale may confer opera-
tional advantages on large DMUs, or alternatively, the converse may be true and dis-
economies of scale may give the advantage to small DMUs. In such cases, it may be
desirable to separate technical efficiency from efficiency (or inefficiency) that is
purely attributable to the scale of operation. The variable returns to scale (VRS) model
developed by Banker, Charnes, and Cooper (1984) achieves this; in this formulation,
an additional constraint is added to the CRS linear program, which ensures that each
DMU is compared only with DMUs of similar size. In the VRS formulation, the scale
effect for a DMU may be in one of two directions; a DMU for which increasing inputs
would result in a proportionally greater increase in outputs is said to be operating under
“increasing returns to scale,” and a DMU for which increasing inputs would result in a
proportionally smaller increase in outputs is said to be operating under “decreasing
returns to scale.” Under the VRS model, technical efficiency (TE) is regarded as the
product of two components, the ‘pure’ technical efficiency (PTE) and the scale effi-
ciency (SE); that is, TE = PTE × SE. VRS is currently the most popular form of DEA
(Coelli et al., 1998).
490 ORGANIZATIONAL RESEARCH METHODS
Table 2
Data Envelopment Analysis Efficiencies of
Selected Professional Golfers’ Association Golfers
Peer Weight
Technical
Targets
Player Funk Woods Daly Efficiency (%) Distance Accuracy
Fred Funk 1.00 1.000 274.2 80.6
Jim Furyk .62 .17 .983 277.4 78.8
Fulton Allem .55 .05 .968 275.4 79.9
Scott Verplank .80 .09 .968 275.6 79.8
Heath Slocum .73 .14 .973 276.5 79.3
Esteban Toledo .56 .64 .932 283.0 75.5
Tiger Woods 1.00 1.000 295.4 68.4
Boo Weekley .76 .01 .999 295.5 68.3
Mathew Goggin .31 .58 .991 300.7 62.2
Jose Maria Olazabal .64 .34 .912 298.2 65.1
John Daly 1.00 1.000 303.6 58.7
Dennis Paulson .17 1.12 .976 302.5 60.0
at Universitas Gadjah Mada on June 14, 2015orm.sagepub.comDownloaded from
Second, we have also assumed that the purpose of the efficiency evaluation is to
understand the potential for maximizing the outputs from a given quantity of inputs
(output-oriented DEA). The alternative characterization (input-oriented DEA) is
focused on decreasing inputs while maintaining a constant level of outputs; typical
applications of input-oriented DEA are cost reduction and downsizing. In the CRS
model, these orientations lead to the same numerical efficiencies, but under the VRS
assumption, input-oriented and output-oriented efficiencies may differ.
In practical situations, efficiencies may be affected by environmental variables that
are not under the control of the production unit and that cannot be treated like conven-
tional inputs. For example, a bank branch might be located in a city center, a small
town, or a rural area, placing different constraints on the maximum efficiency attain-
able. Coelli et al. (1998, p. 166) have discussed various methods for accommodating
such variables in a DEA analysis and recommended a two-stage method. In the first
stage, a conventional DEA analysis is conducted, omitting the environmental vari-
ables, and in the second stage, the efficiency scores are regressed on to the environ-
mental variables. The influence of the environmental variables can be assessed by
means of a conventional significance test and, if necessary, the efficiency scores
adjusted in the light of the regression equation.
Limitations of space preclude discussion here of the many refinements to the basic
DEA model that have been suggested in the literature and topics such as weighting
restrictions and allocative and price efficiencies. Charnes, Cooper, Lewin, and Seiford
(1995) presented an introduction and overview of the field, and Seiford’s (1996)
review discusses more advanced models. The most comprehensive introductory treat-
ment for the student, researcher, and practitioner is the text by Cooper et al. (1999),
which comes packaged with a DEA computer program and contains an extensive DEA
bibliography.
It is important to briefly mention some of the limitations of DEA. First, DEA is sen-
sitive to outliers and to measurement error, which may influence the shape of the effi-
cient frontier, and second, the more inputs and outputs in the model, the more DMUs
will emerge on the frontier; this places a lower limit on the sample size for an effective
DEA analysis.
Because the production frontier in DEA is specified without any parametric struc-
ture for the distribution of deviations, the statistical properties of its estimators cannot
be defined using standard methods. Some organizational psychologists have therefore
tended to dismiss DEA on the grounds that it lacks procedures for drawing statistical
inferences. Recent developments in the area of DEA statistical inference now render
such views out of date, and several options are presently available for statistical treat-
ment of DEA and other frontier-based methods. One approach is due to Banker (1993,
1996), who has shown that for certain assumed distributions of the DEA efficiency
estimator and under certain conditions of independence, the difference in the efficien-
cies of two sets of production units may be assessed by an F test. Extending this rea-
soning, Banker also suggested how tests for increasing or decreasing returns to scale
and tests of model specification could be performed. Importantly, Simar and Wilson
(1998, 2000a, 2000b) have developed statistically consistent bootstrap methods that
allow efficiency estimators to be corrected for bias and confidence intervals for effi-
ciency measures to be determined for the general multi-input multi-output DEA case.
Finally, an alternative to DEA is the stochastic frontier approach, in which instead of
using a linear technology to define the production function, a parametric stochastic
Gelade, Gilbert / DATA ENVELOPMENT ANALYSIS 491
at Universitas Gadjah Mada on June 14, 2015orm.sagepub.comDownloaded from
function is used (see, e.g., Greene, 1992, for a review of stochastic frontier methods).
Unlike DEA, however, these stochastic methods are presently limited to single output
problems.
Derivation of Climate Measures
Organizational climate has been variously defined as “a relatively enduring quality
of the internal environment of the organization that (a) is experienced by its members,
(b) influences their behaviour and (c) can be described in terms of values of a particular
set of characteristics” (Taguiri, 1968, p. 27); “the ‘ambience’of an organization . . . pat-
terns of influence on employee (member) behavior, generated by prevailing environ-
mental conditions in an organization” (Sells & James, 1987); and “a relatively endur-
ing characteristic of an organization which . . . embodies members’ collective
perceptions about their organization” (Moran & Volkwein, 1992).
Cook, Hepworth, Wall, and Warr (1981, p. 172) noted that although organizational
climate is measured through individual perceptions, it is not an individual-level vari-
able, and the appropriate unit of analysis is the organization or organizational subunit.
When individual perceptions refer to the “social setting or context of which the person
is a part” (Rousseau, 1988, p. 140) they constitute a measure of “psychological cli-
mate” (James, 1982; Joyce & Slocum, 1984; Rousseau, 1988); to obtain climate scores
at the appropriate level of analysis, it is thus necessary to aggregate individual
employee scores (i.e., psychological climates) to the branch level.
Aggregation of individual scores to a larger group is common in organizational
research, and Glick (1985) has argued that most perceptual measures of climate are
sufficiently reliable to justify such aggregation. However, aggregation does raises
methodological issues, and agreement among respondents is a concern (e.g., Guion,
1973; Payne, Fineman, & Wall, 1976); it has been suggested that climate measures
should not be aggregated to group level unless there is a minimum degree of consensus
among the respondents in the group (James, 1982; Joyce & Slocum, 1984).
For the present analyses, the level to which climate was aggregated was determined
by the level for which effectiveness indicators were available. For the first data set
(Bank A), this was the branch (n = 204). Climate scores were derived from responses to
a broad-based employee survey questionnaire containing 138 items, which was com-
pleted by all grades of branch staff. This survey was administered in October 1998 and
was designed to monitor employee opinion, and not for the purposes of the present
study. The criterion for inclusion in the analysis was that a branch returned a minimum
of 10 questionnaires in the bank’s employee opinion survey. The total number of ques-
tionnaires analysed was 5,120.
For this data set, we chose to represent climate by a single index of the branch work
environment; items were selected for this measure on the basis of their intraclass corre-
lation coefficient, ICC2 (Bartko, 1976; Shrout & Fleiss, 1979).1
ICC2 is the reliability
of the group mean score that is created when individual scores are aggregated and
increases with increasing group consensus, taking a maximum value of 1. It may be
conceptualized as the expected correlation between the mean ratings of the same tar-
gets by different random samples of judges (Bartko, 1976). In this application, we
would expect items measuring branch-level characteristics to have higher ICC2 values
than items tapping individual-level attitudes. Items were included in the branch index
492 ORGANIZATIONAL RESEARCH METHODS
at Universitas Gadjah Mada on June 14, 2015orm.sagepub.comDownloaded from
if their ICC2 was greater than or equal to .7, a commonly accepted minimum level for
reliability.
Fourteen items met the ICC2 criterion and were summed to give an overall score
(average interitem correlation = .52, standardized item alpha = .93). Sample items in
the index were as follows: “My branch/department operates efficiently” (ICC2 = .82),
and “Staff are treated with respect here, regardless of their job” (ICC2 = .70).2
The
ICC2 for the 14-item index was .83.
For Bank B, the production unit and level of aggregation was the region (n = 79).
Climate scores were derived from responses to a 50-item opinion survey, designed to
monitor employee opinion rather than for this study. This survey was administered in
November1998,andusablequestionnaireswerereturnedby16,301retailbankstaff.
Here we followed a factor-analytic route to derive a multidimensional measure of
climate. Principal components extraction recovered 10 factors with eigenvalues
greater than 1. As is well known, this criterion tends to overestimate the number of real
factors in the data, and a Velicer (1976) MAP test suggested only six real factors.
Oblimin rotation of the six-factor solution failed to produce an interpretable solution,
however, and we finally chose an eight-factor solution explaining 58.5% of the vari-
ance prior to rotation. Regression factor scores were calculated for each individual for
each factor. At regional level, seven factors had an ICC2 of .7 or greater and were
retained for subsequent analysis.
Using DEA to Determine
Bank Branch Efficiencies
DEA is well established in the banking sector. For example, Barr, Seiford, and
Siems (1993) developed a DEA model that used inputs such as staff numbers, fixed
assets, and interest and noninterest expenses and three financial outputs, deposits,
earning assets, and interest income. In this study, the production units were entire
banking organizations in the United States, and the technical efficiency scores were
predictive of institutional survival over a 5-year period. In contrast to the United
States, the U.K. retail banking sector consists of a handful of large banking institu-
tions, each operating its own national branch network. In the study described below,
the production units are organizational subunits (branches and regions of banks) rather
than entire banking organizations.
The production units for Bank A were 204 branches for which climate measures
had been derived. The outputs for Bank A’s DEA model (Model 1) were five measures
of branch sales activity and one measure of branch customer satisfaction. The sales
measures pertained to activity over the period from October 1998 to March 1999 and
were as follows: the number of new current accounts, the number of new loans, the
number of new youth accounts, the number of new savings accounts, and the number
of new customers. Customer satisfaction was calculated by multiplying each branch’s
average customer satisfaction score for the period March 1998 to March 1999 by the
number of active customers. (Customer satisfaction is reported as an annual moving
average, and a value covering the same period as the sales data was not available.) The
input for Model 1 was the average number of branch staff (full-time equivalent) in the
period from October 1998 to March 1999.
For Bank B, the production units were the 79 regions. Different performance statis-
tics were available for this organization, and the outputs for Bank B’s DEA model
Gelade, Gilbert / DATA ENVELOPMENT ANALYSIS 493
at Universitas Gadjah Mada on June 14, 2015orm.sagepub.comDownloaded from
(Model 2) were 1999 figures for consumer lending (£million), the number of insurance
policies sold, the number of new investments, and a financial commission figure (£).
The input was the number of staff in the region.
Correlations between the individual efficiency ratios for each data set are shown in
Tables 3a and 3b. Both models were analyzed by DEAP using VRS, under output ori-
entation. The results are shown in Table 4.
The moderate values of skew and kurtosis suggest that parametric statistical proce-
dures can be applied to the technical efficiency scores without introducing unaccept-
able levels of bias. However, a histogram of the technical efficiencies for Bank A did
indicate a clearly bimodal distribution.
A plausible place to look for differences in staff efficiency is differences in working
practices; and in fact, it turns out that 84 Bank A branches are supported by centralized
494 ORGANIZATIONAL RESEARCH METHODS
Table 3a
Correlations Between Efficiency Ratios for Bank A (N = 204)
e1 e2 e3 e4 e5
e1: New customers per headcount
e2: New loans per headcount .36**
e3: New youth accounts per headcount .52** .13
e4: New current accounts per headcount .89** .33** .11
e5: Total customer satisfaction per headcount .63** .18** .74** .37**
e6: New savings accounts per headcount .82** .31** .38** .66** .45**
*p ≤ .05. **p ≤ .01. ***p ≤ .001.
Table 3b
Correlations Between Efficiency Ratios for Bank B (N = 79)
e7 e8 e9
e7: Domestic insurance policies per headcount
e8: New investments per headcount .31**
e9: Consumer Lending per headcount .51*** .24*
e10: Commission per headcount .04 –.23* –.19
*p ≤ .05. **p ≤ .01. ***p ≤ .001.
Table 4
Data Envelopment Analysis Results
Technical Efficiency Percentage of DMUs
Standard
Bank Model Mean Minimum Deviation Skew Kurtosis FRNTa
DRSb
IRSc
A 1 .644 .300 0.19 0.43 –0.69 6.9 29.9 63.7
B 2 .866 .683 0.10 –0.12 –1.14 15.2 24.0 65.8
Note: DMU = decision-making unit.
a. Percentage of DMUs on efficiency frontier.
b. Percentage of DMUs with decreasing return to scale.
c. Percentage of DMUs with increasing return to scale.
at Universitas Gadjah Mada on June 14, 2015orm.sagepub.comDownloaded from
service centers that handle routine transaction processing for the branches in their
area, and the remaining 120 branches are nonsupported. We compared the mean effi-
ciencies for service center supported and non–service center–supported branches; the
mean technical efficiency for supported branches was .75, and the mean technical effi-
ciency for nonsupported branches was .57. The difference was highly significant on a
one-way ANOVA, F(1, 202) = 62.7, p < .001. In supported branches, staff are freed
from routine processing tasks, so the greater efficiency of these branches in sales and
service delivery is exactly what would be expected. To eliminate the effects of service
center support, which place an upper limit on the efficiency that nonsupported
branches can achieve, we standardized Bank A’s efficiency measures within branch
type for the purposes of subsequent analyses.
Relationships Between Work Climate
and Effectiveness Measures
In this section, we examine the correlations between work climate and three indica-
tors of production unit effectiveness. The effectiveness indicators we consider are indi-
vidual efficiency ratios, an additive scale of efficiency ratios, and DEA technical effi-
ciency. The results are shown in Table 5.
For each data set and DEA model in Table 5, the four columns under the Individual
Efficiency Ratios heading report, respectively, the number of efficiency ratios, n
(because there is only one model input, n is equal to the number of model outputs); the
average of the n correlations between the climate measure and the n individual effi-
ciency ratios; the minimum and maximum of the n correlations; and the number of sig-
nificant correlations. The next two columns of Table 5 show the results for an additive
efficiency scale formed by standardizing the individual efficiency ratios and then sum-
ming them. The first column in this section of the table reports the standardized item
alpha for the additive scale, and the next column reports its climate correlation. Last,
we report the climate correlations with DEA technical efficiency.
It is clear from Table 5 that the climate correlations for individual efficiency ratios
are difficult to interpret and provide a rather uncertain basis for drawing any firm con-
clusions about the overall relationship between work climate and production unit
effectiveness. For example, for Bank A (all branches), the climate correlations range
between .06 and .22, and of the six correlations, two are significant and four are not;
furthermore, Steiger’s (1980) quadratic form asymptotic χ2
test for equality of correla-
tions shows there are significant differences between the six correlations (χ2
= 13.1,
df = 6, p < .05).
This suggests that some overall measure of production unit effectiveness should be
examined. For Model 1, such a measure can be formed by summing the six standard-
ized efficiency ratios, which produces an additive measure of overall efficiency whose
alpha reliability is .84. However, for Model 2, summing the individual efficiency ratios
produces a low reliability scale (alpha = .34). In this case, construction of an additive
efficiency scale is not justified; for this reason, we have chosen not to report its correla-
tions with climate. Here, the DEA estimate of technical efficiency provides an attrac-
tive alternative measure of overall production unit effectiveness.
Gelade, Gilbert / DATA ENVELOPMENT ANALYSIS 495
at Universitas Gadjah Mada on June 14, 2015orm.sagepub.comDownloaded from
496
Table 5
Summary of Correlations Between Climate Measures and Efficiency Measures
Individual Efficiency Ratios
Dataset n DEA Model Climate Measure no r-avg rmin - rmax sig α ra rt
Bank A
All branches 204 1 Climate Index 6 .14 .06 - .22 2 .84 .20** .21**
Non–service center branches 120 Climate Index .12 –.01 - .21 2 .18† .15†
Service center branches 84 Climate Index .16 .01 - .24 3 .24* .29**
Bank B
Regions 79 2 Participative Management 4 .15 .10 - .20 0 .34 .— .21†
Performance Management .02 –.13 - .15 0 .— .07
Team Climate .09 –.01 - .19 0 .— .13
Organizational Satisfaction .13 .04 - .23 1 .— .26*
Intrinsic Job Satisfaction .07 –.07 - .20 0 .— .11
Extrinsic Rewards .13 –.02 - .28 1 .— .21†
Training and Resources .09 .04 - .13 0 .— .13
†p < .10. *p < .05. **p < .01.
Note: N = number of production units; no = number of model outputs; r-avg = average of the n climate correlations; rmin-rmax = minimum and maximum of the n climate
correlations;sig = number of significant climate correlations;α = standardized item alpha for additive efficiency scale;ra = climate correlation for additive efficiency scale;
rt = climate correlation for technical efficiency.
atUniversitasGadjahMadaonJune14,2015orm.sagepub.comDownloadedfrom
Discussion
Expressing production unit effectiveness in terms of technical efficiency has sev-
eral advantages.
First, each unit may be described by a single indicator of overall effectiveness,
which simplifies the interpretation of climate-effectiveness correlations. We do not
wish to imply that measures of production unit effectiveness should always be consoli-
dated into a single indicator such as technical efficiency, because there may be
instances when doing so might obscure specific relationships of substantive interest.
Consolidating effectiveness measures would not be advisable when, for instance, there
are a priori reasons to expect these measures to have differing relationships to other
variables, such as job satisfaction.
However, if the benefits of a single indicator are accepted, there remains the ques-
tion of how it should be constructed. Organizational psychologists are familiar with
the concept of additive rating scales based on true score theory and the advantages of
increased reliability that these scales confer, and it is natural—but not necessarily jus-
tified—to suppose that an additive scale of efficiency ratios could be constructed to
measure overall effectiveness.
In practice, it may not always make much difference whether technical efficiency or
an additive efficiency scale is used; for Model 1, the correlation between technical effi-
ciency and the additive efficiency scale is .81, and there are no substantial differences
in the correlations of either with climate. Yet it is still the case that additive scales are
not always appropriate for measuring production unit performance. Because each pro-
duction unit has finite resources, increasing one type of efficiency may require
decreasing another, leading to negative correlations between efficiency ratios. The
efficiency correlations reported in Table 3b show that this is more than a theoretical
possibility. Thus, individual efficiency ratios are not necessarily independent indica-
tors of an underlying efficiency factor in the same way that questionnaire responses are
independent indicators of, say, an underlying climate factor.
This poses a dilemma to a researcher studying a model such as Model 2 reported
here; results based on uncombined efficiencies may be inconclusive and subject to
Type I errors of interpretation, yet an additive scale of efficiencies may be
psychometrically—and substantively—invalid. In either case, whatever conclusions
the researcher might draw about overall effectiveness would be subject to methodolog-
ical criticism.
In contrast to this, the way in which performance measures are combined in DEA
rests on strong theoretical foundations of production economics, allowing overall effi-
ciency to be computed in circumstances in which additive scales cannot be legiti-
mately constructed.
The results presented here also demonstrate that technical efficiency describes an
attribute of operational effectiveness that is associated with the perceived work climate
of the production unit and show the feasibility of using DEA methods in a psychologi-
cal context. This suggests the possibility of building a bridge between the disciplines
of operational research and organizational psychology, which may yield further
insights into the relationship between the economic and psychological aspects of pro-
duction.
Gelade, Gilbert / DATA ENVELOPMENT ANALYSIS 497
at Universitas Gadjah Mada on June 14, 2015orm.sagepub.comDownloaded from
Notes
1. Several considerations dictated using the intraclass correlation coefficient ICC2 as a crite-
rion for item selection in preference to the more commonly used measure of agreement rwg
(James, Demaree, & Wolf, 1984). First, rwg has been, and to some extent remains, the subject of
methodological controversy (James, Demaree, & Wolf, 1993; Lindell & Brandt, 1997; Schmidt
& Hunter, 1989); second, James et al. (1984, p. 95) counseled against using rwg for single items
because the obtained values are strongly dependent on the choice of reference distribution; and
finally, the empirical values of the single-item rwgs we obtained (using a uniform reference dis-
tribution) seemed difficult to rationalize. To illustrate this last point, there were two survey items
concerning reasonably concrete attributes of the branch environment (overall, the physical
working conditions at my location are satisfactory—e.g., ventilation, temperature, space to
work—and performance reviews are conducted on a regular and timely basis in my branch) that
might intuitively be expected to produce a higher degree of consensus among the respondents
than items requiring judgments of a more subjective nature. The ICC2 values for these two
items were, respectively, .82 and .77 (the 2nd and 7th highest of the 138 ICC2 values), but the
corresponding rwg valueswere.18and.27(the129thand113thhighest ofthe138 rwg values).
2. A full list of items is available upon request.
References
Abbey, A., & Dickson, J. W. (1983). R&D work climate and innovation in semiconductors.
Academy of Management Journal, 26, 362-368.
Athanassopoulos, A. D. (1995). Performance improvement decision aid systems (PIDAS) in re-
tailing organizations using data envelopment analysis. Journal of Productivity Analysis, 6,
153-170.
Banker, R. D. (1993, October). Maximum likelihood, consistency and data envelopment analysis:
A statistical foundation. Management Science, pp. 1265-1273.
Banker, R. D. (1996). Hypothesis tests using Data Envelopment Analysis. Journal of Productiv-
ity Analysis, 7, 139-159.
Banker, R. D., Charnes, A., & Cooper, W. W. (1984). Some models for estimating technical and
scale inefficiencies in data envelopment analysis. Management Science, 30, 1078-1092.
Banker, R. D., Conrad, R. F., & Strauss, R. P. (1986). A comparative application of DEA and
translog methods: An illustrative study of hospital production. Management Science, 32,
30-44.
Banker, R. D., & Kemerer, C. F. (1989). Scale economies in new software development. IEEE
Transactions on Software Engineering, 15, 1199-1205.
Barr, R. S., Seiford, L. M., & Siems, T. F. (1993). An envelopment-analysis approach to measur-
ing the managerial quality of banks. Annals of Operations Research, 45, 1-19.
Bartko, J. J. (1976). On various intraclass correlation reliability coefficients. Psychological Bul-
letin, 83, 762-765.
Bessent, A., & Bessent, W. (1980). Determining the comparative efficiency of schools through
data envelopment analysis. Educational Administration Quarterly, 16, 57-75.
Bhargava, M., Dubelaar, C., & Ramaswami, S. (1994). Reconciling diverse measures of perfor-
mance: A conceptual framework and test of a methodology. Journal of Business Research,
31, 235-246.
Boles, J. S., Donthu, N., & Lohtia, R. (1995). Salesperson evaluation using relative performance
efficiency: The application of data envelopment analysis. Journal of Personal Selling &
Sales Management, 15, 31-49.
Brockett, P. L., Cooper, W. W., Golden, L. L., Rousseau, J. J., & Wang, Y. (1998). DEA evalua-
tions of the efficiency of organizational forms and distribution systems in the US property
andliability insurance industry. International Journal ofSystems Science,29,1235-1247.
498 ORGANIZATIONAL RESEARCH METHODS
at Universitas Gadjah Mada on June 14, 2015orm.sagepub.comDownloaded from
Button, K. J., & Weyman-Jones, T. G. (1992). Ownership structure, institutional organization
and measured X-efficiency. AEA Papers and Proceedings, 82, 439-445.
Chan, P. S., & Sueyoshi, T. (1991). Environmental change, competition, strategy, structure and
firm performance: An application of data envelopment analysis in the airline industry. In-
ternational Journal of Systems Science, 22, 1625-1636.
Charnes, A., & Cooper, W. W. (1962). Programming with linear fractional functionals. Naval
Research Logistics Quarterly, 9, 181-186.
Charnes, A., Cooper, W. W., Lewin, A. Y., & Seiford, L. M. (1995). Data envelopment analysis.
Boston: Kluwer.
Charnes, A., Cooper, W. W., & Rhodes, E. (1978). Measuring the efficiency of decision making
units. European Journal of Operational Research, 2, 429-444.
Charnes, A., Cooper, W. W., & Rhodes, E. (1981). Evaluating program and managerial effi-
ciency: An application of data envelopment analysis to program follow through. Manage-
ment Science, 27, 668-697.
Chebat, J., Filiatrault, P., Katz, A., & Tal, S. M. (1994). Strategic auditing of human and financial
resource allocation in marketing: An empirical study using data envelopment analysis.
Journal of Business Research, 31, 197-208.
Chirikos, T. N., & Sear, A. M. (2000). Measuring hospital efficiency: A comparison of two ap-
proaches. Health Services Research, 34, 1389-1408.
Coelli, T. J. (1996). A guide to DEAP Version 2.1: A data envelopment analysis (computer) pro-
gram (CEPA Working Paper 96/8). Armidale, New South Wales, Australia: University of
New England, Department of Econometrics.
Coelli, T., Rao, D. S. P., & Battese, G. E. (1998). An introduction to efficiency and productivity
analysis. Boston: Kluwer Academic.
Cook, J. D., Hepworth, S. J., Wall, T. D., & Warr, P. B. (1981). The experience of work. London:
Academic Press.
Cooper, W. W., Seiford, L. M., & Tone, K. (1999). Data envelopment analysis—A comprehen-
sive text with models, applications, references and DEA solver software. Boston: Kluwer
Academic.
Daft, R. L., & Lewin, A. Y. (1990). Can organization studies begin to break out of the normal sci-
ence straitjacket? An editorial essay. Organization Science, 1, 1-9.
Day, D. L., Lewin, A. Y., & Li, H. (1995). Strategic leaders or strategic groups: A longitudinal
data envelopment analysis of the U. S. brewing industry. European Journal of Operational
Research, 80, 619-638.
Denison, D. R. (1990). Corporate culture and organizational effectiveness. New York: John
Wiley.
Drake, L., & Howcroft, B. (1994). Relative efficiency in the branch network of a UK Bank: An
empirical study. Omega: International Journal of Management Science, 22, 83-90.
Emrouznejad, A. (2001). An extensive bibliography of data envelopment analysis (DEA).
Coventry, UK: University of Warwick, Business School. Retrieved September 16, 2002,
from http://www.deazone.com/bibliography/index.htm
Farrell, M. J. (1957). The measurement of productive efficiency. Journal of the Royal Statistical
Society, Series A, 120(Part 3), 253-290.
Ferrantino, M. J., Ferrier, G. D., & Linvill, C. B. (1995). Organizational form and efficiency: Ev-
idence from Indian sugar manufacturing. Journal of Comparative Economics, 21, 29-53.
Glick, W. H. (1985). Conceptualizing and measuring organizational and psychological climate:
Pitfalls in multi-level research. Academy of Management Review, 10, 606-616.
Greene, W. H. (1992). The econometric approach to efficiency analysis. In H. O. Fried, C. A. K.
Lovell, & S. S. Smith (Eds.), The measurement of productive efficiency: Techniques and ap-
plications. New York: Oxford University Press.
Guion, R. M. (1973). A note on organizational climate. Organizational Behavior and Human
Performance, 9, 120-125.
Gelade, Gilbert / DATA ENVELOPMENT ANALYSIS 499
at Universitas Gadjah Mada on June 14, 2015orm.sagepub.comDownloaded from
James, L. R. (1982). Aggregation bias in estimates of perceptual measures. Journal of Applied
Psychology, 67, 219-229.
James, L. R., Demaree, R. G., & Wolf, G. (1984). Estimating within-group interrater reliability
with and without response bias. Journal of Applied Psychology, 69, 85-98.
James, L. R., Demaree, R. G., & Wolf, G. (1993). rwg
: An assessment of within-group interrater
agreement. Journal of Applied Psychology, 73, 306-309.
Joyce, V. F., & Slocum, J. W. (1984). Collective climate: Agreement as a basis for defining ag-
gregate climate in organizations. Academy of Management Journal, 27, 721-742.
Kwok, L. (1997). Relationships among satisfaction, commitment, and performance: A group-
level analysis. Applied Psychology: An International Review, 46, 199-206.
Lee, B., & Menon, N. M. (2000). Information technology value through different normative
lenses. Journal of Management Information Systems, 16, 99-119.
Lewin, A. Y., & Minton, J. W. (1986). Determining organizational effectiveness: Another look,
and an agenda for research. Management Science, 32, 514-538.
Lindell, M. K., & Brandt, C. J. (1997). Measuring interrater agreement for ratings of a single tar-
get. Applied Psychological Measurement, 21, 271-278.
Miliotis, P. A. (1992). Data envelopment analysis applied to electricity distribution districts.
Journal of the Operational Research Society, 43, 549-555.
Moran, E. T., & Volkwein, J. F. (1992). The cultural approach to the formation of organizational
climate. Human Relations, 45, 19-47.
Ostroff, C. (1992). The relationship between satisfaction, attitudes, and performance: An orga-
nizational level analysis. Journal of Applied Psychology, 77, 963-974.
Payne, R. L., Fineman, S., & Wall, T. D. (1976). Organizational climate and job satisfaction: A
conceptual synthesis. Organizational Behavior and Human Performance, 16, 45-62.
Ray, S. C., & Hu, X. W. (1997). On the technically efficient organization of an industry: A study
of US airlines. Journal of Productivity Analysis, 8, 5-18.
Ray, S. C., & Kim, H. J. (1995). Cost efficiency in the US steel industry: A nonparametric analy-
sis using data envelopment analysis. European Journal of Operational Research, 80, 654-
671.
Rousseau, D. M. (1988). The construction of climate in organizational research. In C. L. Cooper
& I. Robertson (Eds.), International review of industrial and organizational psychology
(pp. 137-158). London: Wiley.
Ryan, A. M., Schmit, M. J., & Johnson, R. (1996). Attitudes and effectiveness: Examining rela-
tions at an organizational level. Personnel Psychology, 49, 853-882.
Sarrico, C. S., & Dyson, R. G. (2000). Using DEA for planning in UK universities—An institu-
tional perspective. Journal of the Operational Research Society, 51, 789-800.
Schmidt, F. L., & Hunter, J. E. (1989). Interrater reliability coefficients cannot be computed
when only one stimulus is rated. Journal of Applied Psychology, 74, 368-370.
Seiford, L. M. (1996). Data envelopment analysis: The evolution of the state of the art (1978-
1995), Journal of Productivity Analysis, 7, 99-137.
Seiford, L. M. (1997). A bibliography for data envelopment analysis (1978-1996). Annals of
Operations Research, 73, 393-438.
Sells, S. B., & James, L. R. (1987). Organizational climate. In J. L. Nesselroade & R. B. Cattell
(Eds.), Handbook of multivariate experimental psychology (2nd ed, pp. 915-937). New
York: John Wiley.
Shrout, P. E., & Fleiss, J. L (1979). Intraclass correlations: uses in assessing rater reliability. Psy-
chological Bulletin, 86, 420-428.
Simar, L., & Wilson, P. W. (1998). Sensitivity analysis of efficiency scores: How to bootstrap in
nonparametric frontier models. Management Science, 44, 49-61.
Simar, L., & Wilson, P. W. (2000a). A general methodology for bootstrapping in non-parametric
frontier models. Journal of Applied Statistics, 27, 779-802.
500 ORGANIZATIONAL RESEARCH METHODS
at Universitas Gadjah Mada on June 14, 2015orm.sagepub.comDownloaded from
Simar, L., & Wilson, P. W. (2000b). Statistical inference in nonparametric frontier models: The
state of the art. Journal of Productivity Analysis, 13, 49-78.
Soteriou, A. C., & Stavrinides, Y. (1997). An internal customer DEA service quality model for
bank branches. International Journal of Operations and Production Management, 17, 780-
789.
Steiger, J. H. (1980). Testing pattern hypotheses on correlation matrices: Alternative statistics
and some empirical results. Multivariate Behavioral Research, 15, 335-352.
Tankersley, W. B. (1990). The effects of organizational control structure and process on organi-
zational performance (Doctoral dissertation, Florida State University). Dissertation Ab-
stracts International, 51, 4274A.
Taguiri, R. (1968). The concept of organizational climate. In R. Taguiri & G. H. Litwin (Eds.),
Organizational climate. Boston: Harvard University Press.
Thanassoulis, E. (1996). Assessing the effectiveness of schools with pupils of different ability
usingdataenvelopment analysis. Journal oftheOperational ResearchSociety,47,84-97.
Thanassoulis, E., & Dunstan, P. (1994). Guiding schools to improved performance using data
envelopment analysis: An illustration with data from a local education authority. Journal of
the Operational Research Society, 45, 1247-1262.
Velicer, W. F. (1976). Determining the number of components from the matrix of partial correla-
tions. Psychometrika, 41, 321-327.
West, M. A., Smith, H., Feng, W. L., & Lawthom, R. (1998). Research excellence and depart-
mental climate in British universities. Journal of Occupational and Organizational Psy-
chology, 71, 261-281.
Garry Gelade, Ph.D., read psychology at the University of Cambridge. Following completion of his doc-
toral thesis on human vision — conducted in the Department of Electronic Engineering at Nottingham
University — he worked as a post-graduate researcher in cognitive psychology at the University of Oxford.
After a spell in industry working in information technology, he now works with Business Analytic Ltd., Lon-
don, as an independent consultant to business specializing in the psychology of organizational effectiveness
and applied creative thinking.
Patrick Gilbert, Ph.D., is now an employee research and organizational effectiveness consultant with Mer-
cer Human Resource Consulting, London. He was affiliated with International Survey Research, London,
during the development of this article.
Gelade, Gilbert / DATA ENVELOPMENT ANALYSIS 501
at Universitas Gadjah Mada on June 14, 2015orm.sagepub.comDownloaded from

More Related Content

Viewers also liked

Carnaval 2012
Carnaval 2012Carnaval 2012
Carnaval 2012
artatse2
 
Candlebridge Research Presentation
Candlebridge Research PresentationCandlebridge Research Presentation
Candlebridge Research PresentationSteve Zimmerman
 
Down South Dinners Final Presentation
Down South Dinners Final PresentationDown South Dinners Final Presentation
Down South Dinners Final PresentationSteve Zimmerman
 
Primer trabajo
Primer trabajoPrimer trabajo
Primer trabajo
ksanchezromo
 
Esercizio 4...
Esercizio 4...Esercizio 4...
Esercizio 4...
imma_formisano92
 
iHelp & Open Data
iHelp & Open DataiHelp & Open Data
iHelp & Open Data
Chia Wei Tsai
 

Viewers also liked (7)

Carnaval 2012
Carnaval 2012Carnaval 2012
Carnaval 2012
 
Candlebridge Research Presentation
Candlebridge Research PresentationCandlebridge Research Presentation
Candlebridge Research Presentation
 
Down South Dinners Final Presentation
Down South Dinners Final PresentationDown South Dinners Final Presentation
Down South Dinners Final Presentation
 
Prueba ddddd
Prueba dddddPrueba ddddd
Prueba ddddd
 
Primer trabajo
Primer trabajoPrimer trabajo
Primer trabajo
 
Esercizio 4...
Esercizio 4...Esercizio 4...
Esercizio 4...
 
iHelp & Open Data
iHelp & Open DataiHelp & Open Data
iHelp & Open Data
 

Similar to 2003 work climate and organizational effectiveness-the application of data envelopment analysis in organizational research-organizational research methods-2003-gelade-482-501

10.2307@2631397
10.2307@263139710.2307@2631397
10.2307@2631397
jesus vargas
 
Lean manufacturing context_practice_bundles_and_pe
Lean manufacturing context_practice_bundles_and_peLean manufacturing context_practice_bundles_and_pe
Lean manufacturing context_practice_bundles_and_pe
Angela Castillo
 
Measurement and Comparison of Productivity Performance Under Fuzzy Imprecise ...
Measurement and Comparison of Productivity Performance Under Fuzzy Imprecise ...Measurement and Comparison of Productivity Performance Under Fuzzy Imprecise ...
Measurement and Comparison of Productivity Performance Under Fuzzy Imprecise ...
Waqas Tariq
 
Trentin, Forza and Perin, 2015
Trentin, Forza and Perin, 2015Trentin, Forza and Perin, 2015
Trentin, Forza and Perin, 2015Alessio Trentin
 
DeterminantsofFirmPerformanceASubjectiveModel.pdf
DeterminantsofFirmPerformanceASubjectiveModel.pdfDeterminantsofFirmPerformanceASubjectiveModel.pdf
DeterminantsofFirmPerformanceASubjectiveModel.pdf
beenayadav15
 
An Application Of The Data Envelopment Analysis Method To Evaluate The Perfor...
An Application Of The Data Envelopment Analysis Method To Evaluate The Perfor...An Application Of The Data Envelopment Analysis Method To Evaluate The Perfor...
An Application Of The Data Envelopment Analysis Method To Evaluate The Perfor...
Karin Faust
 
Efficiency of Power Distribution Companies in Pakistan (Application of Non Pa...
Efficiency of Power Distribution Companies in Pakistan (Application of Non Pa...Efficiency of Power Distribution Companies in Pakistan (Application of Non Pa...
Efficiency of Power Distribution Companies in Pakistan (Application of Non Pa...
NAUMAN MUSHTAQ (KHOKHAR)
 
Ijetr042188
Ijetr042188Ijetr042188
GSCM.pdf
GSCM.pdfGSCM.pdf
GSCM.pdf
ssuserb47458
 
Sustainable supply chain and companyperformanceA global .docx
Sustainable supply chain and companyperformanceA global .docxSustainable supply chain and companyperformanceA global .docx
Sustainable supply chain and companyperformanceA global .docx
deanmtaylor1545
 
SET2013_Study of hotel performance using data envelopment analysis_26-29 Aug ...
SET2013_Study of hotel performance using data envelopment analysis_26-29 Aug ...SET2013_Study of hotel performance using data envelopment analysis_26-29 Aug ...
SET2013_Study of hotel performance using data envelopment analysis_26-29 Aug ...Martin WAN
 
Lean Manufacturing and employee Performance in Malysia
Lean Manufacturing and employee Performance in MalysiaLean Manufacturing and employee Performance in Malysia
Lean Manufacturing and employee Performance in Malysia
khalidGGG
 
Application of consistency and efficiency test for forecasts
Application of consistency and efficiency test for forecastsApplication of consistency and efficiency test for forecasts
Application of consistency and efficiency test for forecasts
Alexander Decker
 
Cfi.co winter 2014 2015 - luisa nenci
Cfi.co winter 2014 2015 - luisa nenciCfi.co winter 2014 2015 - luisa nenci
Cfi.co winter 2014 2015 - luisa nenci
Luisa Nenci
 
Running head RESEARCH METHODOLOGY, DESIGN AND METHODS 1RESEARC.docx
Running head RESEARCH METHODOLOGY, DESIGN AND METHODS 1RESEARC.docxRunning head RESEARCH METHODOLOGY, DESIGN AND METHODS 1RESEARC.docx
Running head RESEARCH METHODOLOGY, DESIGN AND METHODS 1RESEARC.docx
jeanettehully
 
Business Question.pdf
Business Question.pdfBusiness Question.pdf
Business Question.pdf
stirlingvwriters
 
Plehn 110805 apms_11_environmental_performance_indicators
Plehn 110805 apms_11_environmental_performance_indicatorsPlehn 110805 apms_11_environmental_performance_indicators
Plehn 110805 apms_11_environmental_performance_indicatorsFred Kautz
 
Ck33523530
Ck33523530Ck33523530
Ck33523530
IJERA Editor
 
Ck33523530
Ck33523530Ck33523530
Ck33523530
IJERA Editor
 

Similar to 2003 work climate and organizational effectiveness-the application of data envelopment analysis in organizational research-organizational research methods-2003-gelade-482-501 (20)

10.2307@2631397
10.2307@263139710.2307@2631397
10.2307@2631397
 
Lean manufacturing context_practice_bundles_and_pe
Lean manufacturing context_practice_bundles_and_peLean manufacturing context_practice_bundles_and_pe
Lean manufacturing context_practice_bundles_and_pe
 
Measurement and Comparison of Productivity Performance Under Fuzzy Imprecise ...
Measurement and Comparison of Productivity Performance Under Fuzzy Imprecise ...Measurement and Comparison of Productivity Performance Under Fuzzy Imprecise ...
Measurement and Comparison of Productivity Performance Under Fuzzy Imprecise ...
 
Trentin, Forza and Perin, 2015
Trentin, Forza and Perin, 2015Trentin, Forza and Perin, 2015
Trentin, Forza and Perin, 2015
 
DeterminantsofFirmPerformanceASubjectiveModel.pdf
DeterminantsofFirmPerformanceASubjectiveModel.pdfDeterminantsofFirmPerformanceASubjectiveModel.pdf
DeterminantsofFirmPerformanceASubjectiveModel.pdf
 
An Application Of The Data Envelopment Analysis Method To Evaluate The Perfor...
An Application Of The Data Envelopment Analysis Method To Evaluate The Perfor...An Application Of The Data Envelopment Analysis Method To Evaluate The Perfor...
An Application Of The Data Envelopment Analysis Method To Evaluate The Perfor...
 
Efficiency of Power Distribution Companies in Pakistan (Application of Non Pa...
Efficiency of Power Distribution Companies in Pakistan (Application of Non Pa...Efficiency of Power Distribution Companies in Pakistan (Application of Non Pa...
Efficiency of Power Distribution Companies in Pakistan (Application of Non Pa...
 
Ijetr042188
Ijetr042188Ijetr042188
Ijetr042188
 
GSCM.pdf
GSCM.pdfGSCM.pdf
GSCM.pdf
 
Sustainable supply chain and companyperformanceA global .docx
Sustainable supply chain and companyperformanceA global .docxSustainable supply chain and companyperformanceA global .docx
Sustainable supply chain and companyperformanceA global .docx
 
SET2013_Study of hotel performance using data envelopment analysis_26-29 Aug ...
SET2013_Study of hotel performance using data envelopment analysis_26-29 Aug ...SET2013_Study of hotel performance using data envelopment analysis_26-29 Aug ...
SET2013_Study of hotel performance using data envelopment analysis_26-29 Aug ...
 
Lean Manufacturing and employee Performance in Malysia
Lean Manufacturing and employee Performance in MalysiaLean Manufacturing and employee Performance in Malysia
Lean Manufacturing and employee Performance in Malysia
 
Application of consistency and efficiency test for forecasts
Application of consistency and efficiency test for forecastsApplication of consistency and efficiency test for forecasts
Application of consistency and efficiency test for forecasts
 
Cfi.co winter 2014 2015 - luisa nenci
Cfi.co winter 2014 2015 - luisa nenciCfi.co winter 2014 2015 - luisa nenci
Cfi.co winter 2014 2015 - luisa nenci
 
Running head RESEARCH METHODOLOGY, DESIGN AND METHODS 1RESEARC.docx
Running head RESEARCH METHODOLOGY, DESIGN AND METHODS 1RESEARC.docxRunning head RESEARCH METHODOLOGY, DESIGN AND METHODS 1RESEARC.docx
Running head RESEARCH METHODOLOGY, DESIGN AND METHODS 1RESEARC.docx
 
Business Question.pdf
Business Question.pdfBusiness Question.pdf
Business Question.pdf
 
Plehn 110805 apms_11_environmental_performance_indicators
Plehn 110805 apms_11_environmental_performance_indicatorsPlehn 110805 apms_11_environmental_performance_indicators
Plehn 110805 apms_11_environmental_performance_indicators
 
Ck33523530
Ck33523530Ck33523530
Ck33523530
 
Ck33523530
Ck33523530Ck33523530
Ck33523530
 
Ck33523530
Ck33523530Ck33523530
Ck33523530
 

More from Henry Sumampau

2006 job satisfaction of secondary school teachers-educational management adm...
2006 job satisfaction of secondary school teachers-educational management adm...2006 job satisfaction of secondary school teachers-educational management adm...
2006 job satisfaction of secondary school teachers-educational management adm...Henry Sumampau
 
2005 dissertation-servant leadership theory-application of the construct of s...
2005 dissertation-servant leadership theory-application of the construct of s...2005 dissertation-servant leadership theory-application of the construct of s...
2005 dissertation-servant leadership theory-application of the construct of s...Henry Sumampau
 
2005 development of the servant leadership assessment instrument
2005 development of the servant leadership assessment instrument2005 development of the servant leadership assessment instrument
2005 development of the servant leadership assessment instrumentHenry Sumampau
 
2004 job characteristics and personality as predictors of job satisfaction
2004 job characteristics and personality as predictors of job satisfaction2004 job characteristics and personality as predictors of job satisfaction
2004 job characteristics and personality as predictors of job satisfactionHenry Sumampau
 
2004 dissertation-servant-leadership and job satisfaction
2004 dissertation-servant-leadership and job satisfaction2004 dissertation-servant-leadership and job satisfaction
2004 dissertation-servant-leadership and job satisfactionHenry Sumampau
 
2003 organizational culture and job satisfaction
2003 organizational culture and job satisfaction2003 organizational culture and job satisfaction
2003 organizational culture and job satisfactionHenry Sumampau
 
2001 the dimensions of organizational climate in four- and five-star australi...
2001 the dimensions of organizational climate in four- and five-star australi...2001 the dimensions of organizational climate in four- and five-star australi...
2001 the dimensions of organizational climate in four- and five-star australi...Henry Sumampau
 
1999 overall job satisfaction
1999 overall job satisfaction1999 overall job satisfaction
1999 overall job satisfactionHenry Sumampau
 
1996 what is the difference between organizational culture and organization c...
1996 what is the difference between organizational culture and organization c...1996 what is the difference between organizational culture and organization c...
1996 what is the difference between organizational culture and organization c...Henry Sumampau
 
2006 scale development and construct clarification of servant leadership
2006 scale development and construct clarification of servant leadership2006 scale development and construct clarification of servant leadership
2006 scale development and construct clarification of servant leadershipHenry Sumampau
 
2002 servant leadership it s origin, development, and application in organiza...
2002 servant leadership it s origin, development, and application in organiza...2002 servant leadership it s origin, development, and application in organiza...
2002 servant leadership it s origin, development, and application in organiza...Henry Sumampau
 

More from Henry Sumampau (12)

09 rahasiakecerdasan
09 rahasiakecerdasan09 rahasiakecerdasan
09 rahasiakecerdasan
 
2006 job satisfaction of secondary school teachers-educational management adm...
2006 job satisfaction of secondary school teachers-educational management adm...2006 job satisfaction of secondary school teachers-educational management adm...
2006 job satisfaction of secondary school teachers-educational management adm...
 
2005 dissertation-servant leadership theory-application of the construct of s...
2005 dissertation-servant leadership theory-application of the construct of s...2005 dissertation-servant leadership theory-application of the construct of s...
2005 dissertation-servant leadership theory-application of the construct of s...
 
2005 development of the servant leadership assessment instrument
2005 development of the servant leadership assessment instrument2005 development of the servant leadership assessment instrument
2005 development of the servant leadership assessment instrument
 
2004 job characteristics and personality as predictors of job satisfaction
2004 job characteristics and personality as predictors of job satisfaction2004 job characteristics and personality as predictors of job satisfaction
2004 job characteristics and personality as predictors of job satisfaction
 
2004 dissertation-servant-leadership and job satisfaction
2004 dissertation-servant-leadership and job satisfaction2004 dissertation-servant-leadership and job satisfaction
2004 dissertation-servant-leadership and job satisfaction
 
2003 organizational culture and job satisfaction
2003 organizational culture and job satisfaction2003 organizational culture and job satisfaction
2003 organizational culture and job satisfaction
 
2001 the dimensions of organizational climate in four- and five-star australi...
2001 the dimensions of organizational climate in four- and five-star australi...2001 the dimensions of organizational climate in four- and five-star australi...
2001 the dimensions of organizational climate in four- and five-star australi...
 
1999 overall job satisfaction
1999 overall job satisfaction1999 overall job satisfaction
1999 overall job satisfaction
 
1996 what is the difference between organizational culture and organization c...
1996 what is the difference between organizational culture and organization c...1996 what is the difference between organizational culture and organization c...
1996 what is the difference between organizational culture and organization c...
 
2006 scale development and construct clarification of servant leadership
2006 scale development and construct clarification of servant leadership2006 scale development and construct clarification of servant leadership
2006 scale development and construct clarification of servant leadership
 
2002 servant leadership it s origin, development, and application in organiza...
2002 servant leadership it s origin, development, and application in organiza...2002 servant leadership it s origin, development, and application in organiza...
2002 servant leadership it s origin, development, and application in organiza...
 

2003 work climate and organizational effectiveness-the application of data envelopment analysis in organizational research-organizational research methods-2003-gelade-482-501

  • 1. 10.1177/1094428103257364ARTICLEORGANIZATIONAL RESEARCH METHODSGelade, Gilbert / DATA ENVELOPMENT ANALYSIS Work Climate and Organizational Effectiveness: The Application of Data Envelopment Analysis in Organizational Research GARRY GELADE Business Analytic Ltd., London PATRICK GILBERT International Survey Research, London Previous research examining the climate-effectiveness relationship in organiza- tions has largely failed to take due note of the complex multidimensional nature of organizational effectiveness. This article describes the data envelopment analysis (DEA) technique for evaluating the relative efficiencies of organizations that con- sume multiple inputs and produce multiple outputs and demonstrates its applica- tion to organizational research. The use of DEA is illustrated by calculating the relative efficiencies of the branch offices in a retail banking network, and it is shown that measures of efficiency calculated using the DEA method correlate sig- nificantly with organizational climate as measured by employee’s perceptions of operational and management practices. It is suggested that researchers studying the relationship between organizational effectiveness and the psychology of the workplace should consider using DEA, especially when multiple dimensions of ef- fectiveness are involved. Keywords: data envelopment analysis; DEA; efficiency; organizational effec- tiveness; organizational climate As West, Smith, Feng, and Lawthom (1998) noted, evidence for the relationship between organizational climate and organizational effectiveness is currently some- what limited. Nevertheless, a number of studies conducted in the past 20 years have shown links between climate, or other job-related attitudes, and performance at the organizational and organizational subunit level (e.g., Abbey & Dickson, 1983; Authors’Note: The authors gratefully acknowledge the comments of Larry J. Williams and two anony- mous referees on the first draft of this article. Correspondence may be addressed to Garry Gelade, Business Analytic Ltd, 1, Circus Lodge, Circus Road, London NW8 9JL, UK, or email garry@business-ana- lytic.co.uk. Patrick Gilbert is now at Mercer Human Resource Consulting, Dexter House, 2 Royal Mint Court, London, EC3N 4NA, UK. Organizational Research Methods, Vol. 6 No. 4, October 2003 482-501 DOI: 10.1177/1094428103257364 © 2003 Sage Publications 482 at Universitas Gadjah Mada on June 14, 2015orm.sagepub.comDownloaded from
  • 2. Denison, 1990; Kwok, 1997; Ostroff, 1992; Ryan, Schmit, & Johnson, 1996; West et al., 1998). In most of these studies, climate is implicitly or explicitly regarded as the independ- ent variable and effectiveness as the outcome. Our interest in this article, however, focuses not on the issue of causality or direction of influence but rather on how the dependent variable, effectiveness, is measured. We suggest that previous research in this area has generally failed to recognize that organizational effectiveness is a multidi- mensional variable, the facets of which are interdependent and cannot be adequately assessed in isolation. We are primarily concerned here with the performance and effectiveness of organi- zations (or organizational subunits) rather than of individuals; nevertheless, the proce- dures described in this article are equally applicable to evaluating the effectiveness of groups and individuals. To preserve consistency, we shall refer to the unit of analysis as a “production unit.” Depending on the circumstances, a production unit may be an organization, a group, or an individual. Each of the production units in a given analysis is assumed to use a common set of inputs and produce a common set of outputs but in potentially different amounts. Perhaps the most widely used measure of production unit performance is effi- ciency, usually expressed as the ratio of the amount of output produced to the amount of input (resource) consumed. In practice, however, production units usually consume multiple inputs and produce multiple outputs, and more than one efficiency ratio needs to be measured to give a full picture of a unit’s effectiveness. The efficiency of a restau- rant, for example, might be measured by the number of customers served per waiter, revenue per square foot, controllable expenses as a percentage of sales, and so on. It is unlikely, however, that in any given sample of restaurants, these different effi- ciency measures will all give rise to the same rank ordering of units. This poses a prob- lem to organizational researchers studying climate-effectiveness relationships because the observed correlations are likely to be different for each performance indi- cator studied. For example, Ryan et al.’s (1996) study used eight indicators of employee attitude and 12 business performance indicators (customer satisfaction, staff turnover, and 10 productivity measures). In their main analysis, a single latent variable was constructed to represent employee attitudes, and this was used in 12 separate structural equation models, 1 for each performance indicator. However, conducting multiple separate analyses is vulnerable to capitalization on chance and consequent Type I error. Furthermore, differing results for each indicator may introduce problems of interpretation requiring post hoc explanation. Such diffi- culties are evident in (and acknowledged by) Ryan et al. (1996). For example, of their 10 productivity indicator models, only the model developed for 30-day delinquency showed a significant cross-lagged correlation between attitude and performance; the other 9 productivity models, including that for 60-day delinquency, did not show this pattern. A further difficulty with separate analyses is that each performance indicator repre- sents only one aspect of effectiveness; because of finite limitations on resources, the various aspects of effectiveness are unlikely to be independent, making it difficult to draw conclusions about the overall relationship between climate (or other psychologi- cal variables) and effectiveness. This problem can be acute when production units use different production strategies. For example, Production Unit A may use its inputs to Gelade, Gilbert / DATA ENVELOPMENT ANALYSIS 483 at Universitas Gadjah Mada on June 14, 2015orm.sagepub.comDownloaded from
  • 3. maximize one subset of outputs (O1) at the expense of the rest (O2), whereas Produc- tion Unit B may direct its resources to maximizing O2 at the expense of O1. Hence, cor- relations between climate and individual performance indicators may not be easily interpretable. One approach to overcoming these difficulties is to use a single measure of produc- tive efficiency that encapsulates all the aspects of performance that are deemed rele- vant to the study at hand. This single indicator can then be used as the dependent (or independent) variable of the study. The most obvious way to construct such an indicator is to divide, for each produc- tion unit, a weighted sum of the outputs by a weighted sum of the inputs. In practice, however, this approach has the serious drawback that it requires an a priori decision to be made about how each input and each output should be weighted. In some cases, it may be advisable to generate a weighting scheme by referring all the inputs and out- puts to a common base such as market cost price, but this is not always advisable or practical. Consider, for example, the problem of constructing an overall efficiency measure for university departments whose main products are student degrees and research papers. Although various schemes might be proposed for weighting these two outputs, it is difficult to see how any one scheme could be demonstrated to be uniquely correct; and the observed correlation between climate and performance would vary depending on the particular weighting scheme adopted. Two researchers using the same raw data might thus reach differing conclusions. Charnes, Cooper, and Rhodes (1978) introduced a method for deriving the relative efficiencies of multiple-input multiple-output production units, which they called data envelopment analysis (DEA). The DEA technique combines multiple input and output measures to produce a single efficiency measure for each production unit in the analy- sis. DEA does not require the analyst to devise a weighting scheme and hence avoids the subjectivity associated with simpler forms of consolidation. Furthermore, each production unit is assigned its own unique weighting scheme, thus avoiding the prob- lems that occur when different units in the sample, perhaps operating under different external constraints, adopt different production strategies. Although DEA was explicitly formulated to measure efficiencies in the nonprofit sector, where inputs and outputs cannot easily be expressed using a single scale of eco- nomic value, the power and flexibility of the DEA approach has led to its widespread adoption in the commercial sector too. DEA has been used to study efficiency in, for example, the steel industry (e.g., Ray & Kim, 1995), retailing (e.g., Athanassopoulos, 1995), air transport (e.g., Chan & Sueyoshi, 1991; Ray & Hu, 1997), electricity distri- bution (e.g., Miliotis, 1992), education (e.g., Bessent & Bessent, 1980; Sarrico & Dyson, 2000; Thanassoulis, 1996; Thanassoulis & Dunstan, 1994), banking (e.g., Drake & Howcroft, 1994; Soteriou & Stavrinides, 1997), software engineering and information technology (e.g., Banker & Kemerer, 1989; Lee & Menon, 2000), and health care (e.g., Banker, Conrad, & Strauss, 1986; Chirikos & Sear, 2000). For further examples, the reader is referred to the catalogues of Seiford (1997); Cooper, Seiford, and Tone (1999); and Emrouznejad (2001). In organizational research, DEA has been used to investigate the dependence of organizational effectiveness on, for example, ownership and control structures and organizational form (e.g., Brockett, Cooper, Golden, Rousseau, & Wang, 1998; But- ton & Weyman-Jones, 1992; Daft & Lewin, 1990; Day, Lewin, & Li, 1995; Ferrantino, 484 ORGANIZATIONAL RESEARCH METHODS at Universitas Gadjah Mada on June 14, 2015orm.sagepub.comDownloaded from
  • 4. Ferrier, & Linvill, 1995; Lewin & Minton, 1986; Tankersley, 1990). However, despite the potential relevance of DEA to the psychology of work, organizational behavior researchers and occupational psychologists seem largely to have ignored or dis- counted the technique. A search of PsycINFO uncovered only three articles applying DEA (Bhargava, Dubelaar, & Ramaswami, 1994; Boles, Donthu, & Lohtia, 1995; Chebat, Filiatrault, Katz, & Tal, 1994); none of these were published in an organiza- tional or occupational psychology journal. The purpose of this article is to describe how DEA works and to illustrate its rele- vance to the psychology of organizational effectiveness. First, we provide an introduc- tion to the principles of DEA and give an illustrative example of efficiency evaluation. Next, we develop climate measures for two retail banks. We then use DEA to develop efficiency scores for the two banks, and finally, we examine the relationships between climate and the DEA efficiency measures. The Principles of DEA Since its introduction by Charnes, Cooper, and Rhodes (1978, 1981), DEA has received considerable theoretical attention and undergone much methodological enhancement. This section is restricted to describing the fundamentals of DEA in a nontechnical manner; the reader is referred to the excellent chapters on DEA in Coelli, Rao, and Battese (1998) for a more detailed and rigorous treatment of the basic concepts. To illustrate the principles of the DEA model, consider the performance statistics of players on the USA Professional Golfers Association (PGA) 2002 tour. To be success- ful, a golfer must, among other things, be able to hit the ball a long way (driving dis- tance) and land it accurately on the fairway (driving accuracy). In the PGA statistics, driving distance is the average number of yards per drive, measured on two holes per round in opposite directions to counteract the effects of wind. Drives are measured to the point they come to rest regardless of whether they are in the fairway. Driving accu- racy is the percent of time a player is able to hit the fairway with his tee shot. For the 200 players listed on the PGA’s Web site, the correlation between driving distance and driving accuracy is –.49 (p < .01). Table 1 shows the statistics for the five players with the longest driving distance (big hitters) and the five with the highest driving accuracy (sharp shooters) and for two average players. The efficiency ratios in data Columns 3 and 6 of Table 1 illustrate why ranking is nontrivial when there are multiple indicators of performance. Daly is clearly the big- gest hitter but ranks next to bottom on accuracy; Funk, on the other hand, is the sharp- est shooter but ranks only sixth on distance. Woods, a middling (!) performer on both measures, outperforms both Daly on accuracy and Funk on distance. The differing production strategies of the players result in a negative correlation between the two efficiency measures, driving distance and driving accuracy. A major advantage of DEA is that it enables this type of multidimensional perfor- mance data to be ordered along a single continuum of efficiency without requiring any a priori weighting assumptions. In the general case, DEA efficiencies are estimated by linear programming, but for the two efficiency ratios of our example, the principle of the method can be illustrated graphically. Gelade, Gilbert / DATA ENVELOPMENT ANALYSIS 485 at Universitas Gadjah Mada on June 14, 2015orm.sagepub.comDownloaded from
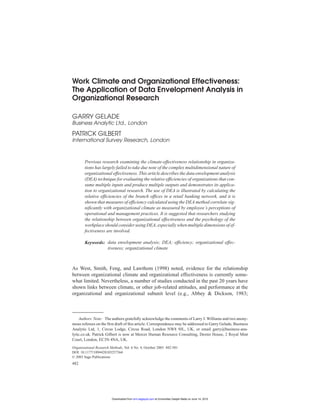
  • 5. First, the driving distance and driving accuracy for each player are plotted against each other, and a segmented boundary line or “efficient frontier” is drawn to envelop the data and projected onto the axes (see Figure 1). Mathematically, the efficient frontier is the convex hull of the data (Farrell, 1957) and defines the limits of the production process in the data sample, that is, all the feasi- ble input-output combinations evident from the data points under consideration. The horizontal and vertical segments of the efficiency frontier represent the economic assumption of “strong disposability.” Under strong disposability, a production unit can always dispose of unwanted outputs without incurring costs. Thus, the perpendicular line drawn from Daly to the x-axis represents the assumption that if Daly can drive 303.6 yards and hit the fairway 58.7% of the time, he can also drive 303.6 yards with- out hitting the fairway at all. A similar argument holds for the horizontal line drawn from Funk to the y-axis. (The data provide no evidence for or against the conjecture that either golfer could increase his performance on one measure by reducing his per- formance on another.) Existing units lying on the efficient frontier (in this case, Daly, Woods, and Funk), or hypothetical units that would lie on the frontier if they existed, are given an effi- ciency of 1. It is clear why Daly is efficient: He is a top performer with respect to one of the two ratios under consideration. However, it is not necessary to be a top performer on any one measure to be efficient under DEA; Woods is 100% efficient without top- ping either the distance or accuracy figures. All the units lying within the frontier are less than totally efficient. It should be noted in this context that DEA does not address efficiency in any absolute sense, because the true limits of production are unknown. If it could be drawn, however, the true efficiency frontier would lie to the right of the sam- ple frontier. The sample frontier thus represents a lower bound of efficient perfor- mance based on the evidence to hand; addition of new data could in theory bring the 486 ORGANIZATIONAL RESEARCH METHODS Table 1 Performance Figures of Selected Professional Golfers’ Association Golfers Number Total Driving of Distance Driving Possible Fairways Accuracy Player Rounds Drives (yards) Distance Fairways Hit % Big hitters John Daly 53 100 30,358 303.6 712 418 58.7 Mathew Goggin 48 96 28,595 297.9 667 411 61.6 Tiger Woods 56 104 30,717 295.4 731 500 68.4 Boo Weekley 43 86 25,399 295.3 599 409 68.3 Dennis Paulson 69 136 40,151 295.2 962 564 58.6 Sharp shooters Fred Funk 88 174 47,714 274.2 1,230 991 80.6 Jim Furyk 64 123 33,524 272.6 871 674 77.4 Fulton Allem 51 102 27,202 266.7 713 552 77.4 Scott Verplank 75 140 37,331 266.7 996 769 77.2 Heath Slocum 72 142 38,180 268.9 1,003 773 77.1 Average players Jose Maria Olazabal 54 104 28,275 271.9 727 432 59.4 Esteban Toledo 85 159 41,952 263.8 1,131 796 70.4 at Universitas Gadjah Mada on June 14, 2015orm.sagepub.comDownloaded from
  • 6. sample boundary closer to the true boundary, in which case further inefficiencies would appear. In an organizational context, DEA can thus be seen as a technique for determining relative levels of efficiency within a finite sample, based on benchmarks of existing best practice. For the purposes of clarifying the geometrical interpretation of DEA, Figure 2 shows a simplified version of the data. One difference between the players evident from Figure 2 is that each favors a different performance mix m, defined as the ratio of distance to accuracy; Daly (m = 5.2) goes for distance rather than accuracy, Funk and Toledo place more emphasis on hitting the fairway than on distance (m = 3.4 and 3.7, respectively), whereas Woods (m = 4.3) and Olazabel (m = 4.6) have, by comparison, a balanced strategy. The geometry of Figure 2 implies that all hypothetical golfers that lie on the line from the origin through Olazabel would also have a performance mix of 4.6. Thus, by projecting a line (OV) from the origin through Olazabel to the frontier, we can construct a virtual golfer (V) that were he to exist would have the same balance between distance and accuracy as Olazabel but would have an efficiency of 1. The driving distance of this virtual golfer can be determined by dropping a line from V to the x-axis, which produces a value of 298 yards. Similarly, by projecting horizontally Gelade, Gilbert / DATA ENVELOPMENT ANALYSIS 487 Figure 1: Efficient Frontier for Professional Golfers’ Association Golfers at Universitas Gadjah Mada on June 14, 2015orm.sagepub.comDownloaded from
  • 7. from V to the y-axis, we find V’s driving accuracy to be 65%. In DEA studies, V’s per- formance figures are referred to Olazabel’s “targets.” Dividing Olazabel’s driving distance by V’s driving distance (or dividing his driv- ing accuracy by V’s driving accuracy) yields the same value, to within rounding error, of 0.91. In DEA terminology, this value is known as Olazabel’s “technical efficiency” (TE). It is apparent from Figure 2 that the radial projections for Olazabel and Toledo fall within different segments of the frontier. In DEA terminology, players Olazabel and Toledo are said to have different “peers.” The peers for Olazabel are Woods and Daly and the peers for Toledo are Woods and Funk. The virtual efficient players with which Olazabel and Toledo are compared (V and V′, respectively) are linear combinations of their relevant peers; this means we can express the target for an inefficient player by identifying his peers and specifying their weightings. Thus, if the performance of Olazabel’s peers are represented, respectively, by the column vectors p1 and p2 then Olazabel’s target t can be written: t = w1 × p1 + w2 × p2, where w1 and w2 are peer weights. 488 ORGANIZATIONAL RESEARCH METHODS Figure 2: Determining Efficiencies of Inefficient Golfers at Universitas Gadjah Mada on June 14, 2015orm.sagepub.comDownloaded from
  • 8. For the golfing data, it can be shown that Olazabel’s peer weights are .66 (Woods) and .34 (Daly). (That is, V’s driving distance can be expressed as .66 × 295.4 + .34 × 303.6 = 298 yards, and V’s driving accuracy can be expressed as .66 × 68.4 + .34 × 58.7 = 65%). Similarly, Toledo’s peer weights are .42 (Woods) and .58 (Funk). In a complex efficiency evaluation, identifying the peers and the peer weights of an inefficient unit is often of practical importance, allowing relevant examples of best practice to be identi- fied and providing clues to sources of inefficiency and tactics for improvement. For analyses involving more than two dimensions of performance, efficiency esti- mates are calculated by linear programming methods. These are described next. In DEA terminology, a production unit is called a decision-making unit (DMU). Following Coelli, Rao, and Battese (1998, p. 140) let each of N DMUs consume K inputs and produce M outputs and let xi and yi be column vectors representing, respec- tively, the inputs and outputs for the ith DMU. Let v be a K × 1 vector of input weights, and u be an M × 1 vector of input weights. Then the efficiency Ei of the ith DMU can be written as follows: Ei = u′yi/v′xi . In the DEA model, weights for the ith DMU are chosen to maximize its efficiency, subject to the restriction that no other DMU in the evaluation sample using the same weights would have an efficiency greater than one. This allows each DMU to have a unique set of weights—those under which its efficiency is maximized—and avoids the problem of enforcing a common set of weights on all the DMUs. This leads to the fol- lowing fractional program for the ith DMU: Maxu, v (u′yi /v′xi ), Subject to u′yj /v′xj ≤ 1, j = 1, 2 . . . N u, v ≥ 0. For all u in u, all v in v. This program is not solvable but can be made so by noting that in maximizing the objective function, it is the ratio of the numerator and the denominator that matters and not their individual values. By constraining the denominator to a fixed quantity (e.g., 1) and maximizing the numerator, we achieve the same effect. This is the standard Charnes-Cooper transformation of Linear fraction programming (Charnes & Cooper, 1962) and leads to the following, solvable, linear programming formulation: Maxu , vu′yi , Subject to Bv′xi = 1, u′yj – v′xj ≤ 0, j = 1, 2 . . . N u, v ≥ 0. For all u in u, all v in v. It is important to see that the efficiency evaluation requires solving N linear pro- grams, one for each DMU in the data set. If the efficiency of a DMU turns out to be 1, it isontheefficientfrontier;ifitturnsouttobelessthan1,itistosomedegreeinefficient. A computer program designed to calculate DEA efficiencies using linear program- ming (DEAP) (Coelli, 1996) was used to process the data in Table 1. The input was the Gelade, Gilbert / DATA ENVELOPMENT ANALYSIS 489 at Universitas Gadjah Mada on June 14, 2015orm.sagepub.comDownloaded from
  • 9. number of rounds, and the outputs were the expected total distance based on the driv- ing distance assuming 18 drives per round and the expected total number of fairways hit, based on 18 fairways per round. The results are shown in Table 2. For ease of com- parison with Table 1, the targets produced by DEAP for the total distance and the total fairways hit have been converted back into an average driving distance and a percent- age accuracy. As would be expected from the preceding discussion, Funk, Woods, and Daly turn out to be the only fully efficient players. Note that because the data in Table 2 were derived from total driving and fairway scores rather than averages, the peer weights differ from those derived for Figure 2. (To derive the weights for the total scores, the weights for the average scores are multiplied by the ratio of rounds played by each player, e.g., for Toledo, the peer weight for Woods is .42 × 85/56 = .64.) So far, efficiencies have been treated on the assumption that inputs and outputs are linearly related, which is known as the “constant returns to scale” (CRS) assumption. In practice, this assumption may not be realistic; economies of scale may confer opera- tional advantages on large DMUs, or alternatively, the converse may be true and dis- economies of scale may give the advantage to small DMUs. In such cases, it may be desirable to separate technical efficiency from efficiency (or inefficiency) that is purely attributable to the scale of operation. The variable returns to scale (VRS) model developed by Banker, Charnes, and Cooper (1984) achieves this; in this formulation, an additional constraint is added to the CRS linear program, which ensures that each DMU is compared only with DMUs of similar size. In the VRS formulation, the scale effect for a DMU may be in one of two directions; a DMU for which increasing inputs would result in a proportionally greater increase in outputs is said to be operating under “increasing returns to scale,” and a DMU for which increasing inputs would result in a proportionally smaller increase in outputs is said to be operating under “decreasing returns to scale.” Under the VRS model, technical efficiency (TE) is regarded as the product of two components, the ‘pure’ technical efficiency (PTE) and the scale effi- ciency (SE); that is, TE = PTE × SE. VRS is currently the most popular form of DEA (Coelli et al., 1998). 490 ORGANIZATIONAL RESEARCH METHODS Table 2 Data Envelopment Analysis Efficiencies of Selected Professional Golfers’ Association Golfers Peer Weight Technical Targets Player Funk Woods Daly Efficiency (%) Distance Accuracy Fred Funk 1.00 1.000 274.2 80.6 Jim Furyk .62 .17 .983 277.4 78.8 Fulton Allem .55 .05 .968 275.4 79.9 Scott Verplank .80 .09 .968 275.6 79.8 Heath Slocum .73 .14 .973 276.5 79.3 Esteban Toledo .56 .64 .932 283.0 75.5 Tiger Woods 1.00 1.000 295.4 68.4 Boo Weekley .76 .01 .999 295.5 68.3 Mathew Goggin .31 .58 .991 300.7 62.2 Jose Maria Olazabal .64 .34 .912 298.2 65.1 John Daly 1.00 1.000 303.6 58.7 Dennis Paulson .17 1.12 .976 302.5 60.0 at Universitas Gadjah Mada on June 14, 2015orm.sagepub.comDownloaded from
  • 10. Second, we have also assumed that the purpose of the efficiency evaluation is to understand the potential for maximizing the outputs from a given quantity of inputs (output-oriented DEA). The alternative characterization (input-oriented DEA) is focused on decreasing inputs while maintaining a constant level of outputs; typical applications of input-oriented DEA are cost reduction and downsizing. In the CRS model, these orientations lead to the same numerical efficiencies, but under the VRS assumption, input-oriented and output-oriented efficiencies may differ. In practical situations, efficiencies may be affected by environmental variables that are not under the control of the production unit and that cannot be treated like conven- tional inputs. For example, a bank branch might be located in a city center, a small town, or a rural area, placing different constraints on the maximum efficiency attain- able. Coelli et al. (1998, p. 166) have discussed various methods for accommodating such variables in a DEA analysis and recommended a two-stage method. In the first stage, a conventional DEA analysis is conducted, omitting the environmental vari- ables, and in the second stage, the efficiency scores are regressed on to the environ- mental variables. The influence of the environmental variables can be assessed by means of a conventional significance test and, if necessary, the efficiency scores adjusted in the light of the regression equation. Limitations of space preclude discussion here of the many refinements to the basic DEA model that have been suggested in the literature and topics such as weighting restrictions and allocative and price efficiencies. Charnes, Cooper, Lewin, and Seiford (1995) presented an introduction and overview of the field, and Seiford’s (1996) review discusses more advanced models. The most comprehensive introductory treat- ment for the student, researcher, and practitioner is the text by Cooper et al. (1999), which comes packaged with a DEA computer program and contains an extensive DEA bibliography. It is important to briefly mention some of the limitations of DEA. First, DEA is sen- sitive to outliers and to measurement error, which may influence the shape of the effi- cient frontier, and second, the more inputs and outputs in the model, the more DMUs will emerge on the frontier; this places a lower limit on the sample size for an effective DEA analysis. Because the production frontier in DEA is specified without any parametric struc- ture for the distribution of deviations, the statistical properties of its estimators cannot be defined using standard methods. Some organizational psychologists have therefore tended to dismiss DEA on the grounds that it lacks procedures for drawing statistical inferences. Recent developments in the area of DEA statistical inference now render such views out of date, and several options are presently available for statistical treat- ment of DEA and other frontier-based methods. One approach is due to Banker (1993, 1996), who has shown that for certain assumed distributions of the DEA efficiency estimator and under certain conditions of independence, the difference in the efficien- cies of two sets of production units may be assessed by an F test. Extending this rea- soning, Banker also suggested how tests for increasing or decreasing returns to scale and tests of model specification could be performed. Importantly, Simar and Wilson (1998, 2000a, 2000b) have developed statistically consistent bootstrap methods that allow efficiency estimators to be corrected for bias and confidence intervals for effi- ciency measures to be determined for the general multi-input multi-output DEA case. Finally, an alternative to DEA is the stochastic frontier approach, in which instead of using a linear technology to define the production function, a parametric stochastic Gelade, Gilbert / DATA ENVELOPMENT ANALYSIS 491 at Universitas Gadjah Mada on June 14, 2015orm.sagepub.comDownloaded from
  • 11. function is used (see, e.g., Greene, 1992, for a review of stochastic frontier methods). Unlike DEA, however, these stochastic methods are presently limited to single output problems. Derivation of Climate Measures Organizational climate has been variously defined as “a relatively enduring quality of the internal environment of the organization that (a) is experienced by its members, (b) influences their behaviour and (c) can be described in terms of values of a particular set of characteristics” (Taguiri, 1968, p. 27); “the ‘ambience’of an organization . . . pat- terns of influence on employee (member) behavior, generated by prevailing environ- mental conditions in an organization” (Sells & James, 1987); and “a relatively endur- ing characteristic of an organization which . . . embodies members’ collective perceptions about their organization” (Moran & Volkwein, 1992). Cook, Hepworth, Wall, and Warr (1981, p. 172) noted that although organizational climate is measured through individual perceptions, it is not an individual-level vari- able, and the appropriate unit of analysis is the organization or organizational subunit. When individual perceptions refer to the “social setting or context of which the person is a part” (Rousseau, 1988, p. 140) they constitute a measure of “psychological cli- mate” (James, 1982; Joyce & Slocum, 1984; Rousseau, 1988); to obtain climate scores at the appropriate level of analysis, it is thus necessary to aggregate individual employee scores (i.e., psychological climates) to the branch level. Aggregation of individual scores to a larger group is common in organizational research, and Glick (1985) has argued that most perceptual measures of climate are sufficiently reliable to justify such aggregation. However, aggregation does raises methodological issues, and agreement among respondents is a concern (e.g., Guion, 1973; Payne, Fineman, & Wall, 1976); it has been suggested that climate measures should not be aggregated to group level unless there is a minimum degree of consensus among the respondents in the group (James, 1982; Joyce & Slocum, 1984). For the present analyses, the level to which climate was aggregated was determined by the level for which effectiveness indicators were available. For the first data set (Bank A), this was the branch (n = 204). Climate scores were derived from responses to a broad-based employee survey questionnaire containing 138 items, which was com- pleted by all grades of branch staff. This survey was administered in October 1998 and was designed to monitor employee opinion, and not for the purposes of the present study. The criterion for inclusion in the analysis was that a branch returned a minimum of 10 questionnaires in the bank’s employee opinion survey. The total number of ques- tionnaires analysed was 5,120. For this data set, we chose to represent climate by a single index of the branch work environment; items were selected for this measure on the basis of their intraclass corre- lation coefficient, ICC2 (Bartko, 1976; Shrout & Fleiss, 1979).1 ICC2 is the reliability of the group mean score that is created when individual scores are aggregated and increases with increasing group consensus, taking a maximum value of 1. It may be conceptualized as the expected correlation between the mean ratings of the same tar- gets by different random samples of judges (Bartko, 1976). In this application, we would expect items measuring branch-level characteristics to have higher ICC2 values than items tapping individual-level attitudes. Items were included in the branch index 492 ORGANIZATIONAL RESEARCH METHODS at Universitas Gadjah Mada on June 14, 2015orm.sagepub.comDownloaded from
  • 12. if their ICC2 was greater than or equal to .7, a commonly accepted minimum level for reliability. Fourteen items met the ICC2 criterion and were summed to give an overall score (average interitem correlation = .52, standardized item alpha = .93). Sample items in the index were as follows: “My branch/department operates efficiently” (ICC2 = .82), and “Staff are treated with respect here, regardless of their job” (ICC2 = .70).2 The ICC2 for the 14-item index was .83. For Bank B, the production unit and level of aggregation was the region (n = 79). Climate scores were derived from responses to a 50-item opinion survey, designed to monitor employee opinion rather than for this study. This survey was administered in November1998,andusablequestionnaireswerereturnedby16,301retailbankstaff. Here we followed a factor-analytic route to derive a multidimensional measure of climate. Principal components extraction recovered 10 factors with eigenvalues greater than 1. As is well known, this criterion tends to overestimate the number of real factors in the data, and a Velicer (1976) MAP test suggested only six real factors. Oblimin rotation of the six-factor solution failed to produce an interpretable solution, however, and we finally chose an eight-factor solution explaining 58.5% of the vari- ance prior to rotation. Regression factor scores were calculated for each individual for each factor. At regional level, seven factors had an ICC2 of .7 or greater and were retained for subsequent analysis. Using DEA to Determine Bank Branch Efficiencies DEA is well established in the banking sector. For example, Barr, Seiford, and Siems (1993) developed a DEA model that used inputs such as staff numbers, fixed assets, and interest and noninterest expenses and three financial outputs, deposits, earning assets, and interest income. In this study, the production units were entire banking organizations in the United States, and the technical efficiency scores were predictive of institutional survival over a 5-year period. In contrast to the United States, the U.K. retail banking sector consists of a handful of large banking institu- tions, each operating its own national branch network. In the study described below, the production units are organizational subunits (branches and regions of banks) rather than entire banking organizations. The production units for Bank A were 204 branches for which climate measures had been derived. The outputs for Bank A’s DEA model (Model 1) were five measures of branch sales activity and one measure of branch customer satisfaction. The sales measures pertained to activity over the period from October 1998 to March 1999 and were as follows: the number of new current accounts, the number of new loans, the number of new youth accounts, the number of new savings accounts, and the number of new customers. Customer satisfaction was calculated by multiplying each branch’s average customer satisfaction score for the period March 1998 to March 1999 by the number of active customers. (Customer satisfaction is reported as an annual moving average, and a value covering the same period as the sales data was not available.) The input for Model 1 was the average number of branch staff (full-time equivalent) in the period from October 1998 to March 1999. For Bank B, the production units were the 79 regions. Different performance statis- tics were available for this organization, and the outputs for Bank B’s DEA model Gelade, Gilbert / DATA ENVELOPMENT ANALYSIS 493 at Universitas Gadjah Mada on June 14, 2015orm.sagepub.comDownloaded from
  • 13. (Model 2) were 1999 figures for consumer lending (£million), the number of insurance policies sold, the number of new investments, and a financial commission figure (£). The input was the number of staff in the region. Correlations between the individual efficiency ratios for each data set are shown in Tables 3a and 3b. Both models were analyzed by DEAP using VRS, under output ori- entation. The results are shown in Table 4. The moderate values of skew and kurtosis suggest that parametric statistical proce- dures can be applied to the technical efficiency scores without introducing unaccept- able levels of bias. However, a histogram of the technical efficiencies for Bank A did indicate a clearly bimodal distribution. A plausible place to look for differences in staff efficiency is differences in working practices; and in fact, it turns out that 84 Bank A branches are supported by centralized 494 ORGANIZATIONAL RESEARCH METHODS Table 3a Correlations Between Efficiency Ratios for Bank A (N = 204) e1 e2 e3 e4 e5 e1: New customers per headcount e2: New loans per headcount .36** e3: New youth accounts per headcount .52** .13 e4: New current accounts per headcount .89** .33** .11 e5: Total customer satisfaction per headcount .63** .18** .74** .37** e6: New savings accounts per headcount .82** .31** .38** .66** .45** *p ≤ .05. **p ≤ .01. ***p ≤ .001. Table 3b Correlations Between Efficiency Ratios for Bank B (N = 79) e7 e8 e9 e7: Domestic insurance policies per headcount e8: New investments per headcount .31** e9: Consumer Lending per headcount .51*** .24* e10: Commission per headcount .04 –.23* –.19 *p ≤ .05. **p ≤ .01. ***p ≤ .001. Table 4 Data Envelopment Analysis Results Technical Efficiency Percentage of DMUs Standard Bank Model Mean Minimum Deviation Skew Kurtosis FRNTa DRSb IRSc A 1 .644 .300 0.19 0.43 –0.69 6.9 29.9 63.7 B 2 .866 .683 0.10 –0.12 –1.14 15.2 24.0 65.8 Note: DMU = decision-making unit. a. Percentage of DMUs on efficiency frontier. b. Percentage of DMUs with decreasing return to scale. c. Percentage of DMUs with increasing return to scale. at Universitas Gadjah Mada on June 14, 2015orm.sagepub.comDownloaded from
  • 14. service centers that handle routine transaction processing for the branches in their area, and the remaining 120 branches are nonsupported. We compared the mean effi- ciencies for service center supported and non–service center–supported branches; the mean technical efficiency for supported branches was .75, and the mean technical effi- ciency for nonsupported branches was .57. The difference was highly significant on a one-way ANOVA, F(1, 202) = 62.7, p < .001. In supported branches, staff are freed from routine processing tasks, so the greater efficiency of these branches in sales and service delivery is exactly what would be expected. To eliminate the effects of service center support, which place an upper limit on the efficiency that nonsupported branches can achieve, we standardized Bank A’s efficiency measures within branch type for the purposes of subsequent analyses. Relationships Between Work Climate and Effectiveness Measures In this section, we examine the correlations between work climate and three indica- tors of production unit effectiveness. The effectiveness indicators we consider are indi- vidual efficiency ratios, an additive scale of efficiency ratios, and DEA technical effi- ciency. The results are shown in Table 5. For each data set and DEA model in Table 5, the four columns under the Individual Efficiency Ratios heading report, respectively, the number of efficiency ratios, n (because there is only one model input, n is equal to the number of model outputs); the average of the n correlations between the climate measure and the n individual effi- ciency ratios; the minimum and maximum of the n correlations; and the number of sig- nificant correlations. The next two columns of Table 5 show the results for an additive efficiency scale formed by standardizing the individual efficiency ratios and then sum- ming them. The first column in this section of the table reports the standardized item alpha for the additive scale, and the next column reports its climate correlation. Last, we report the climate correlations with DEA technical efficiency. It is clear from Table 5 that the climate correlations for individual efficiency ratios are difficult to interpret and provide a rather uncertain basis for drawing any firm con- clusions about the overall relationship between work climate and production unit effectiveness. For example, for Bank A (all branches), the climate correlations range between .06 and .22, and of the six correlations, two are significant and four are not; furthermore, Steiger’s (1980) quadratic form asymptotic χ2 test for equality of correla- tions shows there are significant differences between the six correlations (χ2 = 13.1, df = 6, p < .05). This suggests that some overall measure of production unit effectiveness should be examined. For Model 1, such a measure can be formed by summing the six standard- ized efficiency ratios, which produces an additive measure of overall efficiency whose alpha reliability is .84. However, for Model 2, summing the individual efficiency ratios produces a low reliability scale (alpha = .34). In this case, construction of an additive efficiency scale is not justified; for this reason, we have chosen not to report its correla- tions with climate. Here, the DEA estimate of technical efficiency provides an attrac- tive alternative measure of overall production unit effectiveness. Gelade, Gilbert / DATA ENVELOPMENT ANALYSIS 495 at Universitas Gadjah Mada on June 14, 2015orm.sagepub.comDownloaded from
  • 15. 496 Table 5 Summary of Correlations Between Climate Measures and Efficiency Measures Individual Efficiency Ratios Dataset n DEA Model Climate Measure no r-avg rmin - rmax sig α ra rt Bank A All branches 204 1 Climate Index 6 .14 .06 - .22 2 .84 .20** .21** Non–service center branches 120 Climate Index .12 –.01 - .21 2 .18† .15† Service center branches 84 Climate Index .16 .01 - .24 3 .24* .29** Bank B Regions 79 2 Participative Management 4 .15 .10 - .20 0 .34 .— .21† Performance Management .02 –.13 - .15 0 .— .07 Team Climate .09 –.01 - .19 0 .— .13 Organizational Satisfaction .13 .04 - .23 1 .— .26* Intrinsic Job Satisfaction .07 –.07 - .20 0 .— .11 Extrinsic Rewards .13 –.02 - .28 1 .— .21† Training and Resources .09 .04 - .13 0 .— .13 †p < .10. *p < .05. **p < .01. Note: N = number of production units; no = number of model outputs; r-avg = average of the n climate correlations; rmin-rmax = minimum and maximum of the n climate correlations;sig = number of significant climate correlations;α = standardized item alpha for additive efficiency scale;ra = climate correlation for additive efficiency scale; rt = climate correlation for technical efficiency. atUniversitasGadjahMadaonJune14,2015orm.sagepub.comDownloadedfrom
  • 16. Discussion Expressing production unit effectiveness in terms of technical efficiency has sev- eral advantages. First, each unit may be described by a single indicator of overall effectiveness, which simplifies the interpretation of climate-effectiveness correlations. We do not wish to imply that measures of production unit effectiveness should always be consoli- dated into a single indicator such as technical efficiency, because there may be instances when doing so might obscure specific relationships of substantive interest. Consolidating effectiveness measures would not be advisable when, for instance, there are a priori reasons to expect these measures to have differing relationships to other variables, such as job satisfaction. However, if the benefits of a single indicator are accepted, there remains the ques- tion of how it should be constructed. Organizational psychologists are familiar with the concept of additive rating scales based on true score theory and the advantages of increased reliability that these scales confer, and it is natural—but not necessarily jus- tified—to suppose that an additive scale of efficiency ratios could be constructed to measure overall effectiveness. In practice, it may not always make much difference whether technical efficiency or an additive efficiency scale is used; for Model 1, the correlation between technical effi- ciency and the additive efficiency scale is .81, and there are no substantial differences in the correlations of either with climate. Yet it is still the case that additive scales are not always appropriate for measuring production unit performance. Because each pro- duction unit has finite resources, increasing one type of efficiency may require decreasing another, leading to negative correlations between efficiency ratios. The efficiency correlations reported in Table 3b show that this is more than a theoretical possibility. Thus, individual efficiency ratios are not necessarily independent indica- tors of an underlying efficiency factor in the same way that questionnaire responses are independent indicators of, say, an underlying climate factor. This poses a dilemma to a researcher studying a model such as Model 2 reported here; results based on uncombined efficiencies may be inconclusive and subject to Type I errors of interpretation, yet an additive scale of efficiencies may be psychometrically—and substantively—invalid. In either case, whatever conclusions the researcher might draw about overall effectiveness would be subject to methodolog- ical criticism. In contrast to this, the way in which performance measures are combined in DEA rests on strong theoretical foundations of production economics, allowing overall effi- ciency to be computed in circumstances in which additive scales cannot be legiti- mately constructed. The results presented here also demonstrate that technical efficiency describes an attribute of operational effectiveness that is associated with the perceived work climate of the production unit and show the feasibility of using DEA methods in a psychologi- cal context. This suggests the possibility of building a bridge between the disciplines of operational research and organizational psychology, which may yield further insights into the relationship between the economic and psychological aspects of pro- duction. Gelade, Gilbert / DATA ENVELOPMENT ANALYSIS 497 at Universitas Gadjah Mada on June 14, 2015orm.sagepub.comDownloaded from
  • 17. Notes 1. Several considerations dictated using the intraclass correlation coefficient ICC2 as a crite- rion for item selection in preference to the more commonly used measure of agreement rwg (James, Demaree, & Wolf, 1984). First, rwg has been, and to some extent remains, the subject of methodological controversy (James, Demaree, & Wolf, 1993; Lindell & Brandt, 1997; Schmidt & Hunter, 1989); second, James et al. (1984, p. 95) counseled against using rwg for single items because the obtained values are strongly dependent on the choice of reference distribution; and finally, the empirical values of the single-item rwgs we obtained (using a uniform reference dis- tribution) seemed difficult to rationalize. To illustrate this last point, there were two survey items concerning reasonably concrete attributes of the branch environment (overall, the physical working conditions at my location are satisfactory—e.g., ventilation, temperature, space to work—and performance reviews are conducted on a regular and timely basis in my branch) that might intuitively be expected to produce a higher degree of consensus among the respondents than items requiring judgments of a more subjective nature. The ICC2 values for these two items were, respectively, .82 and .77 (the 2nd and 7th highest of the 138 ICC2 values), but the corresponding rwg valueswere.18and.27(the129thand113thhighest ofthe138 rwg values). 2. A full list of items is available upon request. References Abbey, A., & Dickson, J. W. (1983). R&D work climate and innovation in semiconductors. Academy of Management Journal, 26, 362-368. Athanassopoulos, A. D. (1995). Performance improvement decision aid systems (PIDAS) in re- tailing organizations using data envelopment analysis. Journal of Productivity Analysis, 6, 153-170. Banker, R. D. (1993, October). Maximum likelihood, consistency and data envelopment analysis: A statistical foundation. Management Science, pp. 1265-1273. Banker, R. D. (1996). Hypothesis tests using Data Envelopment Analysis. Journal of Productiv- ity Analysis, 7, 139-159. Banker, R. D., Charnes, A., & Cooper, W. W. (1984). Some models for estimating technical and scale inefficiencies in data envelopment analysis. Management Science, 30, 1078-1092. Banker, R. D., Conrad, R. F., & Strauss, R. P. (1986). A comparative application of DEA and translog methods: An illustrative study of hospital production. Management Science, 32, 30-44. Banker, R. D., & Kemerer, C. F. (1989). Scale economies in new software development. IEEE Transactions on Software Engineering, 15, 1199-1205. Barr, R. S., Seiford, L. M., & Siems, T. F. (1993). An envelopment-analysis approach to measur- ing the managerial quality of banks. Annals of Operations Research, 45, 1-19. Bartko, J. J. (1976). On various intraclass correlation reliability coefficients. Psychological Bul- letin, 83, 762-765. Bessent, A., & Bessent, W. (1980). Determining the comparative efficiency of schools through data envelopment analysis. Educational Administration Quarterly, 16, 57-75. Bhargava, M., Dubelaar, C., & Ramaswami, S. (1994). Reconciling diverse measures of perfor- mance: A conceptual framework and test of a methodology. Journal of Business Research, 31, 235-246. Boles, J. S., Donthu, N., & Lohtia, R. (1995). Salesperson evaluation using relative performance efficiency: The application of data envelopment analysis. Journal of Personal Selling & Sales Management, 15, 31-49. Brockett, P. L., Cooper, W. W., Golden, L. L., Rousseau, J. J., & Wang, Y. (1998). DEA evalua- tions of the efficiency of organizational forms and distribution systems in the US property andliability insurance industry. International Journal ofSystems Science,29,1235-1247. 498 ORGANIZATIONAL RESEARCH METHODS at Universitas Gadjah Mada on June 14, 2015orm.sagepub.comDownloaded from
  • 18. Button, K. J., & Weyman-Jones, T. G. (1992). Ownership structure, institutional organization and measured X-efficiency. AEA Papers and Proceedings, 82, 439-445. Chan, P. S., & Sueyoshi, T. (1991). Environmental change, competition, strategy, structure and firm performance: An application of data envelopment analysis in the airline industry. In- ternational Journal of Systems Science, 22, 1625-1636. Charnes, A., & Cooper, W. W. (1962). Programming with linear fractional functionals. Naval Research Logistics Quarterly, 9, 181-186. Charnes, A., Cooper, W. W., Lewin, A. Y., & Seiford, L. M. (1995). Data envelopment analysis. Boston: Kluwer. Charnes, A., Cooper, W. W., & Rhodes, E. (1978). Measuring the efficiency of decision making units. European Journal of Operational Research, 2, 429-444. Charnes, A., Cooper, W. W., & Rhodes, E. (1981). Evaluating program and managerial effi- ciency: An application of data envelopment analysis to program follow through. Manage- ment Science, 27, 668-697. Chebat, J., Filiatrault, P., Katz, A., & Tal, S. M. (1994). Strategic auditing of human and financial resource allocation in marketing: An empirical study using data envelopment analysis. Journal of Business Research, 31, 197-208. Chirikos, T. N., & Sear, A. M. (2000). Measuring hospital efficiency: A comparison of two ap- proaches. Health Services Research, 34, 1389-1408. Coelli, T. J. (1996). A guide to DEAP Version 2.1: A data envelopment analysis (computer) pro- gram (CEPA Working Paper 96/8). Armidale, New South Wales, Australia: University of New England, Department of Econometrics. Coelli, T., Rao, D. S. P., & Battese, G. E. (1998). An introduction to efficiency and productivity analysis. Boston: Kluwer Academic. Cook, J. D., Hepworth, S. J., Wall, T. D., & Warr, P. B. (1981). The experience of work. London: Academic Press. Cooper, W. W., Seiford, L. M., & Tone, K. (1999). Data envelopment analysis—A comprehen- sive text with models, applications, references and DEA solver software. Boston: Kluwer Academic. Daft, R. L., & Lewin, A. Y. (1990). Can organization studies begin to break out of the normal sci- ence straitjacket? An editorial essay. Organization Science, 1, 1-9. Day, D. L., Lewin, A. Y., & Li, H. (1995). Strategic leaders or strategic groups: A longitudinal data envelopment analysis of the U. S. brewing industry. European Journal of Operational Research, 80, 619-638. Denison, D. R. (1990). Corporate culture and organizational effectiveness. New York: John Wiley. Drake, L., & Howcroft, B. (1994). Relative efficiency in the branch network of a UK Bank: An empirical study. Omega: International Journal of Management Science, 22, 83-90. Emrouznejad, A. (2001). An extensive bibliography of data envelopment analysis (DEA). Coventry, UK: University of Warwick, Business School. Retrieved September 16, 2002, from http://www.deazone.com/bibliography/index.htm Farrell, M. J. (1957). The measurement of productive efficiency. Journal of the Royal Statistical Society, Series A, 120(Part 3), 253-290. Ferrantino, M. J., Ferrier, G. D., & Linvill, C. B. (1995). Organizational form and efficiency: Ev- idence from Indian sugar manufacturing. Journal of Comparative Economics, 21, 29-53. Glick, W. H. (1985). Conceptualizing and measuring organizational and psychological climate: Pitfalls in multi-level research. Academy of Management Review, 10, 606-616. Greene, W. H. (1992). The econometric approach to efficiency analysis. In H. O. Fried, C. A. K. Lovell, & S. S. Smith (Eds.), The measurement of productive efficiency: Techniques and ap- plications. New York: Oxford University Press. Guion, R. M. (1973). A note on organizational climate. Organizational Behavior and Human Performance, 9, 120-125. Gelade, Gilbert / DATA ENVELOPMENT ANALYSIS 499 at Universitas Gadjah Mada on June 14, 2015orm.sagepub.comDownloaded from
  • 19. James, L. R. (1982). Aggregation bias in estimates of perceptual measures. Journal of Applied Psychology, 67, 219-229. James, L. R., Demaree, R. G., & Wolf, G. (1984). Estimating within-group interrater reliability with and without response bias. Journal of Applied Psychology, 69, 85-98. James, L. R., Demaree, R. G., & Wolf, G. (1993). rwg : An assessment of within-group interrater agreement. Journal of Applied Psychology, 73, 306-309. Joyce, V. F., & Slocum, J. W. (1984). Collective climate: Agreement as a basis for defining ag- gregate climate in organizations. Academy of Management Journal, 27, 721-742. Kwok, L. (1997). Relationships among satisfaction, commitment, and performance: A group- level analysis. Applied Psychology: An International Review, 46, 199-206. Lee, B., & Menon, N. M. (2000). Information technology value through different normative lenses. Journal of Management Information Systems, 16, 99-119. Lewin, A. Y., & Minton, J. W. (1986). Determining organizational effectiveness: Another look, and an agenda for research. Management Science, 32, 514-538. Lindell, M. K., & Brandt, C. J. (1997). Measuring interrater agreement for ratings of a single tar- get. Applied Psychological Measurement, 21, 271-278. Miliotis, P. A. (1992). Data envelopment analysis applied to electricity distribution districts. Journal of the Operational Research Society, 43, 549-555. Moran, E. T., & Volkwein, J. F. (1992). The cultural approach to the formation of organizational climate. Human Relations, 45, 19-47. Ostroff, C. (1992). The relationship between satisfaction, attitudes, and performance: An orga- nizational level analysis. Journal of Applied Psychology, 77, 963-974. Payne, R. L., Fineman, S., & Wall, T. D. (1976). Organizational climate and job satisfaction: A conceptual synthesis. Organizational Behavior and Human Performance, 16, 45-62. Ray, S. C., & Hu, X. W. (1997). On the technically efficient organization of an industry: A study of US airlines. Journal of Productivity Analysis, 8, 5-18. Ray, S. C., & Kim, H. J. (1995). Cost efficiency in the US steel industry: A nonparametric analy- sis using data envelopment analysis. European Journal of Operational Research, 80, 654- 671. Rousseau, D. M. (1988). The construction of climate in organizational research. In C. L. Cooper & I. Robertson (Eds.), International review of industrial and organizational psychology (pp. 137-158). London: Wiley. Ryan, A. M., Schmit, M. J., & Johnson, R. (1996). Attitudes and effectiveness: Examining rela- tions at an organizational level. Personnel Psychology, 49, 853-882. Sarrico, C. S., & Dyson, R. G. (2000). Using DEA for planning in UK universities—An institu- tional perspective. Journal of the Operational Research Society, 51, 789-800. Schmidt, F. L., & Hunter, J. E. (1989). Interrater reliability coefficients cannot be computed when only one stimulus is rated. Journal of Applied Psychology, 74, 368-370. Seiford, L. M. (1996). Data envelopment analysis: The evolution of the state of the art (1978- 1995), Journal of Productivity Analysis, 7, 99-137. Seiford, L. M. (1997). A bibliography for data envelopment analysis (1978-1996). Annals of Operations Research, 73, 393-438. Sells, S. B., & James, L. R. (1987). Organizational climate. In J. L. Nesselroade & R. B. Cattell (Eds.), Handbook of multivariate experimental psychology (2nd ed, pp. 915-937). New York: John Wiley. Shrout, P. E., & Fleiss, J. L (1979). Intraclass correlations: uses in assessing rater reliability. Psy- chological Bulletin, 86, 420-428. Simar, L., & Wilson, P. W. (1998). Sensitivity analysis of efficiency scores: How to bootstrap in nonparametric frontier models. Management Science, 44, 49-61. Simar, L., & Wilson, P. W. (2000a). A general methodology for bootstrapping in non-parametric frontier models. Journal of Applied Statistics, 27, 779-802. 500 ORGANIZATIONAL RESEARCH METHODS at Universitas Gadjah Mada on June 14, 2015orm.sagepub.comDownloaded from
  • 20. Simar, L., & Wilson, P. W. (2000b). Statistical inference in nonparametric frontier models: The state of the art. Journal of Productivity Analysis, 13, 49-78. Soteriou, A. C., & Stavrinides, Y. (1997). An internal customer DEA service quality model for bank branches. International Journal of Operations and Production Management, 17, 780- 789. Steiger, J. H. (1980). Testing pattern hypotheses on correlation matrices: Alternative statistics and some empirical results. Multivariate Behavioral Research, 15, 335-352. Tankersley, W. B. (1990). The effects of organizational control structure and process on organi- zational performance (Doctoral dissertation, Florida State University). Dissertation Ab- stracts International, 51, 4274A. Taguiri, R. (1968). The concept of organizational climate. In R. Taguiri & G. H. Litwin (Eds.), Organizational climate. Boston: Harvard University Press. Thanassoulis, E. (1996). Assessing the effectiveness of schools with pupils of different ability usingdataenvelopment analysis. Journal oftheOperational ResearchSociety,47,84-97. Thanassoulis, E., & Dunstan, P. (1994). Guiding schools to improved performance using data envelopment analysis: An illustration with data from a local education authority. Journal of the Operational Research Society, 45, 1247-1262. Velicer, W. F. (1976). Determining the number of components from the matrix of partial correla- tions. Psychometrika, 41, 321-327. West, M. A., Smith, H., Feng, W. L., & Lawthom, R. (1998). Research excellence and depart- mental climate in British universities. Journal of Occupational and Organizational Psy- chology, 71, 261-281. Garry Gelade, Ph.D., read psychology at the University of Cambridge. Following completion of his doc- toral thesis on human vision — conducted in the Department of Electronic Engineering at Nottingham University — he worked as a post-graduate researcher in cognitive psychology at the University of Oxford. After a spell in industry working in information technology, he now works with Business Analytic Ltd., Lon- don, as an independent consultant to business specializing in the psychology of organizational effectiveness and applied creative thinking. Patrick Gilbert, Ph.D., is now an employee research and organizational effectiveness consultant with Mer- cer Human Resource Consulting, London. He was affiliated with International Survey Research, London, during the development of this article. Gelade, Gilbert / DATA ENVELOPMENT ANALYSIS 501 at Universitas Gadjah Mada on June 14, 2015orm.sagepub.comDownloaded from