Download to read offline


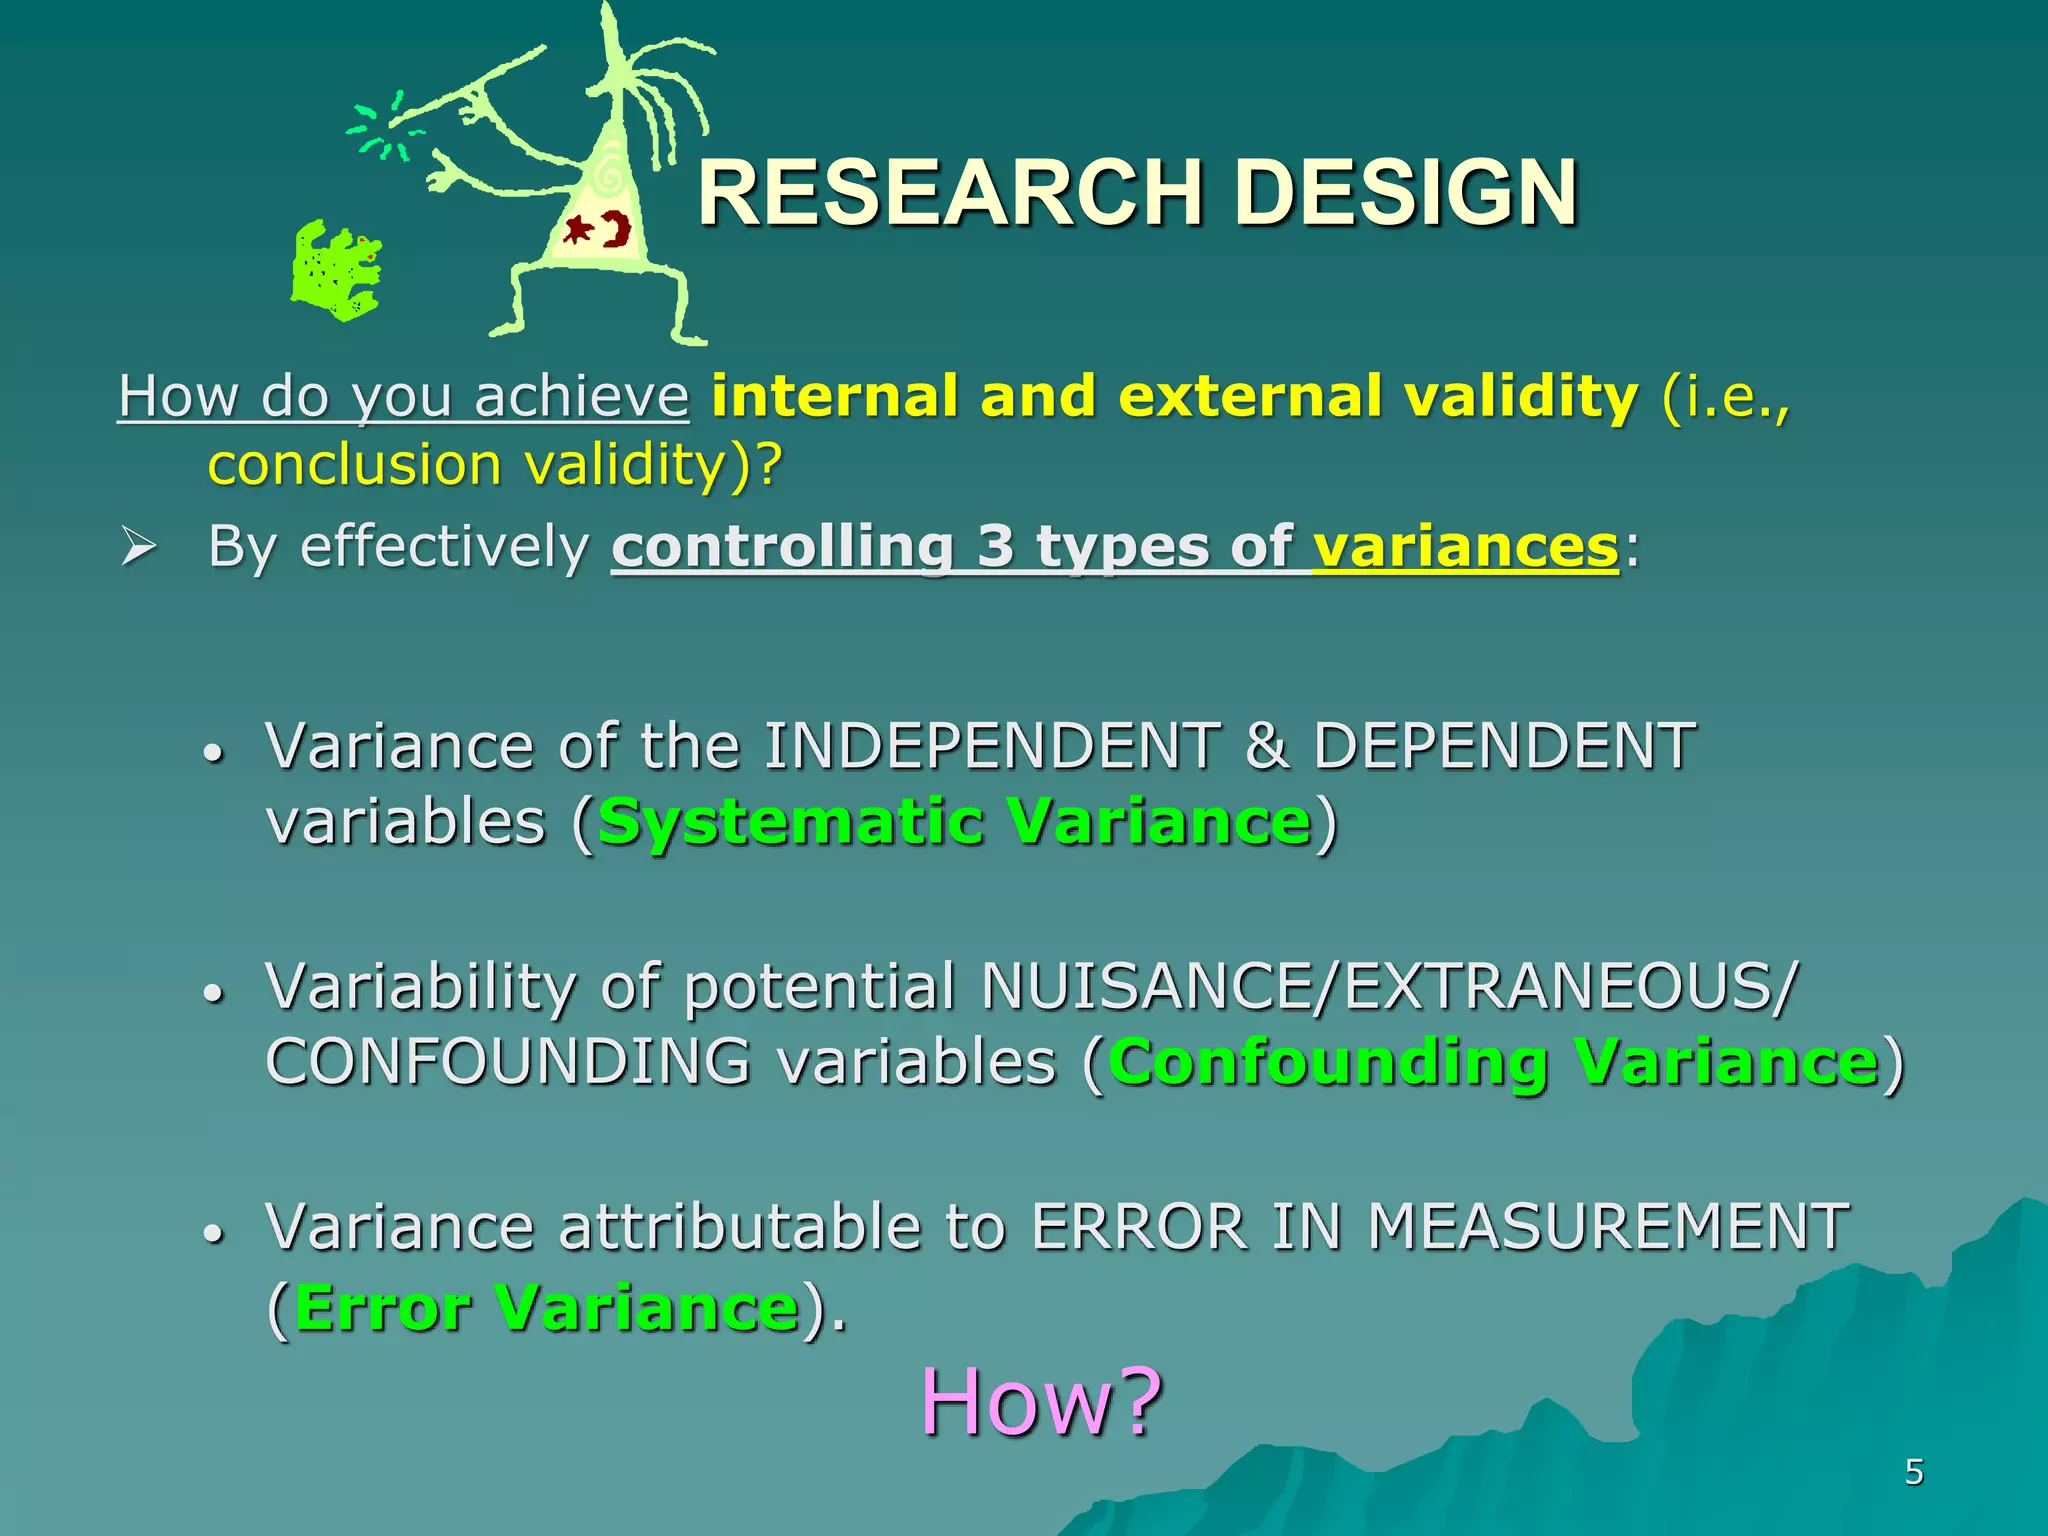

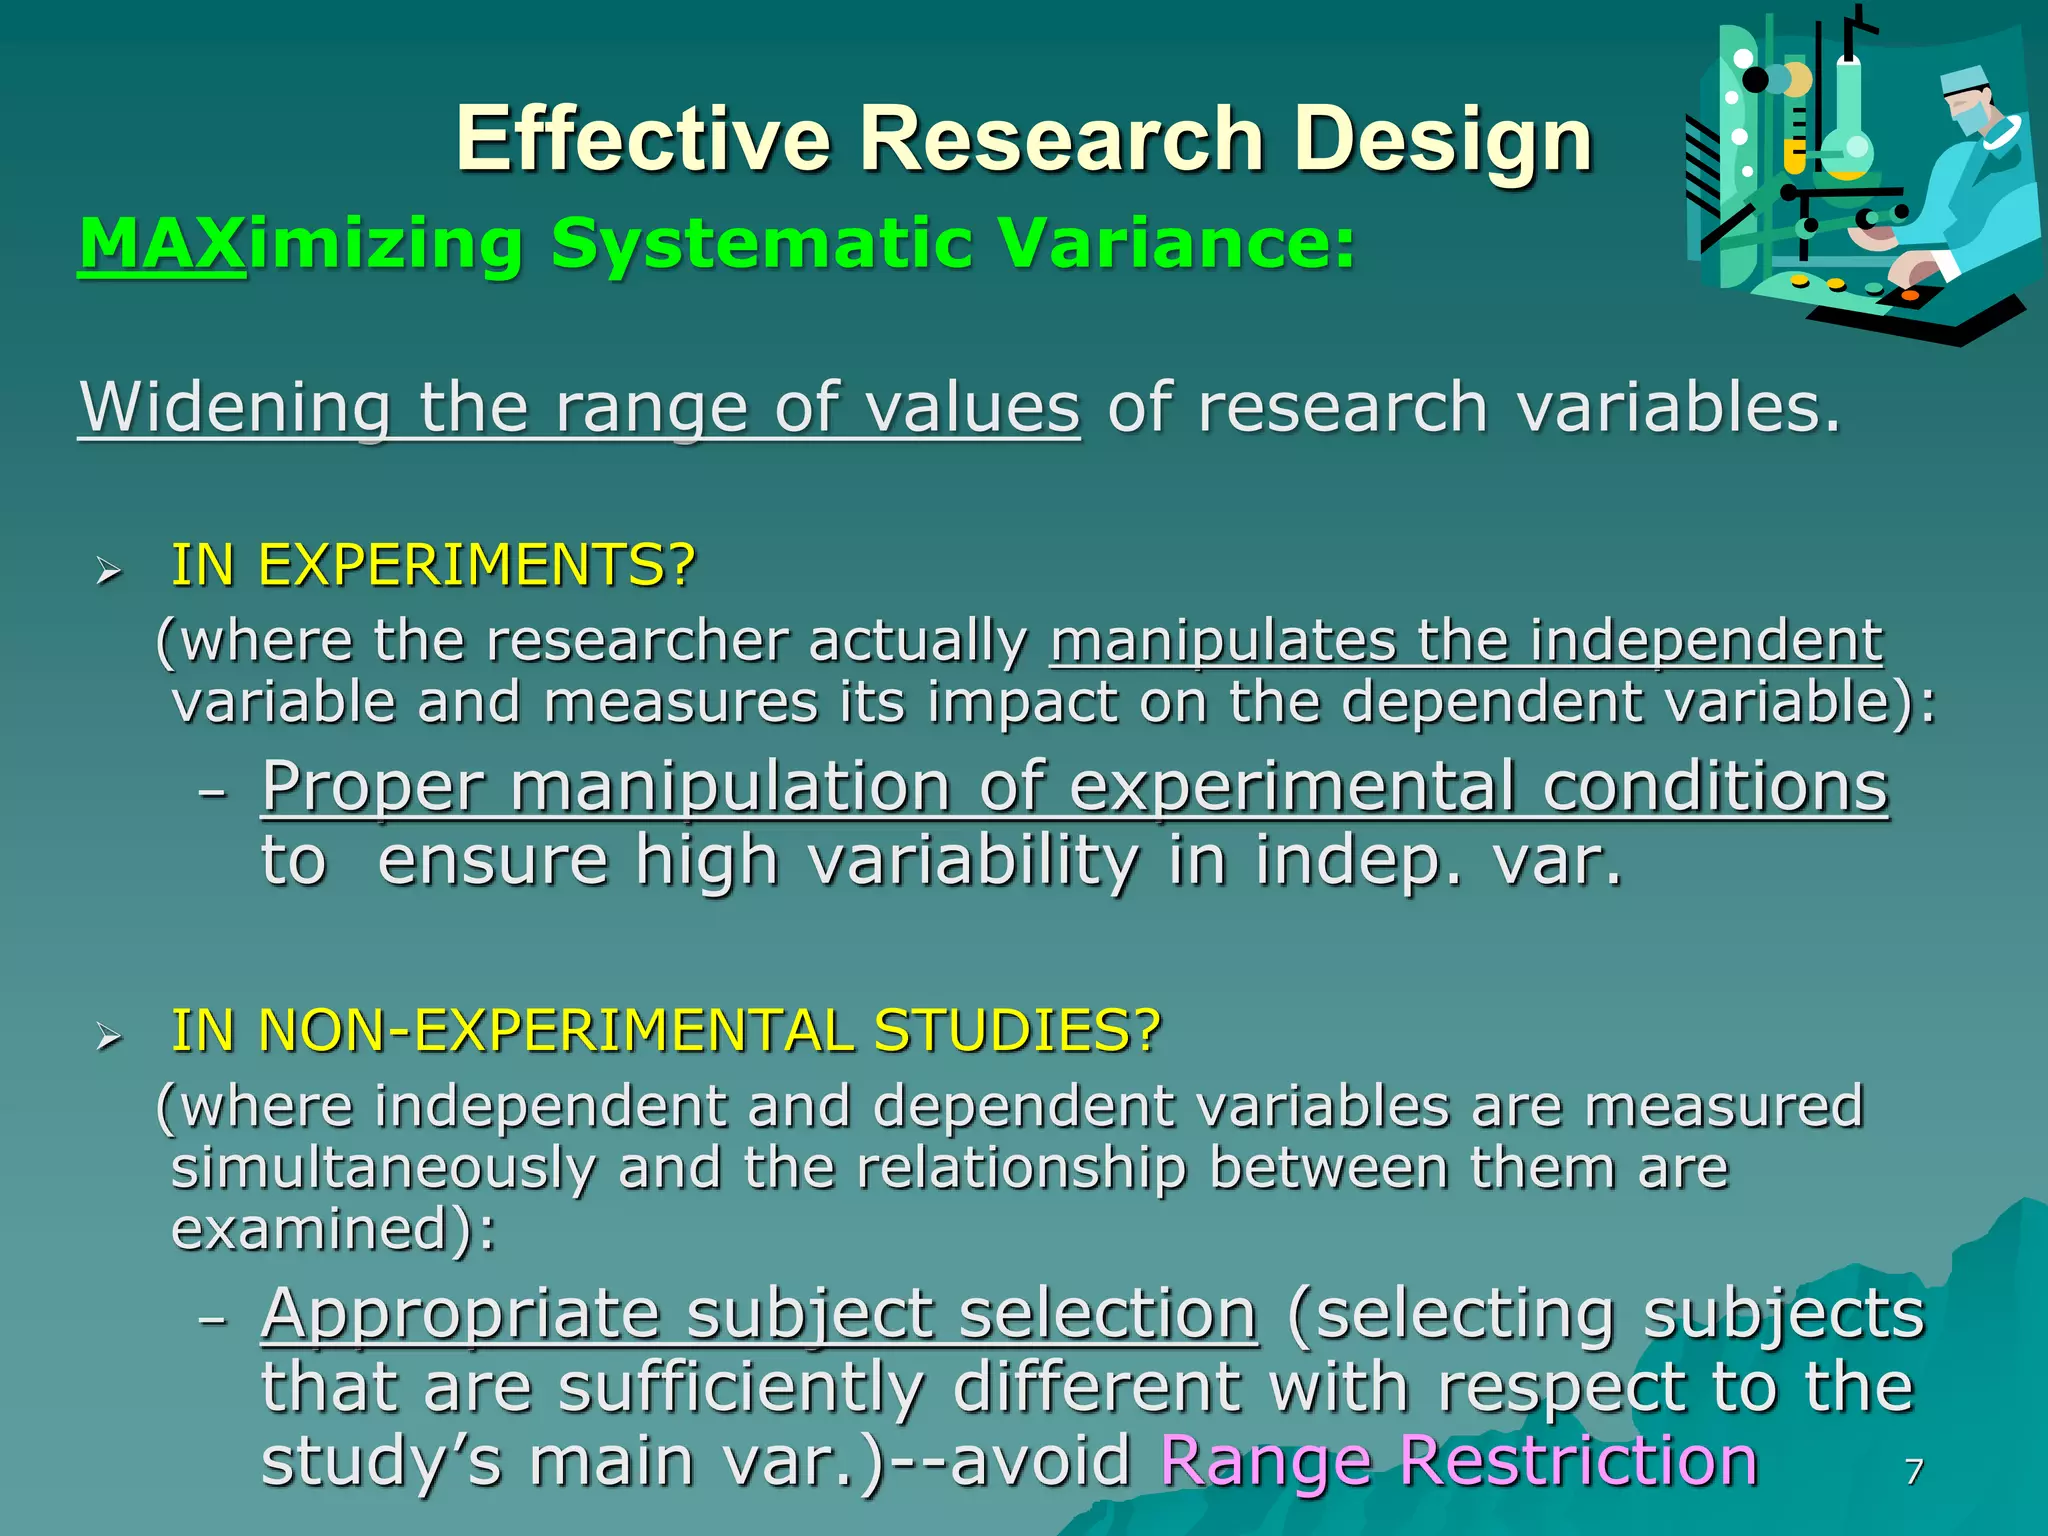
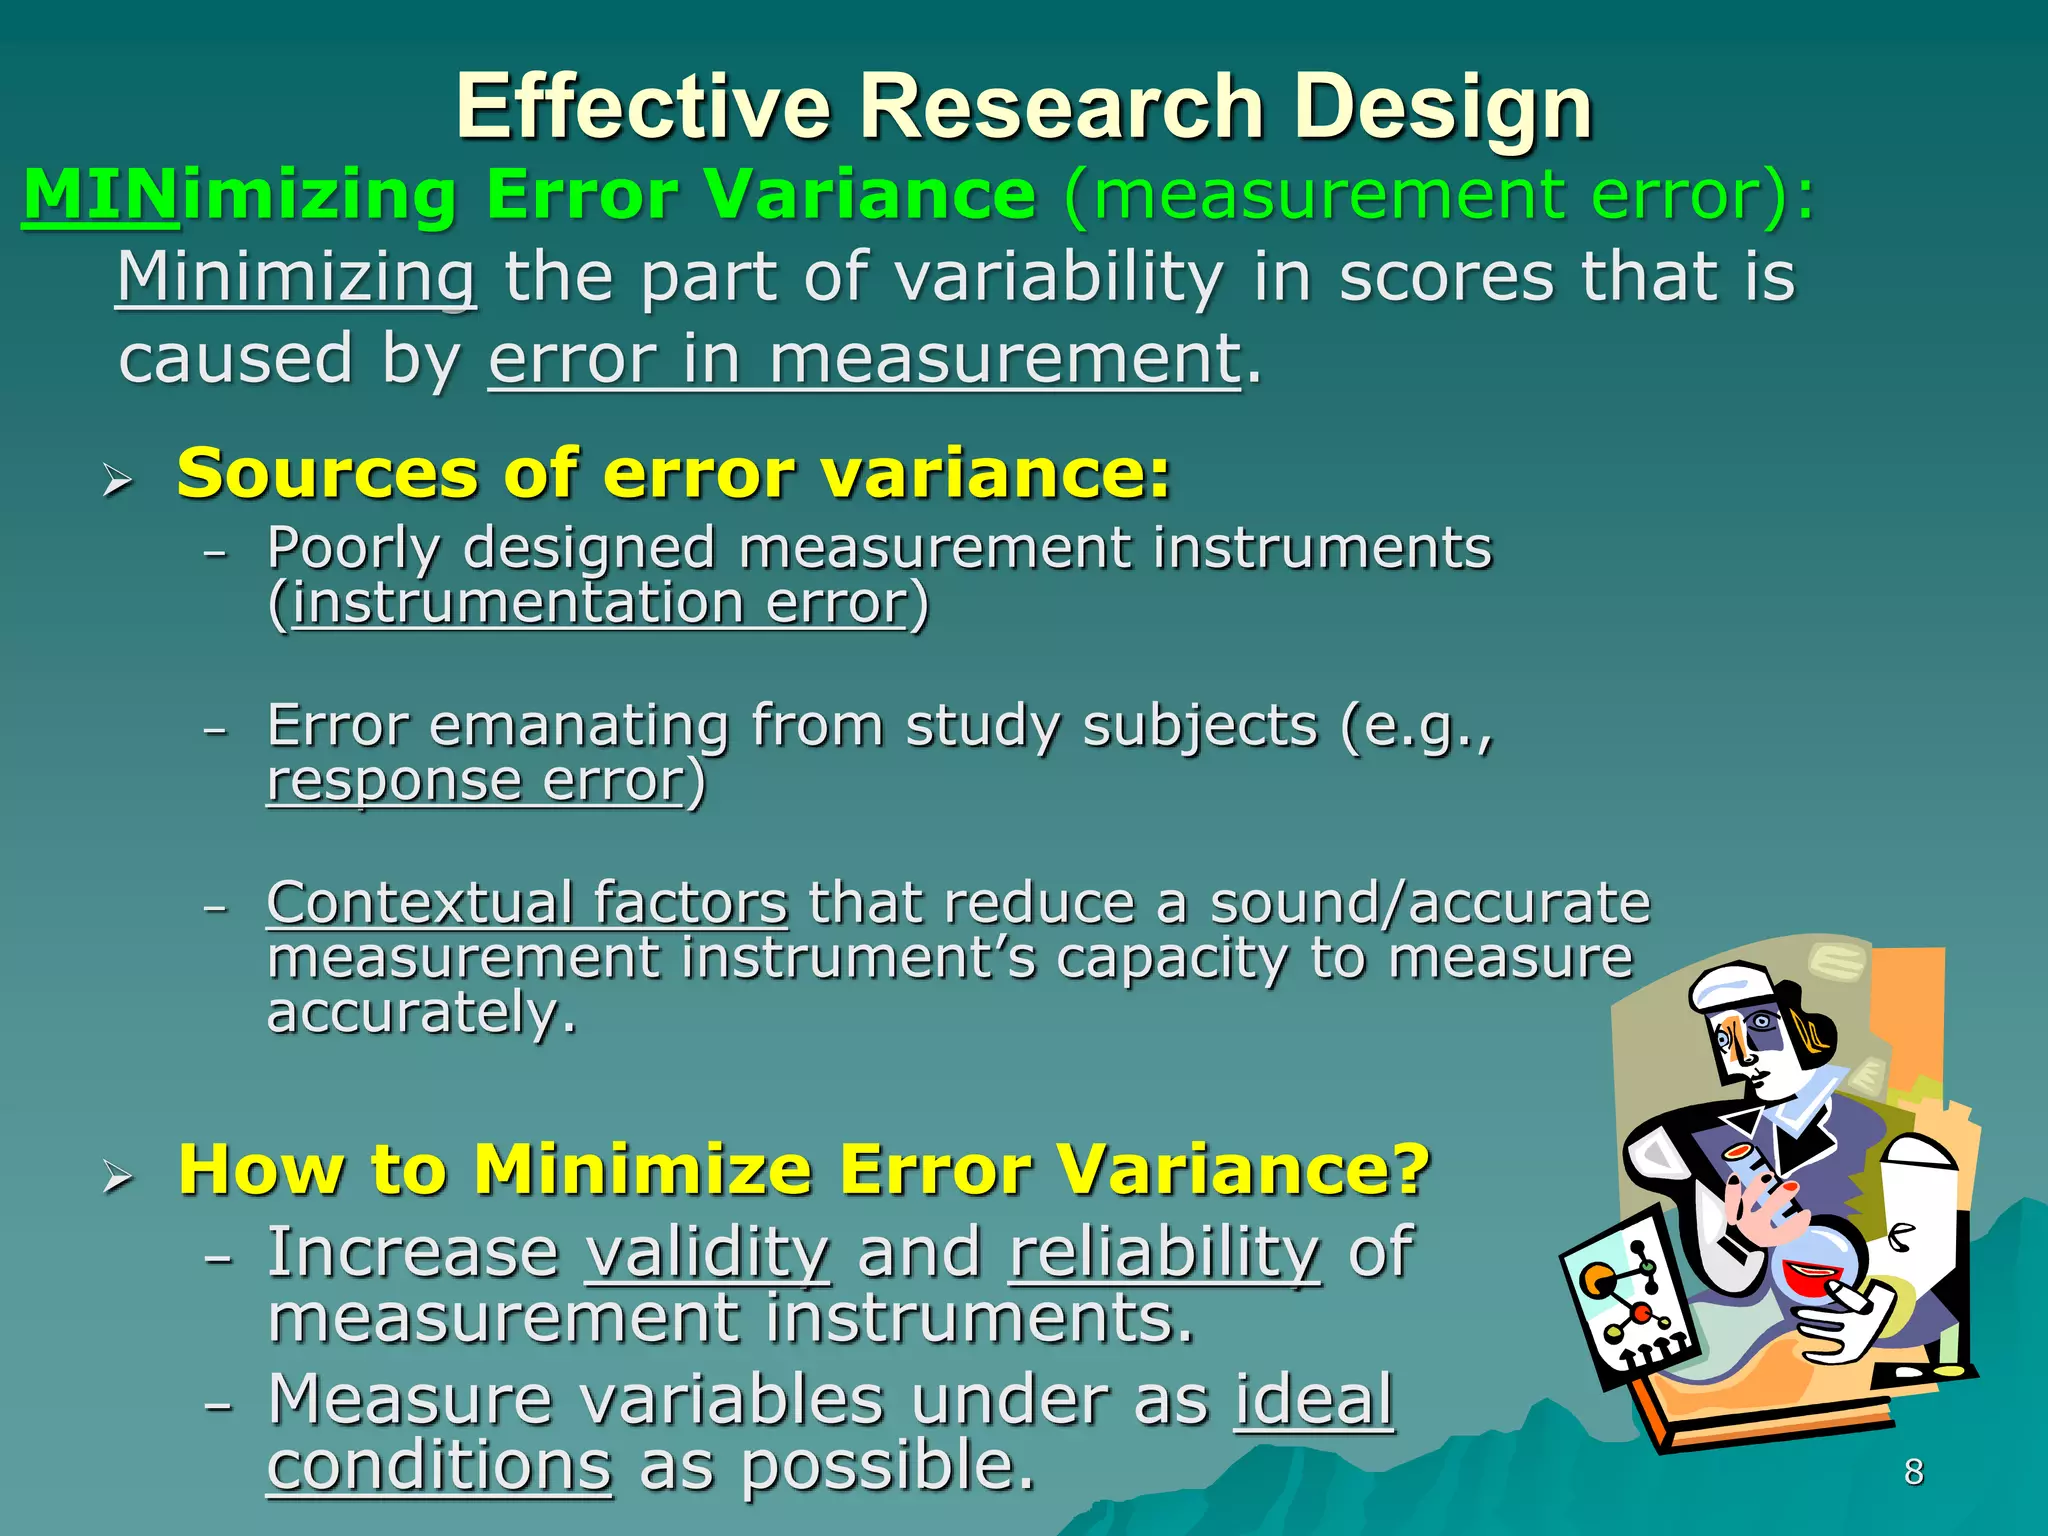


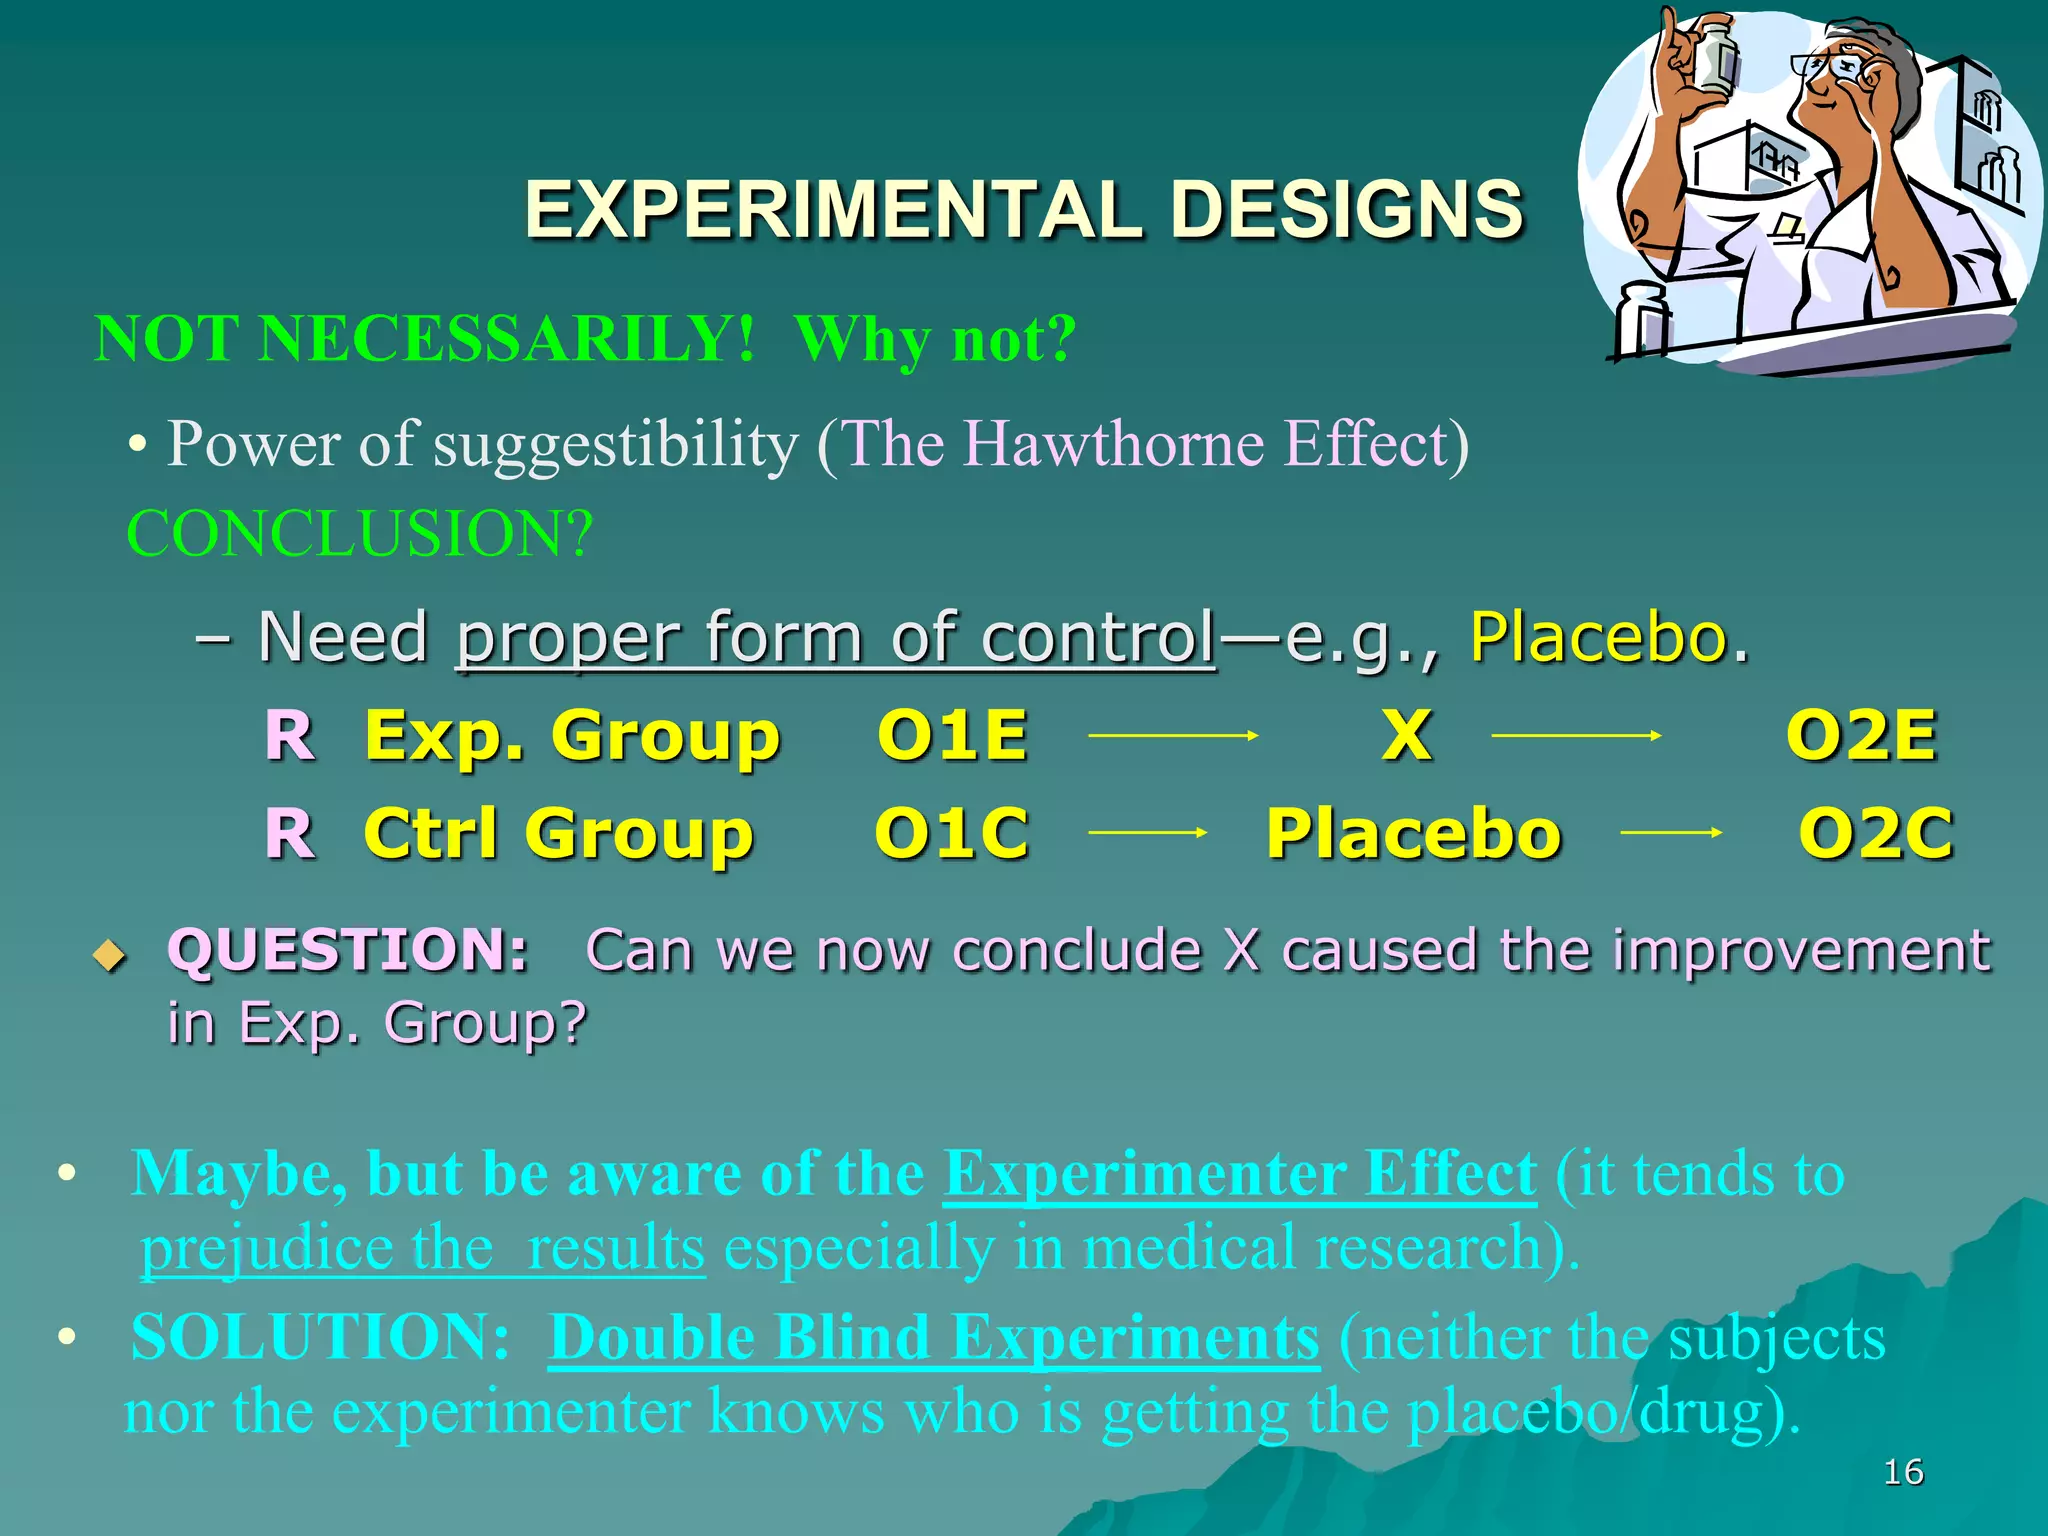


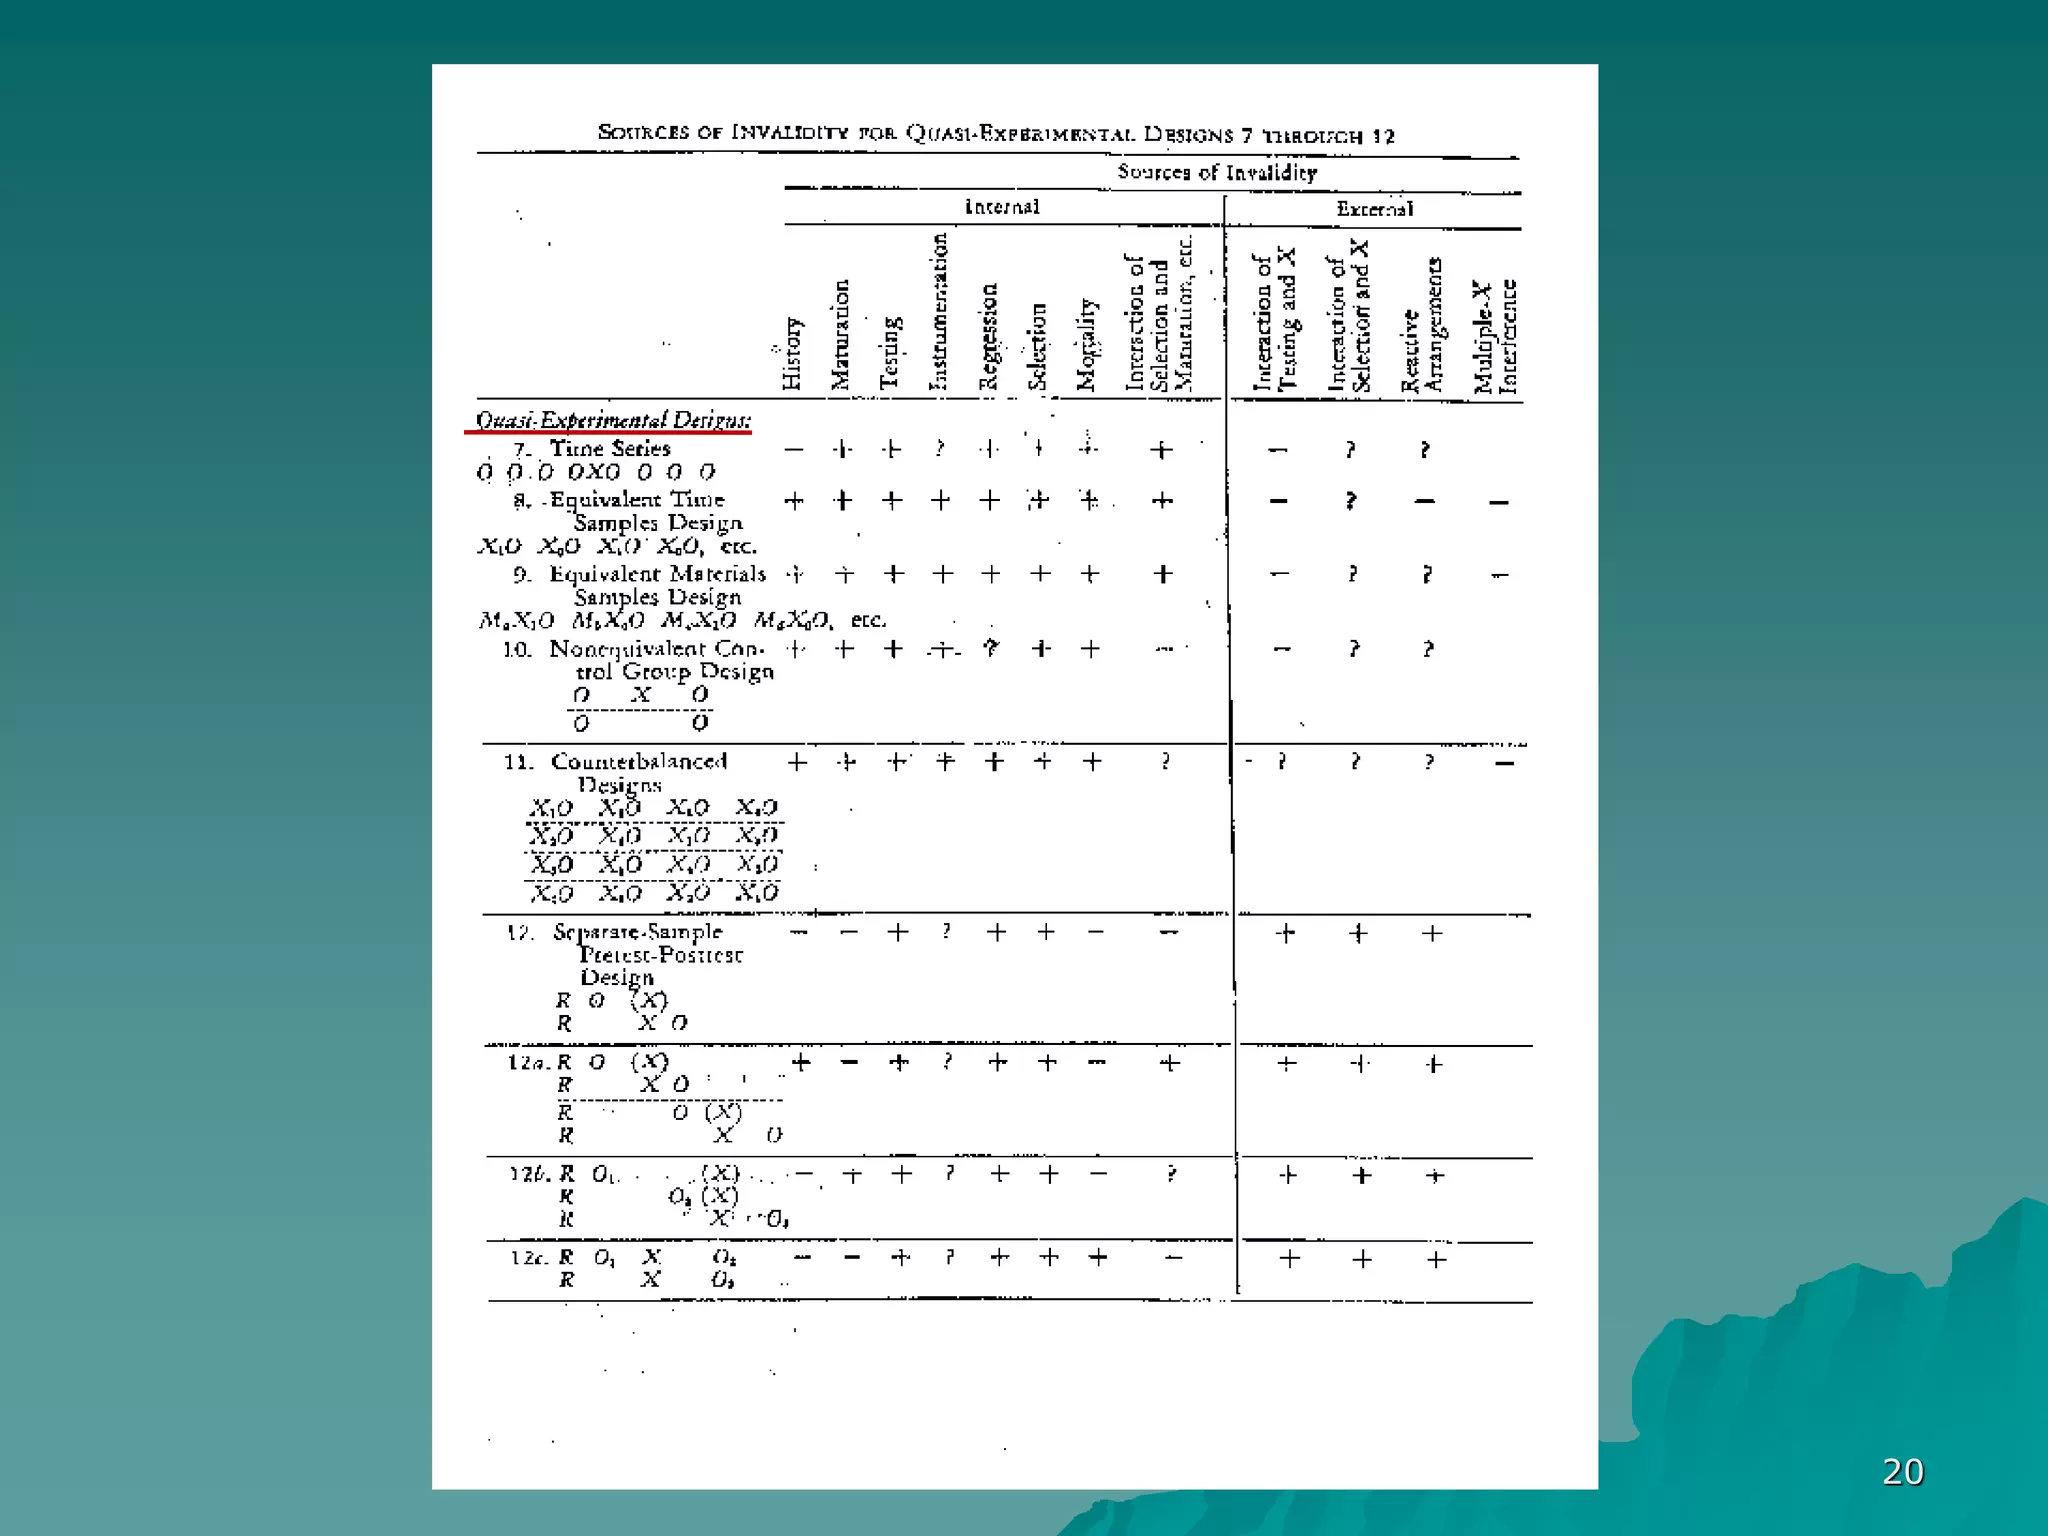


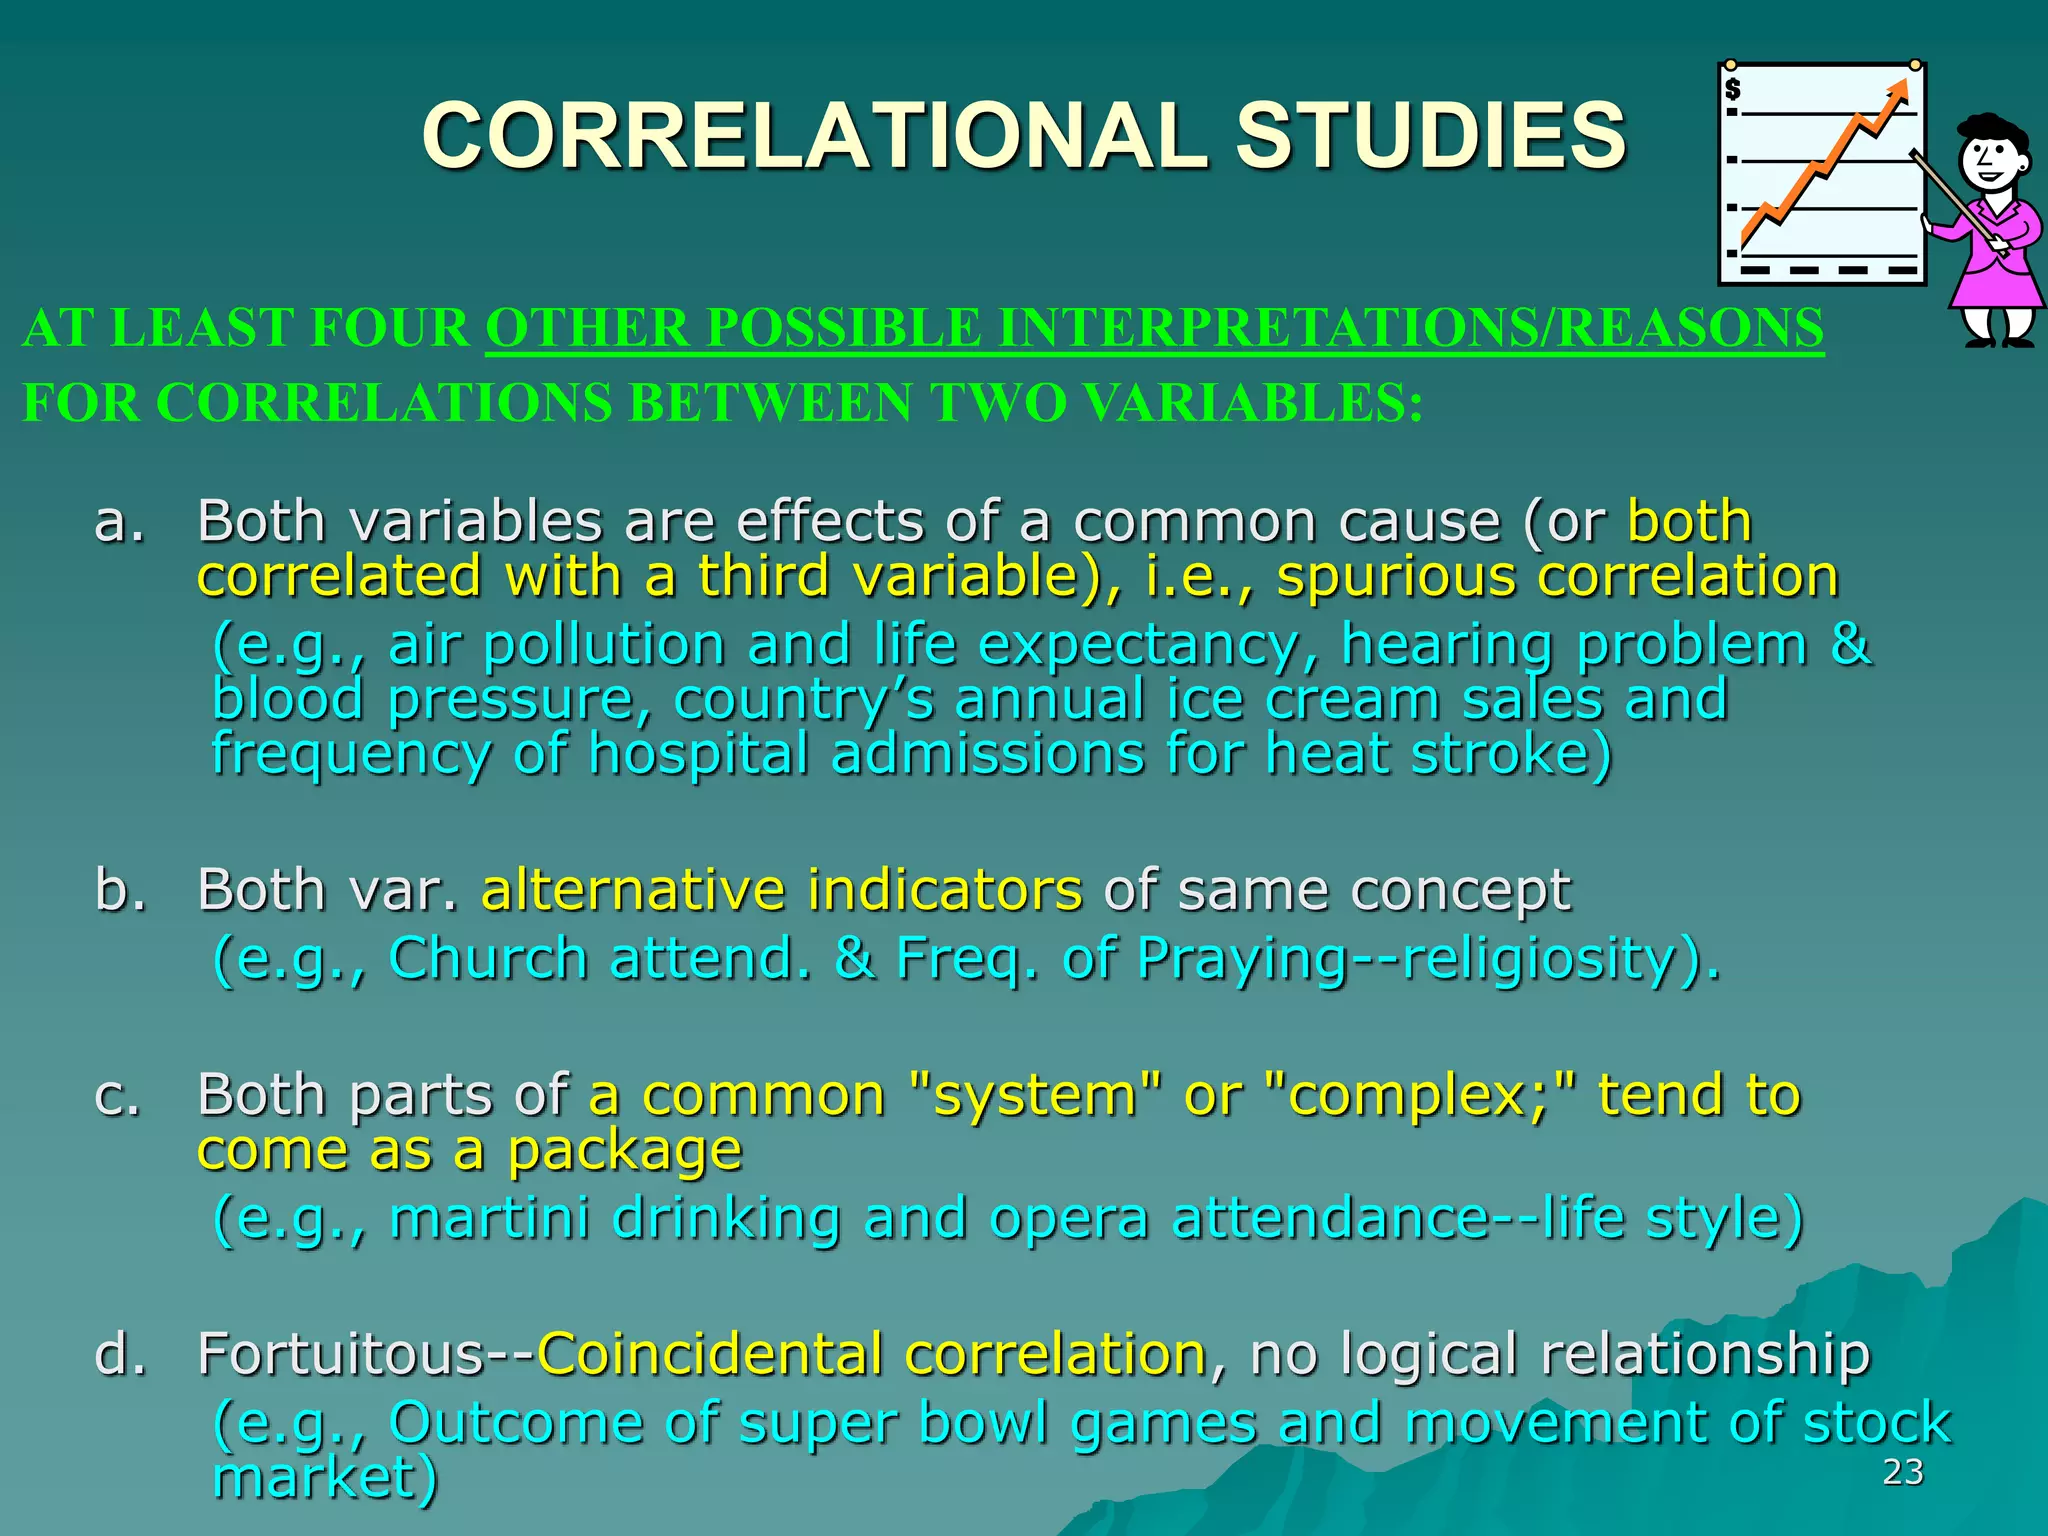
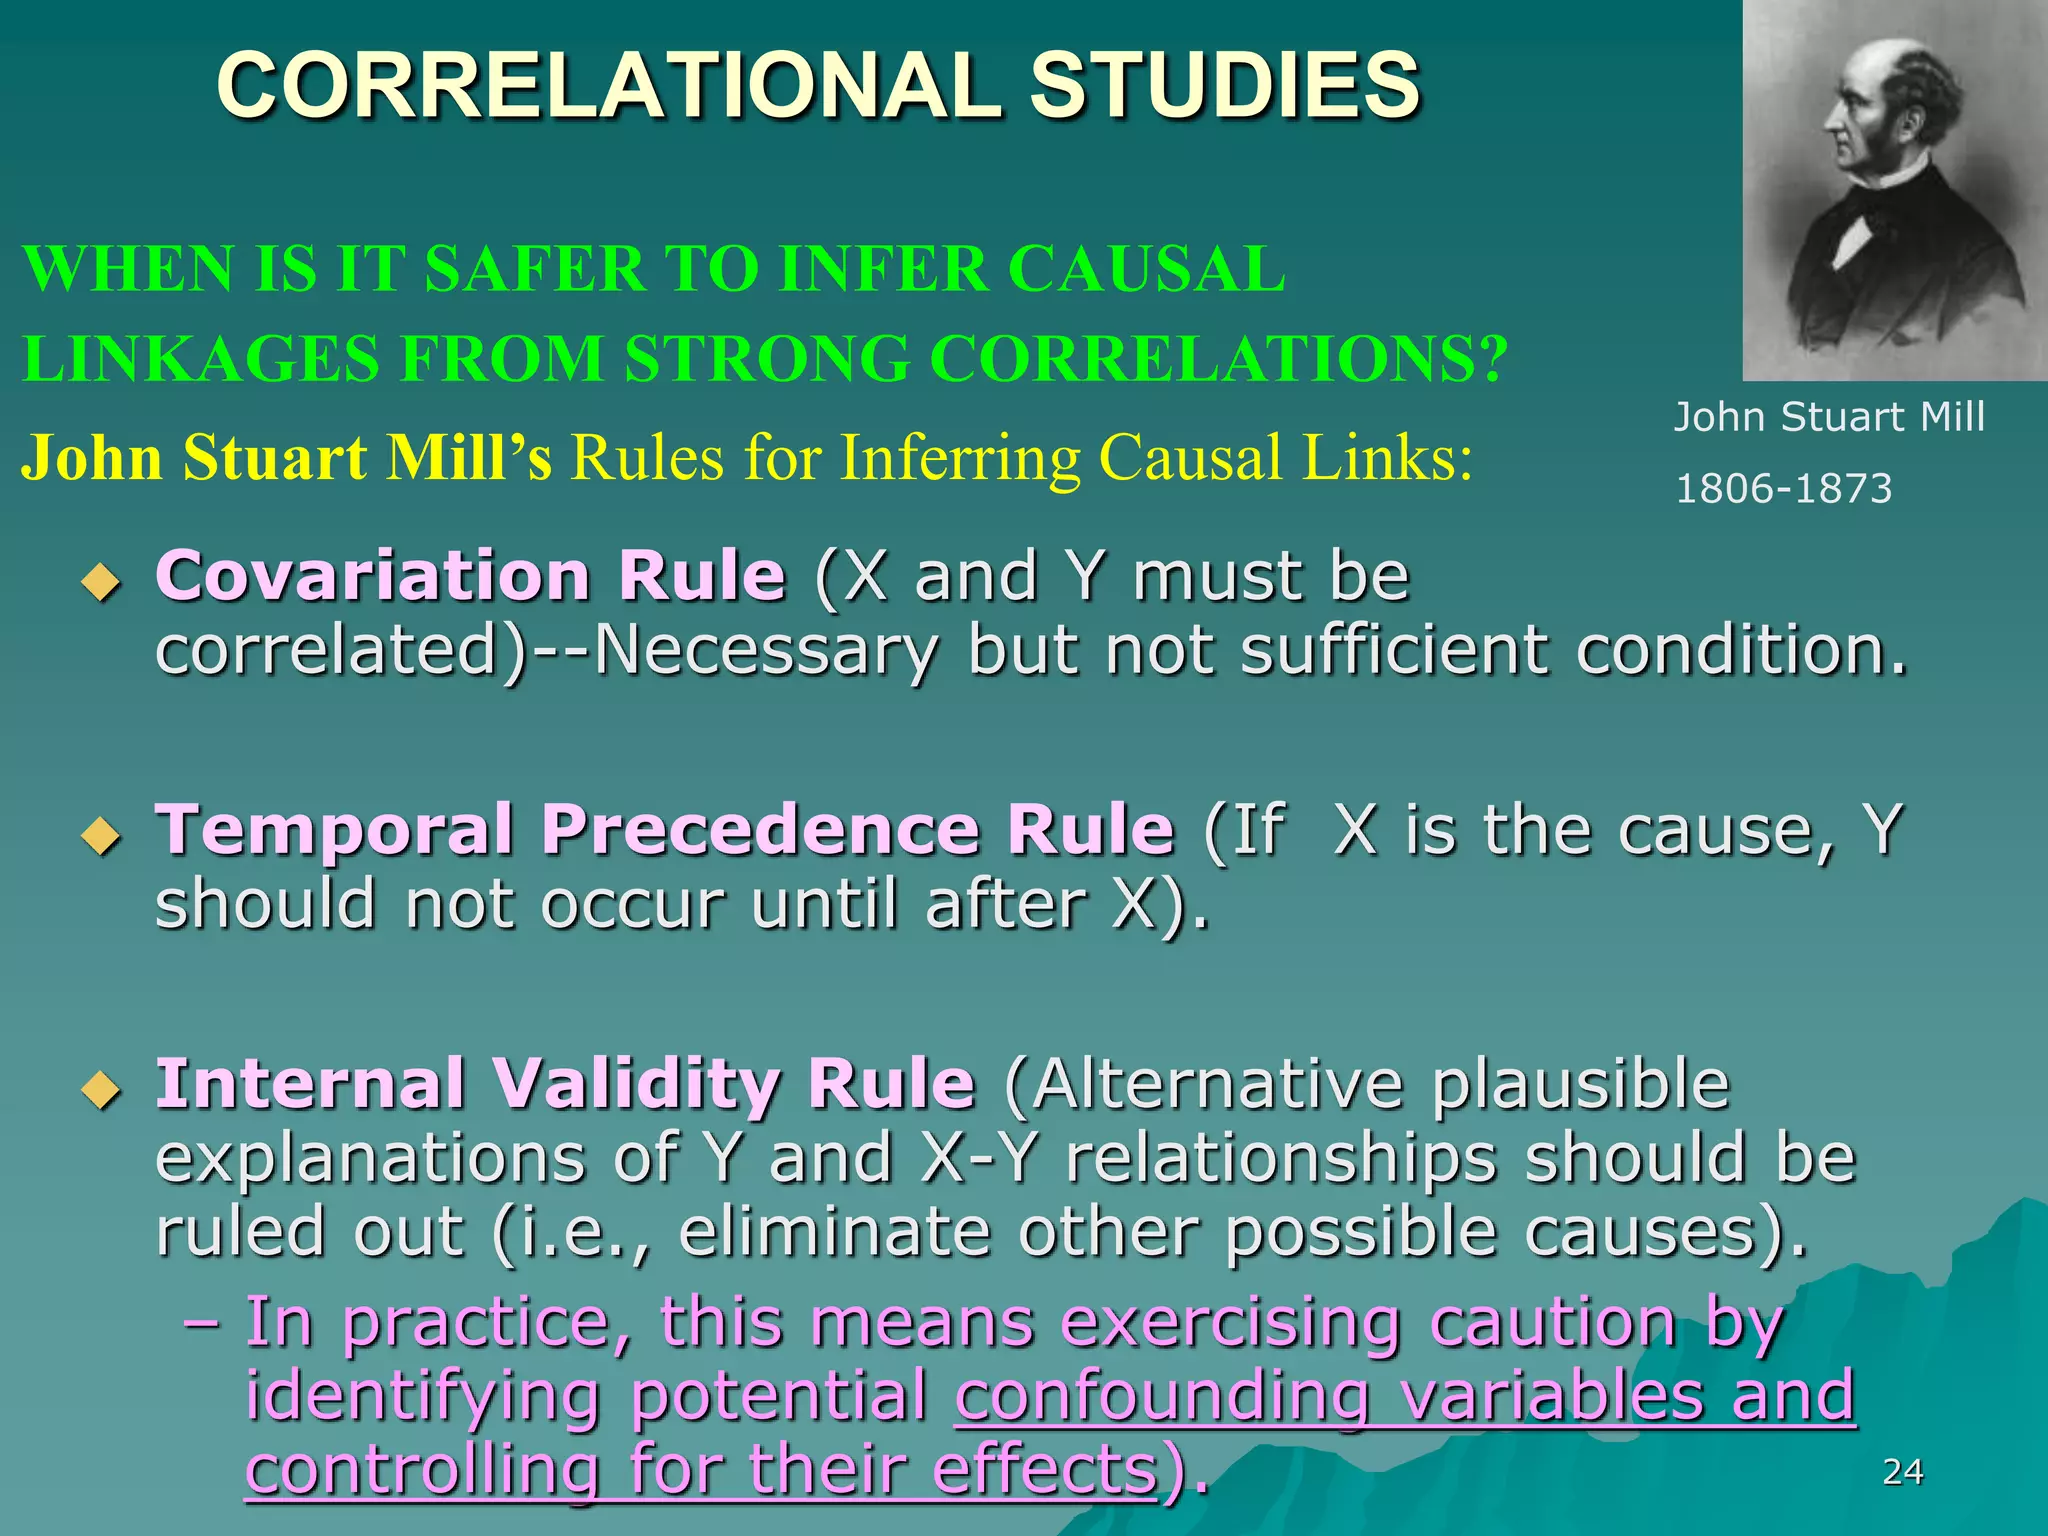


The document discusses research design and the process of conducting research projects. It explains that research design is the blueprint or plan that guides the research process. An effective research design maximizes systematic variance between independent and dependent variables, minimizes error variance, and controls for confounding variables. Experimental designs aim to establish causation through control and manipulation, while non-experimental and correlational designs examine relationships between measured variables.