This document reports on a study of the molecular structure, vibrational spectra, and other properties of N-(2,4-dinitrophenyl)-L-alanine methyl ester (Dnp-ala-ome) using density functional theory calculations and experimental techniques. Infrared, Raman, and UV–visible spectra were recorded for Dnp-ala-ome. Computational methods were used to optimize the molecular geometry, calculate vibrational frequencies, and investigate electronic properties including HOMO-LUMO transitions. Thermodynamic properties were also calculated at different temperatures. The first hyperpolarizability and related nonlinear optical properties were determined using a finite-field approach.

![technology of photonics including optical information processing
[1–4]. Vibrational spectra of amino acids, entering into the impor-
tant bio-polymers-proteins and their natural derivatives, lipo- and
phosphoproteins, are being studied over 50 years [5]. The vibra-
tional spectra of L-alanine and several deuterated analogs have
been extensively studied and assignments for the fundamental fre-
quencies have been proposed [6]. Alanine is the smallest naturally
occurring chiral amino acid. In peptides and proteins the confor-
mational properties of many other residues may be well modeled
by this simple molecule. Nitro aromatics and their derivatives con-
stitute an important class of industrial chemicals and are widely
used as intermediates in the synthesis of many wide and varied
products, ranging from drugs, pigments, pesticides and plant
growth regulators to the explosives [7,8]. The structure of aromatic
nitro compounds has been of great interest due to the explosive
nature of these compounds and 2,4-dinitrophenol, is primary used
as a chemical intermediate for the production of azo dyes, wood
preservatives and pesticides. Our molecule N-(2,4-dinitrophenyl)-
L-alanine methyl ester is one of the N-protected amino acids
derivative. It is a combination of nitro phenyl and L-alanine methyl
ester. It has the following properties; Appearance: Palle yellow
solid; Molecular formula: C10H11N3O6; Molecular weight:
269.21 g/mol; Melting point: 82 °C.
Rosado et al. [9] reported Vibrational spectra (FT-IR, Raman and
MI-IR) of a- and b-alanine. Fingerprint vibrational spectra of proto-
nated methyl esters of amino acids in the gas phase given by Simon
et al. [10]. John et al. [11] investigated conformational analysis of
the methyl ester of alanine by gas electron diffraction and ab initio
geometry optimization. Growth and characterization of nonlinear
optical amino acid single crystal: L-Alanine proposed by Vijayan
et al. [12]. Vibrational dynamics of crystalline L-alanine and vibra-
tional spectra of crystalline b-alanine was given by Heloisa et al.
and Berezhinsky et al. [13,14]. Marchewka et al. [15] assigned crys-
tal and molecular structure of N-(4-nitrophenyl)-b-alanine-its
vibrational spectra and theoretical calculations.
With the aid of above seen literatures, it is clear that there is no
quantum mechanical study on this title molecule which has moti-
vated to do a detailed quantum mechanical analysis for under-
standing the vibrational modes, chemical shifts, HOMO–LUMO,
MEP and thermodynamic properties of title compound. Therefore,
the aim of this study is to fully determine the molecular structure,
vibrational modes and wavenumbers are determined by using
quantum chemical calculations. Detailed interpretations of the
vibrational spectra of our compound have been made based on
the calculated potential energy distribution (PED). UV–Vis spec-
trum of Dnp-ala-ome is reported experimentally. The organic com-
pounds showing high hyperpolarizability are those containing an
electron donating group or an electron withdrawing group inter-
acting through a system of conjugated bonds. In this case, the elec-
tron withdrawing nitro group and electron donating methoxy
group is present in the title compound.
FT-IR, FT-Raman and UV–Vis spectral measurements
The compound N-(2,4-dinitrophenyl)-L-alanine methyl ester in
the solid form was purchased from TCI INDIA chemical company
at Chennai, with a stated purity greater than 98% and it was used
as such without further purification. The FT-IR spectrum of this
compound was recorded in the range of 4000–400 cmÀ1
on a BRU-
KER Optik GmbH FT-IR spectrometer using KBr pellet technique.
The spectrum was recorded in the room temperature, with scan-
ning speed of 10 cmÀ1
, and spectral resolution: 4 cmÀ1
. FT-Raman
spectrum of the title compound was recorded using 1064 nm line
of Nd:YAG laser as excitation wavelength in the region 3500–
50 cmÀ1
on a BRUKER RFS 27: FT-Raman Spectrometer equipped
with FT-Raman molecule accessory. The spectral resolution was
set to 2 cmÀ1
in back scattering mode. The laser output was kept
at 100 mW for the solid sample. The ultraviolet absorption spectra
of Dnp-ala-ome were examined in the range 200–800 nm using
Cary 500 UV–VIS–NIR spectrometer. The UV pattern is taken from
a 10–5 M solution of Dnp-ala-ome, dissolved in ethanol. The
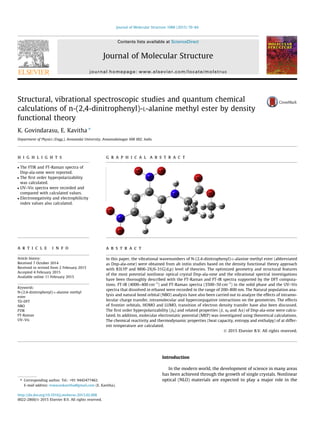
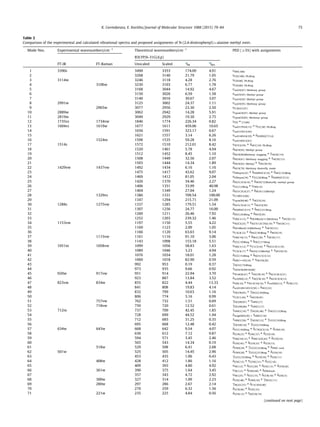
theoretically predicted IR and Raman spectra at B3LYP/6-
31G(d,p) level of calculation along with experimental FT-IR and
FT-Raman spectra are shown in Figs. 1 and 2. The FTIR and UV–
Vis spectral measurements were carried out at Central Electro-
chemical Research Institute (CECRI), Karaikudi and FT-Raman spec-
tral measurement was carried out at Indian Institute of Technology
(IIT), Chennai, India.
Computational details
The optimized geometry was performed at B3LYP and M06-2X/
6-31G(d,p) level of calculations and vibrational frequencies were
calculated at the B3LYP/6-31G(d,p) level of calculation with the
Gaussian 09 program [16]. The molecular structure optimization
and corresponding vibrational harmonic frequencies of were calcu-
lated using DFT calculations [17] with the Becke’s three-parameter
hybrid functional (B3) [18] for the exchange part and the Lee–
Yang–Parr (LYP) correlation function [19], for the computation of
molecular structure, vibrational frequencies and energies of opti-
mized structures by using Gaussian 09 suite of quantum chemical
codes. Firstly, the title molecule was optimized, after then the opti-
mized structural parameters were used in the vibrational frequen-
cy and calculations of electronic properties. The vibrational
wavenumber assignments were carried out by combining the
results of the Gauss view 5.08 [20] and VEDA 4 programs [21].
4000 3500 3000 2500 2000 1500 1000 500 0
3779
3691
3448
3330
3114
2991
2889
2819
2661
2592
2439
2272
2189
2054
1934
1824
1735
1604
1514
1429
1288
1153
1051
920
823
712
634
501
Wavenumber (cm-1
)
Experimental
161
261
392
507546
638699
807
884915
1015105310991122
1207125312911330
141414451507153715911614
1776
2929
30133044
3144
3351
B3LYP/6-31G (d,p)
Transmission(%)IRintensity(arb.units)
Fig. 1. Comparison of theoretical and experimental B3LYP/6-31G (d,p) FT-IR spectra
for N-(2,4-dinitrophenyl)-L-alanine methyl ester.
K. Govindarasu, E. Kavitha / Journal of Molecular Structure 1088 (2015) 70–84 71](https://image.slidesharecdn.com/b17d5b6d-b0bf-4fa4-a445-07ce8421e18a-160601043133/85/1-s2-0-S0022286015000939-main-2-320.jpg)
![Calculation of theoretical vibrational spectra is now possible by
using a variety of quantum mechanical software enabling use of
a variety of quantum chemical approaches based on variational,
perturbational, density functional, and coupled clusters methods.
The most of vibrational spectra are still calculated within the har-
monic approximation generating some systematical errors. Gener-
ally, there are two ways to interpret a theoretical vibrational
spectrum of a molecule: a visualization of the atom movement,
and Potential Energy Distribution (PED) analysis [22–27]. VEDA
program for PED analysis of theoretical vibrational spectra is
described. VEDA generates internal coordinates based on molecu-
lar structure. PED analysis is indispensible in modern vibrational
spectroscopy laboratories [28]. The calculated IR spectrum plotted
using the pure Lorentzian band shape with a band width of FWHM
of 10 cmÀ1
has been compared with the experimental FT-IR spec-
trum. The natural bonding orbital (NBO) calculations [29] were
performed using Gaussian 09 [16] package at the same level in
order to understand various second order interactions between
the filled orbitals of one subsystem and vacant orbitals of another
subsystem, which is a measure of the intermolecular delocalization
or hyper conjugation. UV–Vis spectra, electronic transitions, verti-
cal excitation energies, absorbance and oscillator strengths were
computed with the time-dependent DFT method. The electronic
properties such as HOMO and LUMO energies were determined
by TD-DFT approach. To investigate the reactive sites of the title
compound the MEP were evaluated using the B3LYP method. The
changes in the thermodynamic functions (the heat capacity,
entropy, and enthalpy) were investigated for the different tem-
peratures from the vibrational frequency calculations of molecule.
The first order hyperpolarizability (b0) of this molecular system,
and related properties (b, a0 and Da) of are calculated using 6-
31G(d,p) basis set, based on the finite-field approach [30].
Prediction of Raman intensities
The Raman activities (Si) calculated by Gaussian 09 program
[16] has been converted to relative Raman intensities (IR
). The the-
oretical Raman intensity (IR
), which simulates the measured
Raman spectrum, is given by the equation [31,32]:
IR
i ¼ Cðm0 À miÞ4
mÀ1
i BÀ1
i Si ð1Þ
where Bi is a temperature factor which accounts for the intensity
contribution of excited vibrational states, and is represented by
the Boltzmann distribution:
Bi ¼ 1 À ðexp À hvic=kTÞ ð2Þ
In Eq. (1) m0 is the frequency of the laser excitation line (in this
work, we have used the excitation frequency m0 = 9398.5 cmÀ1
,
which corresponds to the wavelength of 1064 nm of a Nd:YAG
laser), mi is the frequency of normal mode (cmÀ1
), while Si is the
Raman scattering activity of the normal mode Qi. Ii
R
is given in arbi-
trary units (C is a constant equal 10À12
). In Eq. (2) h, k, c, and T are
Planck and Boltzmann constants, speed of light and temperature in
Kelvin, respectively. Thus, the presented theoretical Raman inten-
sities have been computed assuming Bi equal 1. The theoretical
Raman spectra have been calculated by the Raint program [33].
Results and discussion
Conformational stability
In order to describe conformational flexibility of the title mole-
cule, the energy profile as a function of C7AN2AC3AC1 torsion
angle was achieved with B3LYP method (Fig. 3). During the calcu-
lation all the geometrical parameters were simultaneously relaxed
while the C7AN2AC3AC1 torsional angles are varied in steps from
0°, 10°, 20°, 30°, . . ., 360°. While performing the scan, the program
searched for a minimum point for each 10°. The energy values
obtained from the scan output show that, the structure has a mini-
mum energy values observed at 0° or 360° (À1003.01 Hartree) and
216° (À1003.11 Hartree) for T (C7AN2AC3AC1). The minimum
energy at 216° identified as the global minimum and other mini-
mum energy at 72° (À1003.07 Hartree) appears that local mini-
mum. Further results are based on the most stable conformer of
molecule Dnp-ala-ome to clarify molecular structure and assign-
ments of vibrational spectra.
4000 3500 3000 2500 2000 1500 1000 500 0
3106
2965
2629
1734
1619
1524
1437
13291275
11151058
917
834
757718
643
518
408361300
165
82
Wavenumber (cm-1
)
Experimental
38
192
284315
392
507569
638699
822
915
1045
1122
1207
1330
14141460
153715601614
1776
2944
3044
3121
3351
B3lyp/6-31G (d,p)
Ramanintensity(arb.units)
Fig. 2. Comparison of theoretical and experimental B3LYP/6-31G (d,p) FT-Raman
spectra for N-(2,4-dinitrophenyl)-L-alanine methyl ester.
0 50 100 150 200 250 300 350
-1003.12
-1003.10
-1003.08
-1003.06
-1003.04
-1003.02
-1003.00
-1002.98
Relativeenergy(Hartree)
C7-N2-C3-C1 Dihedral angle (º)
Total energy: -1003 Hartree
Fig. 3. Dihedral angle-relative energy curves of the N-(2,4-dinitrophenyl)-L-alanine
methyl ester by B3LYP/6-31G (d,p) level of theory.
72 K. Govindarasu, E. Kavitha / Journal of Molecular Structure 1088 (2015) 70–84](https://image.slidesharecdn.com/b17d5b6d-b0bf-4fa4-a445-07ce8421e18a-160601043133/85/1-s2-0-S0022286015000939-main-3-320.jpg)
![Structural analysis
The optimized molecular structure of Dnp-ala-ome was shown
in Fig. 4. The optimized geometrical parameters (bonds lengths,
bond angles and dihedral angles) obtained by the B3LYP and
M06-2X/6-31G(d,p) basis set calculations were presented in
Table 1. The molecular structure of the title molecule in the ground
state (in gas phase) has been optimized by using DFT/B3LYP and
M06-2X methods with 6-31G(d,p) basis set level, and the calculat-
ed optimized structure has been used in the vibrational frequency
calculations. To the best of our knowledge, experimental data on
the geometric structure of the title molecule are not available till
date in the literature. Our molecule Dnp-ala-ome is compared with
XRD data of closely related molecules 1-(2,4-Dinitrophenyl)-2-
[(E)-2,4,5-trimethoxybenzylidene] hydrazine [34] and L-alanine
methyl ester hydrochloride monohydrate [35]. In the benzene ring,
CAC bond length is about 1.396 Å [36]. In the present study the
CAC bond length of the benzene ring varies from 1.377–1.436 Å
by B3LYP method and 1.374À1.427 Å by M06-2X method and
1.359–1.424 Å by Experimental data. The CAC bond length of the
benzene ring is not same; this is due to the ortho and para sub-
stituent of the Nitro groups and NH substituent on the C7th carbon
atom of the phenyl ring. The bond length of C7AC8 = 1.436 Å
(B3LYP)/1.427 Å (M06-2X)/1.424 Å (XRD) and C7AC12 = 1.427 Å
(B3LYP)/1.424 Å (M06-2X)/1.420 Å (XRD), which is greater than
the C11AC12 = 1.377 Å (B3LYP)/1.374 Å (M06-2X)/1.359 Å (XRD)
at the rest of the substituent, the reason for the elongation of these
bond lengths are due to the substitution of the NH group. The
aliphatic CAC bond lengths C1AC3 = 1.539 Å/1.531 Å/1.514 Å and
C3AC4 = 1.547 Å/1.540Å/1.524 Å are calculated by B3LYP/M06-
2X/XRD respectively. The aromatic CAH bond lengths
C9AH25 = 1.081 Å/1.083 Å and C12AH27 = 1.082 Å/1.082 Å are
calculated by B3LYP/M06-2X method respectively, which is good
agreement with observed XRD value at 0.930 Å. On the other hand
small increments occur in the methyl group and methoxy group
CAH bond lengths. For example methoxy group CAH bond lengths
are C19AH28 = 1.090 Å/1.089 Å, C19AH29 = 1.094 Å/1.093 Å and
C19AH30 = 1.094 Å/1.094 Å calculated by B3LYP and M06-2X
methods respectively. The C8AN16 and C10AN13 bonds joined
the nitro group is equal to 1.458 Å calculated by B3LYP method
and it is also found to 1.459 Å and 1.458 Å by M06-2X method. This
value is comparable to that found in several nitrobenzene deriva-
tives in which the distance of CarANO2 bond ranging from
1.446(3) Å to 1.476(3) Å [37] as well as to those found in the gas
phase structure (1.447(3) Å). The CANphenyl bond is relatively long;
the asymmetry of the C8AN16 and C10AN13 bonds can be
explained by electron withdrawing character of the Nitro group.
These effects are not only seen in quantum calculation but also
reflect in crystal structure [34]. The C7AN2 bond length is found
at 1.350 Å/1.347 Å/1.357 Å by B3LYP/M06-2X/XRD is quite similar
to that found in several crystals containing the CarANH bond [37]
indicating slightly delocalization of the electrons over this bond.
The NAO bond lengths of nitro group is found to
N13AO14 = 1.234 Å (B3LYP)/1.220 Å (M06-2X)/1.238 Å (XRD),
N13AO15 = 1.231 Å (B3LYP)/1.217 Å (M06-2X)/1.228 Å (XRD),
N16AO17 = 1.242 Å (B3LYP)/1.226 Å (M06-2X)/1.248 Å (XRD) and
N16AO18 = 1.229 Å (B3LYP)/1.215 Å (M06-2X)/1.227 Å (XRD).
The N16AO17 bond is lengthened by about 0.012 Å in comparison
with the latter N13AO14 in O14AN13AO15; this is due to an
NAHÁ Á ÁO intramolecular hydrogen bond between the oxygen atom
of the O18AN16AO17 group and the hydrogen atom of NH group.
The C19AO6 and C1@O5 bond lengths are 1.434 Å/1.424 Å and
1.207 Å/1.201 Å calculated by B3LYP/M06-2X methods respective-
ly and it is also observed 1.454 Å and 1.205 Å by XRD. The
O17AH20 bond length is 1.866 Å calculated by B3LYP method
and it is also identified 1.898 Å by M06-2X method and observed
2.040 Å by XRD, this also indicate the presence of intro molecular
NAHÁ Á ÁO hydrogen bonding of the title molecule. The internuclear
distance of hydrogen bonding determined from the X-ray data
were summarized in Table 1.
Nitro group is highly electronegative and tries to obtain addi-
tional electron density of the benzene ring. It attempts to draw it
from the neighboring atoms, which moves closer together in order
to share the remaining electrons more easily. The Dnp-ala-ome
complex has electron withdrawing substituent nitro group and
electron donating amide groups. Due to the electronic effects of
push and pull type substituent the symmetry of the benzene ring
is distorted. The bond angles (C7AC8AC9) and (C9AC10AC11) is
found to be 121.6° (B3LYP)/122.1° (M06-2X) and 120.7° (B3LYP)/
121.1° (M06-2X) in the present calculation, which is 120° for nor-
mal benzene. Similarly due to NH substituent on the benzene caus-
es the bond angle (C8AC7AC12 = 115.8° by B3LYP/115.7° by M06-
2X/116.1° by XRD) is smaller than the typical hexagonal angle of
120°. The optimized molecular structure of Dnp-ala-ome revels
that para-substituted nitro moiety get planer
C11AC10AN13AO14 = 0.25°/0.06° where as ortho-substituted
group is also in planar C7AC8AN16AO17 = 0.56°/0.27° and
C9AC8AN16AO18 = 0.52°/0.16° with the benzene ring calculated
by B3LYP/M06-2X methods respectively. From the theoretical val-
ues, it is found that most of the optimized bond lengths are slightly
Fig. 4. Optimized molecular structure and atomic numbering of N-(2,4-dinitrophenyl)-L-alanine methyl ester.
K. Govindarasu, E. Kavitha / Journal of Molecular Structure 1088 (2015) 70–84 73](https://image.slidesharecdn.com/b17d5b6d-b0bf-4fa4-a445-07ce8421e18a-160601043133/85/1-s2-0-S0022286015000939-main-4-320.jpg)
![larger than the experimental values due to fact that the theoretical
calculations belong to isolated molecules in gaseous phase and the
experimental results belong to molecules in solid state.
Vibrational assignments
The experimental and computed vibrational wavenumbers,
their IR intensities and the detailed description of normal modes
of vibration of Dnp-ala-ome, carried out in terms of their contribu-
tion to the potential energy are given in Table 2. DFT vibrational
unsealed wavenumbers are known to be higher than the
experimental wavenumbers due to neglect of anharmonicity
effects, they were scaled down by a uniform scaling factor of
0.9608 [38] and the scaled wavenumbers in general show good
agreement with experimental ones. The Dnp-ala-ome molecule
has 30 atoms, which possess 84 normal modes of vibrations; in
Table 1
Calculated optimized parameter values of N-(2,4-dinitrophenyl)-L-alanine methyl ester [Bond length in (Å), angles in (°)].
Bond length M06-2X B3LYP a,b
Exp Bond Angle M06-2X B3LYP a,b
Exp Dihedral angle M06-2X B3LYP a,b
Exp
C1AC3 1.531 1.539 1.514(b)
C3AC1AO5 121.4 121.3 123.6(b)
O5AC1AC3AN2 À23.91 À27.09 À25.18(b)
C1AO5 1.201 1.207 1.205(b)
C3AC1AO6 118.3 118.9 111.4(b)
O5AC1AC3AC4 96.43 94.02 95.64(b)
C1AO6 1.342 1.350 1.454(b)
O5AC1AO6 120.2 119.6 125.0(b)
O5AC1AC3AH21 À142.73 À145.59 –
N2AC3 1.444 1.452 1.491(b)
C3AN2AC7 124.5 125.7 106.8(b)
O6AC1AC3AN2 161.27 157.10 155.83(b)
N2AC7 1.347 1.350 1.357 C3AN2AH20 116.6 116.9 106.5(b)
O6AC1AC3AC4 À78.39 À81.80 À83.35(b)
N2AH20 1.016 1.018 0.88 C7AN2AH20 118.8 117.3 121.4 O6AC1AC3AH21 42.45 38.60 –
C3AC4 1.540 1.547 1.524(b)
C1AC3AN2 106.5 106.6 106.8(b)
C3AC1AO6AC19 À19.04 À14.29 À1.75(b)
C3AH21 1.095 1.094 0.901(b)
C1AC3AC4 107.7 108.7 111.6(b)
O5AC1AO6AC19 166.08 169.83 177.22(b)
C4AH22 1.092 1.093 0.939(b)
C1AC3AH21 110.1 110.0 111.5(b)
C7AN2AC3AC1 À165.08 À160.80 –
C4AH23 1.093 1.094 0.961(b)
N2AC3AC4 112.0 112.2 110.5(b)
C7AN2AC3AC4 77.40 80.32 –
C4AH24 1.092 1.093 0.930(b)
N2AC3AH21 109.7 109.4 111.5(b)
C7AN2AC3AH21 À45.97 À41.92 –
O6AC19 1.424 1.434 1.454(b)
C4AC3AH21 110.7 109.9 109.9(b)
H20AN2AC3AC1 18.42 21.85 –
C7AC8 1.427 1.436 1.424 C3AC4AH22 110.4 110.3 109.1(b)
H20AN2AC3AC4 À99.11 À97.02 –
C7AC12 1.424 1.427 1.420 C3AC4AH23 111.8 111.7 107.1(b)
H20AN2AC3AH21 137.53 140.73 –
C8AC9 1.388 1.393 1.385 C3AC4AH24 108.7 109.4 108.4(b)
C3AN2AC7AC8 À178.23 À178.76 –
C8AN16 1.459 1.458 1.446 H22AC4AH23 108.8 108.4 114.5(b)
C3AN2AC7AC12 2.48 1.76 –
C9AC10 1.378 1.383 1.367 H22AC4AH24 108.5 108.5 105.7(b)
H20AN2AC7AC8 À1.80 À1.43 –
C9AH25 1.083 1.081 0.930 H23AC4AH24 108.5 108.4 111.9(b)
H20AN2AC1AC12 178.91 179.09 –
C10AC11 1.396 1.402 1.396 C1AO6AC19 121.4 122.5 115.0(b)
C1AC3AC4AH22 À176.61 À177.64 –
C10AN13 1.458 1.458 1.452 N2AC7AC8 123.7 122.9 124.6 C1AC3AC4AH23 62.06 61.67 –
C11AC12 1.374 1.377 1.359 N2AC7AC12 120.7 121.3 119.3 C1AC3AC4AH24 À57.72 À58.35 –
C11AH26 1.083 1.083 0.930 C8AC7AC12 115.7 115.8 116.1 N2AC3AC4AH22 À59.83 À60.02 –
C12AH27 1.082 1.082 0.930 C7AC8AC9 122.1 121.6 121.7 N2AC3AC4AH23 178.84 179.29 –
N13AO14 1.220 1.234 1.238 C7AC8AN16 122.1 122.4 122.3 N2AC3AC4AH24 59.06 59.27 –
N13AO15 1.217 1.231 1.228 C9AC8AN16 115.7 116.0 116.1 H21AC3AC4AH22 62.94 61.93 –
N16AO17 1.226 1.242 1.248 C8AC9AC10 119.3 119.8 119.3 H21AC3AC4AH23 À58.39 À58.76 –
N16AO18 1.215 1.229 1.227 C8AC9AH25 119.8 119.5 120.3 H21AC3AC4AH24 À178.17 À178.78 –
O17AH20 1.898 1.866 2.040 C10AC9AH25 120.9 120.7 120.3 C1AO6AC19AH28 À178.94 À179.19 –
C19AH28 1.089 1.090 0.947(b) C9AC10AC11 121.1 120.7 120.9 C1AO6AC19AH29 62.55 62.50 –
C19AH29 1.093 1.094 1.001(b) C9AC10AN13 119.4 119.6 119.3 C1AO6AC19AH30 À60.91 À61.28 –
C19AH30 1.094 1.094 0.854(b) C11AC10AN13 119.5 119.7 119.8 N2AC7AC8AC9 À178.87 À179.07 173.6
C10AC11AC12 119.6 119.8 120.1 N2AC7AC8AN16 1.15 1.03
C10AC11AH26 119.2 119.1 120.0 C12AC7AC8AC9 0.45 0.43 –
C12AC11AH26 121.2 121.1 120.0 C12AC7AC8AN16 À179.53 À179.46
C7AC12AC11 122.2 122.3 121.6 N2AC7AC12AC11 178.87 179.01 174.1
C7AC12AH27 119.1 119.1 119.2 N2AC7AC12AH27 À1.33 À1.23 –
C11AC12AH27 118.6 118.6 119.2 C8AC7AC12AC11 À0.48 À0.50 –
C10AN13AO14 117.2 117.4 118.0 C8AC7AC12AH27 179.33 179.26 –
C10AN13AO15 117.7 117.9 118.7 C7AC8AC9AC10 À0.20 À0.14 –
O14AN13AO15 125.1 124.7 123.2 N16AC8AC9AH25 179.73 À0.20 –
C8AN16AO17 118.4 118.6 118.3 C7AC8AN16AO17 0.27 0.56 –
C8AN16AO18 118.1 118.4 119.3 C7AC8AN16AO18 À179.79 À179.58 À173.7
O17AN16AO18 123.5 123.1 122.5 C9AC8AN16AO17 À179.96 À179.34 À173.5
O6AC19AH28 105.4 105.2 105.5(b) C9AC8AN16AO18 0.16 0.52 –
O6AC19AH29 112.2 112.2 114.3(b) C8AC9AC10AC11 À179.82 À0.11 –
O6AC19AH30 111.0 111.3 110.8(b) C8AC9AC10AN13 0.05 À179.93 À174.4
H28AC19AH29 109.0 108.9 102.3(b) H25AC9AC10AC11 À0.06 179.84 –
H28AC19AH30 109.1 109.0 113.8(b) H25AC9AC10AN13 179.99 0.03 –
H29AC19AH30 109.9 110.0 110.4(b) C9AC10AC11AC12 À179.98 0.05 –
C9AC10AC11AH26 0.06 À179.77 –
N13AC10AC11AC12 0.03 179.86 173.9
N13AC10AC11AH26 À179.85 0.05 –
C9AC10AN13AO14 179.98 179.88 172.5
C9AC10AN13AO15 0.11 À0.15 –
C11AC10AN13AO14 0.25 0.06 –
C11AC10AN13AO15 À179.55 À179.97 176.2
C10AC11AC12AC7 À179.87 0.28 –
C10AC11AC12AH27 0.32 À179.48 –
H26AC11AC12AC7 0.25 À179.91 –
H26AC11AC12AH27 À179.55 0.33 –
Hydrogen-bond geometry (Å, °) Ref. [27]
DAHÁ Á ÁA DAH HÁ Á ÁA DÁ Á ÁA DAHÁ Á ÁA
N2AH20Á Á ÁO17 0.89 2.04 2.642 124
a,b
Taken from Refs. [27,28].
74 K. Govindarasu, E. Kavitha / Journal of Molecular Structure 1088 (2015) 70–84](https://image.slidesharecdn.com/b17d5b6d-b0bf-4fa4-a445-07ce8421e18a-160601043133/85/1-s2-0-S0022286015000939-main-5-320.jpg)
![agreement with C1 point group symmetry. All vibrations are active
both in Raman and infrared spectra. The potential energy distribu-
tion (PED) for each normal mode among the symmetry coordinates
of the molecules was calculated.
Root mean square (RMS) values were obtained in the study
using the following expression
ffiffiffiffiffiffiffiffiffiffiffiffiffiffiffiffiffiffiffiffiffiffiffiffiffiffiffiffiffiffiffiffiffiffiffiffiffiffiffiffiffiffiffiffiffiffiffiffiffi
1
n À 1
Xn
i
ðvcal
i À vexp
n Þ
2
r
where n is the number of the experimental or calculated data. The
RMS error was calculated between scaled B3LYP/6-31G(d,p) and
experimental frequencies. This is quite obvious since the frequen-
cies calculated on the basis of quantum mechanical force fields usu-
ally differ appreciably from observed frequencies. This is partly due
to the neglect of anharmonicity and partly due to the approximate
nature of the quantum mechanical methods. In order to reproduce
the observed frequencies, refinement of scaling factors were applied
and optimized via least square refinement algorithm which resulted
in a weighted RMS deviation of the observed IR and Raman bands
are found to be 20.39 and 8.10 respectively. The small differences
between experimental and calculated vibrational modes are
observed. It must be due to the fact that hydrogen bond vibrations
present in the crystal lead to strong perturbation of the IR
wavenumbers and intensities of many other modes.
CAC vibrations
The CAC stretching modes of the phenyl group are expected in
the range from 1650 to 1200 cmÀ1
. 1,2,4-Tri substituted benzene
shows the degenerate modes in the range 1545–1605 and 1585–
1645 cmÀ1
. Another degenerate mode in the range 1370–1455
and 1415 –1520 cmÀ1
[39]. In the present work CAC stretching
vibrations observed at 1604 cmÀ1
in FTIR spectrum and
1619 cmÀ1
in FT-Raman spectrum. The computed wavenumbers
at 1611, 1412 and 1351 cmÀ1
by B3LYP method corresponds to
the CAC stretching modes. Berezhinsky et al. [40] observed CAC
stretching vibrations of b-alanine in the range 900–845 cmÀ1
in
FT-Raman spectrum and 890 and 847 cmÀ1
in FTIR spectrum. In
the present case CAC stretching for alanine group is observed at
1051 cmÀ1
in FTIR 1058 cmÀ1
in FT-Raman spectrum. The
theoretically computed wavenumbers at 1056 and 1046 cmÀ1
are
assigned C1AC3 and C3AC4 stretching vibrations respectively.
The CACAC inplane bending bands always occur between the val-
ue 1000–600 cmÀ1
[41]. The band at 634 cmÀ1
in FTIR and
643 cmÀ1
in FT-Raman spectrum observed as a CACAC inplane
bending bands of the phenyl ring, these bands are computed at
1098, 1034, 642, 393 cmÀ1
by B3LYP method. Rosado et al. [9]
assigned the CACAC inplane bending vibration at 246 cmÀ1
for
a-alanine and at 187 cmÀ1
for b-alanine by RHF/6-31G⁄
calcula-
tion. In our present work the scaled wavenumber at 190 cmÀ1
is
corresponding to CACAC inplane bending vibrations of the alanine
group, which is evident from the PED column almost, contributed
to 37%. The CACAC out off plane bending vibrations observed the
weak bands at 518 and 165 cmÀ1
in FT-Raman spectrum. The
theoretically predicted wavenumbers at 685, 668, 508, 505 and
162 cmÀ1
are assigned as CACAC out off plane bending vibrations
by B3LYP method, this is good agreement with experimental
findings.
CAH vibrations
The CAH stretching vibrations give rise to bands in the region
3000–3100 cmÀ1
in all the aromatic compounds [42,43]. Since
Dnp-ala-ome is a trisubstituted aromatic system, it has three adja-
cent CAH moieties. The CAH stretching modes of the benzene ring
is observed at 3114 cmÀ1
in FTIR spectrum and 3106 cmÀ1
in FT-
Raman spectrum, these modes (Mode nos: 2, 3, 4) are computed
at 3140, 3118 and 3103 cmÀ1
by B3LYP method. This is evident
from the PED column these modes are almost contributed to 80–
100%. The CÀH in-plane bending modes are normally observed in
the region of 1300–1000 cmÀ1
. These modes are observed at
1514 cmÀ1
in FTIR spectra and the corresponding frequencies are
attributed to the wavenumbers 1510, 1417, 1256, 1211, 1160
and 1098 cmÀ1
by B3LYP method. The out-of plane CAH bending
vibrations of the aromatic compounds occur in the region of
1000–750 cmÀ1
; the bands are sharp but are of weak to medium
intensity. In our case cCH modes are identified at 953, 799,
709 cmÀ1
by B3LYP method.
For the methyl group, the asymmetric stretching vibration is
observed in the region 2940–3010 cmÀ1
, and the symmetric
stretching vibrations appear in the region [44] 2840–2970 cmÀ1
.
In our present work the computed wavenumbers of modes 6 7
corresponding to the taCH3 group are 3026 and 3016 cmÀ1
. The
weak band observed at 2889 cmÀ1
in the FT-IR spectrum could
be attributed to CH3 symmetric stretching vibration. The
theoretically computed value of 2942 cmÀ1
shows good agreement
with experimental results for symmetric stretching vibrations of
CH3 group. The asymmetric deformations [44] dasCH3 are observed
with band intensities that are weak, mostly medium or sometimes
strong is expected at 1460 ± 25 and 1435 ± 35 cmÀ1
. The overlap
between the two regions is quite considerable so that for many
Table 2 (continued)
Mode Nos. Experimental wavenumbers/cmÀ1
Theoretical wavenumbers/cmÀ1
PED (P5%) with assignments
B3LYP/6-31G(d,p)
FT-IR FT-Raman Unscaled Scaled a
IIR
b
IRA
72 212 204 7.63 2.23 dCCN(52) + sHCCN(20) + dCOC(15)
73 198 190 0.36 6.11 dC1C3C4(37) + dC9C10N13(14) + dC7C8N16(5)
74 166 159 0.47 3.17 sHCOC(89)
75 165w 168 162 4.65 3.96 cCCCC(61)Ring + sHCOC(7)
76 165 158 0.76 0.97 dCCN(48) + sHCOC(29)
77 129 124 2.23 1.14 cCOCC(69)
78 124 119 0.70 2.20 sCCNC(41) + cCCCC(10)Ring
79 82w 95 91 0.55 4.13 dCCN(29)
80 72 69 3.28 6.88 dCCN(37) + dCNC(14)
81 64 62 0.97 11.41 sCCNO(76) + sCCCO(16)
82 59 57 0.58 8.39 sCCNO(76)
83 39 37 1.70 8.87 sCNCC(59)
84 32 30 2.12 65.86 sCCNC(50) + sCNCC(12)
m – stretching; d – in-plane bending; c – out-of-plane bending; s – torsion; q – rocking; w – weak; s – strong; vs – very strong; vw – very weak.
a
IIR-IR Intensity (kmmolÀ1
).
b
IRa-Raman intensity (Arb units) (intensity normalized to 100%).
76 K. Govindarasu, E. Kavitha / Journal of Molecular Structure 1088 (2015) 70–84](https://image.slidesharecdn.com/b17d5b6d-b0bf-4fa4-a445-07ce8421e18a-160601043133/85/1-s2-0-S0022286015000939-main-7-320.jpg)
![molecules the deformation often coincides. The symmetric defor-
mation [44] dsymCH3 appears with an intensity varying from
medium to strong in the region 1375 ± 15 cmÀ1
. In our work the
computed wavenumber at 1461 and 1444 cmÀ1
by B3LYP method
identified as daCH3 modes. The dsCH3 modes (Mode nos: 25 27)
were identified at 1370 and 1349 cmÀ1
by B3LYP method.
For the methoxy group compounds [45], the asymmetric
stretching mode appears in the range 2825–2870 cmÀ1
, lower in
magnitude compared to its value in CH3 compounds (2860–
2935 cmÀ1
) whereas the asymmetric stretching modes for both
the types of compounds lie in the same region 2925–2985 cmÀ1
.
In the present investigation asymmetric CAH stretching mode
observed the weak band at 2991 cmÀ1
; these bands are computed
at 3044 and 3002 cmÀ1
by B3LYP method. The weak band at
2819 cmÀ1
in FTIR spectra observed as symmetric CAH stretching
vibration of the methoxy group. The theoretically computed
wavenumber at 2929 cmÀ1
for tCAH vibration by B3LYP method
shows good agreement with experimental findings. The methyl
rocking modes [44] are expected in the regions 1100 ± 95 and
1080 ± 80 cmÀ1
. In our molecule the computed wavenumber at
1203 and 1123 cmÀ1
was assigned to CH rocking mode (Mode
nos: 33 35) by B3LYP method which is evident from the PED col-
umn contributed to 14%. The butterfly mode (Mode no: 22) of CH3
is observed at 1429 cmÀ1
in FTIR and at 1437 cmÀ1
in FT-Raman
spectrum; these bands are also computed at 1434 cmÀ1
by DFT
method, PED exactly contributed to 78% for this mode. The
theoretically predicted wavenumbers at 1452 and 1449 cmÀ1
are
assigned to CH3 wagging modes (Mode nos: 19 and 20), for these
modes the PED contributed to 60%. The observed weak band at
2965 cmÀ1
in FT-Raman spectra was identified as C3AH21 stretch-
ing vibration and it is also computed at 2956 cmÀ1
by B3LYP
method, This is a pure mode, contribution of PED for this mode
(Mode no: 9) is 97%.
NAH vibrations
The NAH stretching vibrations generally give rise to bands [46]
at 3500–3400 cmÀ1
. In the present study, the NAH stretching band
observed at 3390 cmÀ1
in the IR spectrum. Furthermore the NAH
stretching frequency is red shifted by 37 cmÀ1
in the IR spectrum
with a strong intensity from the computed frequency at
3353 cmÀ1
, which indicates weakening of the NAH bond resulting
in proton transfer to the neighboring units (NAHÁ Á ÁO). The CNH
vibration where the nitrogen and the hydrogen move in opposite
directions relative to the carbon atom involves both NH bend
and CN stretching and absorbs [47] near 1500 cmÀ1
. The CNH
vibration where N and H atoms move in the same direction relative
to the carbon atom gives rise to a weaker band [47] near
1250 cmÀ1
. In our present study the theoretically predicted
wavenumbers at 1557, 1417, 1412 and 1256 cmÀ1
by B3LYP
method are assigned to CNH inplane bending vibrations.
CAN vibrations
The identification of CAN stretching vibration is a difficult task
because mixing of several bands is possible in this region. Silver-
stein et al. [48] assigned the CAN stretching absorption in the
region 1382–1286 cmÀ1
for aromatic amines. The CAN stretching
mode is reported at 1368 cmÀ1
for benzamide, [49] at 1382,
1307 cmÀ1
for benzotriazole [50] and at 1335 and 1331 cmÀ1
for
2,4-dinitrophenylhydrazine.[50] primary aromatic amines with
nitrogen directly on the ring absorbs strongly at 1330–1260 cmÀ1
due to stretching of the phenyl carbon–nitrogen bond [51]. In the
present study the observed band at 1514, 1153 and 920 cmÀ1
in
FTIR and 1329 and 917 cmÀ1
in FT-Raman are identified as CAN
stretching vibrations. The predicted wavenumbers give these mod-
es at 1510, 1331, 1150, 914 cmÀ1
by B3LYP method. The observed
weak band at 634 cmÀ1
in FTIR and 643 cmÀ1
in FT-Raman
theoretically computed wavenumber at 642 cmÀ1
are assigned as
C7AN2AC3 inplane bending vibrations. The CACAN inplane bend-
ing vibrations are observed weak bands at 221 and 82 cmÀ1
in FT-
Raman spectrum. The calculated wavenumbers at 393, 259, 225,
158 and 91 cmÀ1
by B3LYP method are identified as CACAN
inplane bending vibrations. The weak bands at 300 and 280 cmÀ1
in FT-Raman spectra are NCCC out-off plane bending modes (Mode
nos: 68 and 69), these modes are agrees very well with calculated
wavenumbers at 314 and 286 cmÀ1
by B3LYP method. This is evi-
dent from the PED colomn almost contributed to 57%.
CAO and C@O vibrations
The carbonyl stretching C@O vibrations [44] are expected in the
region 1715–1680 cmÀ1
and in the present study this mode
appears at 1735 cmÀ1
in the IR spectrum as a strong band and at
1734 cmÀ1
in the Raman spectrum as a weak band. The B3LYP cal-
culations give this mode at 1774 cmÀ1
. The medium intense band
at 1051 cmÀ1
in FT-IR and 1115 and 1058 cmÀ1
FT-Raman spec-
trum corresponding to the computed wavenumber 1116 and
1056 cmÀ1
is assigned to the CAO stretching mode. The computed
wavenumber at 1018 cmÀ1
have been assigned to C@OAO bending
mode. The weak band at 408 cmÀ1
and 300 cmÀ1
in FT-Raman
spectra are assigned to CAOAC bending modes which is supported
by calculation also.
NO2 vibrations
For molecules with an NO2 group, the NO2 asymmetric stretch-
ing vibration band range is 1625–1540 cmÀ1
and that of the sym-
metric stretching vibration is 1400–1360 cmÀ1
[52]. In our work
the bands seen at very strong intensity band at 1604 cmÀ1
in FTIR
and weak intensity band at 1619 cmÀ1
in FT-Raman spectrum have
been identified to taNO2 vibrations. The computed wavenumbers
at 1611 and 1591 cmÀ1
by B3LYP method are identified as taNO2.
The theoretically predicted bands at 1417 and 1294 cmÀ1
also
assigned as tNO2 modes. The NO2 scissors occur at higher
wavenumbers (850 ± 60 cmÀ1
) to aromatic molecules [53,54]. The
bands at 823 cmÀ1
in FTIR and 834 cmÀ1
in FT-Raman spectrum
have been identified to scissoring mode dNO2. The calculated val-
ues are 887, 822 and 808 cmÀ1
for this dNO2. In aromatic com-
pounds the wagging mode dNO2 is assigned at 740 ± 50 cmÀ1
with a moderate to strong intensity [44]. The DFT calculations give
the wagging mode xNO2 at 699 cmÀ1
. The rocking mode qNO2 is
active in the region 540 ± 70 cmÀ1
in aromatic nitro compounds
[44]. In our work the weak FT-Raman bands at 518 and 361 cmÀ1
and computed wavenumbers at 508 and 375 cmÀ1
are identified
as qNO2 modes (Mode nos: 61 and 66).
Intramolecular interactions
As follows from the experimental X-ray diffraction data [34],
but also from the present study, an intramolecular HB is formed
in Dnp-ala-ome and this conclusion is sustained by the HB para-
meters given below. The NAHÁ Á ÁO hydrogen bond (HB) is formed
between H atom of NH and oxygen (O17) atom of the nitro group.
The shortest donor and acceptor distance (NAHÁ Á ÁO) amount to
2.642 Å. We consider the following parameters of XAHÁ Á ÁY hydro-
gen bonds: XAH bond length, HÁ Á ÁY distance, XAY and XAHÁ Á ÁY
angle (for NAHÁ Á ÁO studied here: NAH = 0.89 Å, HÁ Á ÁO = 2.04 Å,
NÁ Á ÁO = 2.642 Å and NAHÁ Á ÁO angle = 124°
). These geometrical
parameters obtained from X-ray experiment as well as those being
the result of calculations are given in Table 1. This nitro group incli-
nation may facilitate intra molecular charge transfer from the NH
to the NO2 group. Due to this intra molecular interaction the
observed NH stretching frequency at 3390 cmÀ1
is shifted from
the calculated frequency at 3353 cmÀ1
by DFT method.
K. Govindarasu, E. Kavitha / Journal of Molecular Structure 1088 (2015) 70–84 77](https://image.slidesharecdn.com/b17d5b6d-b0bf-4fa4-a445-07ce8421e18a-160601043133/85/1-s2-0-S0022286015000939-main-8-320.jpg)
![Analysis of vibrational calculations
The correlation graphics between the experimental and calcu-
lated wavenumbers were graphed, calculated by DFT/B3LYP
method. The correlation graphics which described harmony
between the calculated and experimental wavenumbers (Infrared
and Raman) were given in Fig. 5a and b. As can be seen from
Fig. 5, experimental fundamentals have a better correlation and
the relations between the calculated and experimental wavenum-
bers are usually linear and described for infrared and Raman,
respectively by the following equations;
#cal ¼ 1:001#exp þ 2:311; ðR2
¼ 0:999 for InfraredÞ
#cal ¼ 0:999#exp þ 2:625; ðR2
¼ 0:999 for RamanÞ
NBO analysis
The natural bonding orbital’s (NBO) calculations are performed
using NBO 4.0 program as implemented in the Gaussian 09W [16]
package at the B3LYP/6-31G(d,p) level in order to understand var-
ious second order interactions between the filled orbital of one
subsystem, which is a measure of the intermolecular delocalization
or hyper conjugation. The larger the E(2) value, the more intensive
is the interaction between electron donors and electron acceptors,
i.e., the increasing donating tendency from electron donors to elec-
tron acceptors and the greater the extent of conjugation of the
whole system. Delocalization of electron density between occupied
Lewis-type (bond or lone pair) NBO orbitals and formally unoccu-
pied (anti bond or Rydberg) non-Lewis NBO orbitals correspond to
a stabilizing donor–acceptor interaction. The result of interaction is
a loss of occupancy from the concentrations of electron NBO of the
idealized Lewis structure into an empty non-Lewis orbital. For each
donor (i) and acceptor (j), the stabilization energy E(2) associates
with the delocalization i ? j is estimated as.
E2 ¼ DEij ¼ qi
Fði; jÞ
2
ej À ei
qi is the donor orbital occupancy; Ei, Ej is the diagonal elements and
Fij is the off diagonal NBO Fock matrix element. Natural bond orbital
analysis is used for investigating charge transfer or conjugative
interaction in the molecular system.
In our present study the second-order perturbation theory ana-
lysis of Fock matrix in the NBO basis of the molecule shows the
strong intramolecular hyperconjugative interactions and stability
of the molecule. The hyperconjugative interaction and electron
density transfer from lone electron pair of the O17 atom to the
N2AH20 antibonding orbital in the N2AH20Á Á ÁO17 system has
been predicted. This hydrogen bonding is formed by the orbital
overlap between LP(2)O17 and r⁄
(N2AH20) which consequences
intramolecular charge transfer (ICT) causing stabilization of the
hydrogen bonded system. The interaction between lone pair
LP(2)O15/LP(1)O17 with r⁄
(N2AH20) results in a stabilization
energy of 10.58/4.53 kJ/mol respectively that denotes larger delo-
calization (Table 3). The p (C8AC9) bond is interacting with p⁄
(-
N16AO18), LP⁄
(1) C7 and LP⁄
(1) C10 with the energies 29.05,
55.55 and 37.53 kJ/mol respectively. The hyper conjugative inter-
action between r(C9AH25) ? r⁄
(C7AC8) having stabilization
energy 5.24 kJ/mol. The r⁄
electron of (C10AN13) distribute to
r⁄
(C11AC12) and r⁄
(C11AH26) which leads to low delocalization
energy 1.04 and 1.18 kJ/mol respectively. The important interac-
tions in the title molecule having p⁄
(N16AO18) ? p⁄
(C8AC9) with
that of antibonding results the stabilization of 18.98 kJ/mol. The
maximum energies occurs from LP(1)C10 to antibonding p⁄
(-
N13AO15) with delocalization energy 386.36 kJ/mol.
Static polarizability and first order hyperpolarizability
Quantum chemical calculations have been shown to be useful in
the description of the relationship between the electronic structure
of the systems and its NLO response [55]. The computational
approach allows the determination of molecular NLO properties
as an inexpensive way to design molecules by analyzing their
potential before synthesis and to determine high-order hyperpo-
larizability tensors of molecules.
The static polarizability (a) and the hyper polarizability (b) and
the electric dipole moment (l) of the Dnp-ala-ome are calculated
by finite field method using 6-31G(d,p) basis set. To calculate all
the electric dipole moments and the first hyper polarizabilities
for the isolated molecule, the origin of the Cartesian coordinate
system (x,y,z) = (0,0,0) was chosen at own center of mass of
Dnp-ala-ome. The NLO activity provide the key functions for fre-
quency shifting, optical modulation, optical switching and optical
logic for the developing technologies in areas such as communica-
tion, signal processing and optical interconnections [56,57].
In discussing nonlinear optical properties, the polarization of
the molecule by an external radiation field is often approximated
as the creation of an induced dipole moment by an external electric
field. Under the weak polarization condition, we can use a Taylor
series expansion in the electric field components to demonstrate
the dipolar interaction with the external radiation electric field.
500 1000 1500 2000 2500 3000 3500
500
1000
1500
2000
2500
3000
3500
Theoreticalwavenumber(cm-1
)
Experimental wavenumber (cm-1
)
0 500 1000 1500 2000 2500 3000 3500
0
500
1000
1500
2000
2500
3000
3500
Theoreticalwavenumber(cm-1
)
Experimental wavenumber (cm-1
)
cal =1.001 exp+2.311; (R2
=0.999 for Infrared)
cal =0.999 exp+2.625; (R2
=0.999 for Raman)
(a) IR
(b) Raman
Fig. 5. (a) The correlation graphics of calculated and experimental IR frequencies.
(b) Correlation graphic of calculated and experimental Raman frequencies.
78 K. Govindarasu, E. Kavitha / Journal of Molecular Structure 1088 (2015) 70–84](https://image.slidesharecdn.com/b17d5b6d-b0bf-4fa4-a445-07ce8421e18a-160601043133/85/1-s2-0-S0022286015000939-main-9-320.jpg)
![The first static hyperpolarizability (b0) and its related properties
(b, a0 and Da) have been calculated using B3LYP/6-31G(d,p) level
based on finite field approach. In the presence of an applied electric
field, the energy of a system is a function of the electric field and
the first hyperpolarizability is a third rank tensor that can be
described by a 3 Â 3 Â 3 matrix. The 27 components of the 3D
matrix can be reduced to 10 components because of the Kleinman
symmetry [58]. The matrix can be given in the lower tetrahedral
format. It is obvious that the lower part of the 3 Â 3 Â 3 matrices
is a tetrahedral. The components of b are defined as the coefficients
in the Taylor series expansion of the energy in the external electric
field. When the external electric field is weak and homogeneous,
this expansion is given below:
E ¼ Eo
À laFa À 1=2aabFaFb À 1=6babcFaFbFcþ . . . . . .
where Eo
is the energy of the unperturbed molecules, Fa is the field
at the origin, la, aab and babc are the components of dipole moment,
polarizability and first hyperpolarizability, respectively.
The total static dipole moment l, the mean polarizability a0, the
anisotropy of the polarizability Da and the mean first hyperpolar-
izability b0, using the x, y and z components are defined as:
Dipole moment is
l ¼ ðl2
x þ l2
y þ l2
z Þ
1=2
Static polarizability is
a0 ¼ ðaxx þ ayy þ azzÞ=3
Total polarizability is
Da ¼ 2À1=2
½ðaxx À ayyÞ2
þ ðayy À azzÞ2 þ ðazz À axxÞ2
þ 6a2
xzŠ
1=2
First order hyperpolarizability is
b ¼ ðb2
x þ b2
y þ b2
z Þ
1=2
where
bx ¼ ðbxxx þ bxyy þ bxzzÞ
by ¼ ðbyyy þ byzz þ byxxÞ
bz ¼ ðbzzz þ bzxx þ bzyyÞ
b ¼ ½ðbxxx þ bxyy þ bxzzÞ2
þ ðbyyy þ byzz þ byxxÞ2
þ ðbzzz þ bzxx þ bzyyÞ2
Š
1=2
Since the values of the polarizabilities (a) and hyperpolariz-
ability (b) of the Gaussian 09 output are reported in atomic units
(a.u.), the calculated values have been converted into electrostatic
units (esu) (For a: 1 a.u. = 0.1482 Â 10À24
esu; For b:
1 a.u. = 8.639 Â 10À33
esu). The mean polarizability a0 and total
polarizability Da of our title molecule are 23.4833 Â 10À24
esu
and 17.2405 Â 10À24
esu respectively. The total molecular dipole
moment and first order hyperpolarizability are 3.4987 Debye and
14.94 Â 10À30
esu, respectively and are depicted in Table 4. Total
dipole moment of Dnp-ala-ome molecule is approximately three
times greater than that of urea and first order hyperpolarizability
is 40 times greater than that of urea (l and b of urea are
1.3732 Debye and 0.3728 Â 10À30
esu [59]). This result indicates
the good nonlinearity of the title molecule.
Table 3
Second order Perturbation theory analysis of Fock Matrix in NBO basis for N-(2,4-dinitrophenyl)-L-alanine methyl ester.
Donor (i) ED (i)(e) Acceptor (j) ED (j)(e) E(2)a
kJ molÀ1
E(j)–E(i)b
a.u F(i,j)c
a.u
p(C8AC9) 1.674 p⁄
(N16AO18) 0.638 29.05 0.15 0.065
LP⁄
(1) C7 0.917 55.55 0.14 0.094
LP⁄
(1) C10 1.122 37.53 0.14 0.083
p(C11AC12) 1.739 LP⁄
(1) C7 0.917 51.65 0.14 0.092
LP⁄
(1) C10 1.122 36.05 0.14 0.093
p(N13AO15) 1.986 LP(3)O14 1.457 11.81 0.18 0.077
p(N16AO18) 1.988 LP(3)O17 1.487 11.14 0.17 0.076
r (C9AH25) 1.971 r ⁄
(C7AC8) 0.029 5.24 1.03 0.065
LP (1) N2 1.651 LP⁄
(1) C7 0.917 145.15 0.12 0.139
LP (1) O5 1.976 RY⁄
(1)C1 0.017 16.64 1.49 0.141
LP (2) O5 1.834 r ⁄
(C1AC3) 0.082 20.22 0.60 0.100
r ⁄
(C1AO6) 0.098 32.84 0.63 0.130
LP (2) O6 1.795 p⁄
(C1AO5) 0.199 41.87 0.35 0.109
LP⁄
(1)C7 0.917 p⁄
(C8AC9) 0.369 47.49 0.14 0.092
p⁄
(C11AC12) 0.262 42.76 0.15 0.095
LP(1)C10 1.122 p⁄
(C8AC9) 0.369 88.81 0.15 0.118
p⁄
(C11AC12) 0.262 66.51 0.16 0.110
p⁄
(N13AO15) 0.639 386.36 0.02 0.089
LP (2)O14 1.898 r⁄
(C10AN13) 0.101 12.13 0.58 0.075
r⁄
(N13AO15) 0.056 19.04 0.71 0.105
LP (3)O14 1.457 p⁄
(N13AO15) 0.639 159.36 0.14 0.138
LP (2)O15 1.896 r⁄
(C10AN13) 0.101 12.55 0.58 0.076
r⁄
(N13AO14) 0.369 19.35 0.70 0.105
LP (2)O17 1.487 r⁄
(N2AH20) 0.050 10.58 0.78 0.082
r⁄
(N16AO18) 0.052 19.46 0.74 0.109
p⁄
(N16AO18) 0.638 142.15 0.15 0.134
LP (1)O17 1.487 r⁄
(N2AH20) 0.051 4.53 1.24 0.067
LP (2)O18 1.888 r⁄
(N16AO17) 0.060 19.56 0.68 0.105
r⁄
(C10AN13) 0.101 r⁄
(C11AC12) 0.013 1.04 0.28 0.064
r⁄
(C11AH26) 0.013 1.18 0.17 0.053
p⁄
(N16AO18) 0.638 p⁄
(C8AC9) 0.369 18.98 0.13 0.063
ED means Electron Density.
a
E(2) means energy of hyper conjugative interactions.
b
Energy difference between donor and acceptor i and j NBO orbitals.
c
F(i,j) is the Fock matrix element between i and j NBO orbitals.
K. Govindarasu, E. Kavitha / Journal of Molecular Structure 1088 (2015) 70–84 79](https://image.slidesharecdn.com/b17d5b6d-b0bf-4fa4-a445-07ce8421e18a-160601043133/85/1-s2-0-S0022286015000939-main-10-320.jpg)
![Electronic properties
UV–Vis spectral analysis
Ultraviolet spectra analyses of Dnp-ala-ome have been investi-
gated in ethanol, water and gas phase by theoretical calculation.
On the basis of fully optimized ground-state structure, TDDFT/
B3LYP/6-31G(d,p) calculations have been used to determine the
low-lying excited states of Dnp-ala-ome. The experimental UV
spectrum (in ethanol) is shown in Fig. 6. Calculations involving
the vertical excitation energies, oscillator strength (f) and wave-
length (k) have been carried out and the results were compared
(Table 5) with the measured experimental wavelength. In the the-
oretical electronic absorption of Dnp-ala-ome, there are three
absorption bands with a maximum 499.61, 394.30 and
390.15 nm, obtained by B3LYP method in ethanol solvent and
500.81, 394.89, 389.66 nm in water and 463.01, 398.53,
389.54 nm in gas phase. Due to the Frank–Condon principle, the
maximum absorption peak (kmax) in an UV–Vis spectrum corre-
sponds to vertical excitation. Moreover, as can be seen, calculations
performed at ethanol and water are very close to each other when
compared with gas phase and also the absorption maxima values
of gas phase are smaller than that of the organic solvents. Highly
pure, non-polar solvents such as saturated hydrocarbons do not
interact with solute molecules either in the ground or excited state
and the absorption spectrum of a compound in these solvents is
similar to the one in a pure gaseous state. However, polar solvents
such as water, alcohols etc. may stabilize or destabilize the mole-
cular orbitals of a molecule either in the ground state or in excited
state and the spectrum of a compound in these solvents may sig-
nificantly vary from the one recorded in a hydrocarbon solvent.
In our case the calculated absorption bands have slight red-shift
(Bathochromic shift) with the values of 499.61 nm in ethanol and
500.81 nm in water comparing with the gas phase calculations of
463.01 by TD-DFT method. Experimentally, electronic absorption
spectra of title molecule in ethanol solvent showed three bands
at 339, 262 and 269 nm, these excitations correspond to p–p⁄
tran-
sition. In case of p–p⁄
transitions, the excited states are more polar
than the ground state and the dipole–dipole interactions with sol-
vent molecules lower the energy of the excited state more than
that of the ground state. Therefore a polar solvent decreases the
energy of p–p⁄
transition and absorption maximum appears
36.60 and 37.80 nm red shifted in going from gas phase to ethanol
and water solvents respectively. Calculations of the molecular orbi-
tal geometry show that the visible absorption maxima of this
molecule correspond to the electron transition between frontier
orbitals such as translation from HOMO to LUMO.
Frontier molecular orbital analysis
Molecular orbital and their properties like energy are very use-
ful to the physicists and chemists and their frontier electron densi-
ty used for predicting the most reactive position in p-electron
system and also explained several types of reaction in conjugated
systems [60]. Both the highest occupied molecular orbital (HOMO)
and the lowest unoccupied molecular orbital (LUMO) are the main
Table 4
The electric dipole moment, polarizability and first order hyperpolarizability of N-(2,4-dinitrophenyl)-L-alanine methyl ester by B3LYP/6-31G(d,p) method.
Dipole moment, l (Debye) Polarizability a First order hyperpolarizability b
Parameter Value (DB) Parameter a.u. esu (Â10À24
) Parameter a.u. esu (Â10À33
)
lx 2.4315 axx 161.9781 24.0052 bxxx À371.9104 À3212.93
ly 0.2660 axy 28.4598 4.2177 bxxy À113.2015 À977.948
lz À2.5016 ayy 89.6769 13.2901 bxyy 18.2198 157.4009
l 3.4987 axz À3.4046 À0.5046 byyy 45.1699 390.2228
ayz 26.7343 3.9620 bxxz 71.0980 614.2156
azz 223.7160 33.1547 bxyz 145.0953 1253.4783
ao 158.457 23.4833 byyz 134.7389 1164.009
Da 116.3333 17.2405 bxzz 548.2902 4736.679
byzz 495.1725 4277.795
bzzz 1459.1281 12605.41
btot 1729.8632 14944.2884
b = (14.94 Â 10À30
esu)
200 300 400 500 600 700 800
0.0
0.5
1.0
1.5
2.0
2.5
339
262
229
Absorbance
Wavelength (nm)
Experimental UV spectra
Fig. 6. The UV–Vis spectrum (Ethanol) of N-(2,4-dinitrophenyl)-L-alanine methyl
ester.
Table 5
Comparison of experimental and calculated absorption wavelength (k, nm), excitation
energies (E, eV) and oscillator strength (f) of N-(2,4-dinitrophenyl)-L-alanine methyl
ester.
TD-DFT/B3LYP/6-31G(d,p) Experimental
k (nm) E (eV) f Major contributes k (nm) Abs
Ethanol
499.61 2.4816 0.1028 H?L 339.00 2.165
394.30 3.1444 0.3292 H?L+1 262.00 1.077
390.15 3.1779 0.0006 HÀ1?L 229.00 1.082
Water
500.81 2.4757 0.1013 H?L
394.89 3.1397 0.3254 H?L+1
389.66 3.1819 0.0005 HÀ1?L
Gas phase
463.01 2.6778 0.0801 H?L
398.53 3.1111 0.0000 HÀ1?L, HÀ2?L
389.54 3.1828 0.0000 HÀ2?L, HÀ2?L+1, HÀ4?L
80 K. Govindarasu, E. Kavitha / Journal of Molecular Structure 1088 (2015) 70–84](https://image.slidesharecdn.com/b17d5b6d-b0bf-4fa4-a445-07ce8421e18a-160601043133/85/1-s2-0-S0022286015000939-main-11-320.jpg)
![orbital taking part in chemical reaction. The HOMO energy charac-
terizes the ability of electron giving, LUMO characterizes the ability
of electron accepting, and the gap between HOMO and LUMO char-
acterizes the molecular chemical stability [61]. In order to evaluate
the energetic behavior of the title compound, we carried out calcu-
lations in ethanol, water and gas. According to the investigation on
FMO energy levels of the title compound, we have found that the
corresponding electronic transfer happened between HOMO and
LUMO, HOMO and LUMO+1, HOMO and LUMO+2 orbitals, respec-
tively. Surfaces for the Frontier orbitals were drawn to understand
the bonding scheme of present compound. The plots of the HOMO
and LUMO orbitals computed at the TD-DFT-B3LYP/6-31G(d,p)
level for title compound have been illustrated in Fig. 7 (in ethanol
water and gas phase). The calculated energy value of HOMO is
À6.5344, À6.5227 and À6.7480 eV in ethanol, water and gas,
respectively. LUMO is À3.6872, À3.6867 and À3.7040 eV in etha-
nol, water and gas, respectively. The value of energy gap between
the HOMO and LUMO is 2.8472, 2.8360 and 3.0440 eV in ethanol,
water and gas, respectively. The energy gap of HOMO–LUMO
explains the eventual charge transfer interaction within the mole-
cule, which influences the biological activity of the molecule. Fur-
thermore, in going from the gas phase to the solvent phase, the
decreasing value of the energy gap. According to Fig. 7, the positive
phase is red and the negative one is green. It is clear from the figure
that, while the HOMO is localized on the whole molecule except
methyl group in methoxy, LUMO is localized on the phenyl ring
and NO2 group and NH group except CH, CH3 and OACH3 groups
of our molecule identified in both ethanol, water and gas
environment.
Natural population analysis
The calculation of atomic charges plays an important role in the
application of quantum mechanical calculations to molecular sys-
tems because of atomic charges effect electronic structure, dipole
moment, molecular polarizability and other properties of molecu-
lar systems. The atomic charges of the neutral, cationic and anionic
species of Dnp-ala-ome determined in gas phase by natural
population analysis (NPA) using B3LYP method is presented in
Supplementary material S1. Among the carbon atoms C1
(0.839e), C7 (0.229e) of title molecule have positive charges. The
positive charge on C1, C7 is due to the attachment of nitrogen
O5, N2 atoms to it respectively. Also C1 (0.839e), has the highest
positive charge; this is due to the substitution of oxygen (O5 and
O6) atoms respectively. The nitrogen atoms of the nitro group have
the highest and equal positive charges (N13 and N16 = 0.511e)
when compare to the other nitrogen atom N2 (À0.594), the reason
for this highest positive charge is due to the presence of elec-
tronegative oxygen atoms in the nitro group. The NH hydrogen
atom has the highest positive charge (H20 = 0.474e) when com-
pare to other hydrogen atoms, this may be due to the presence
of nitrogen atom of the NH group. An oxygen atoms of the nitro
HOMO-1HOMO-1
ETHANOL WATER GAS
4.8296eV
2.8472eV
4.8288eV
2.8360eV
3.044eV
4.9368eV
HOMO-1
HOMO
LUMO
LUMO+1
HOMO HOMO
LUMO LUMO
LUMO+1 LUMO+1
Fig. 7. The plots of the HOMO and LUMO orbitals computed at the TD-DFT B3LYP/6-31G(d,p) level for title compound (ethanol, water and gas phase).
K. Govindarasu, E. Kavitha / Journal of Molecular Structure 1088 (2015) 70–84 81](https://image.slidesharecdn.com/b17d5b6d-b0bf-4fa4-a445-07ce8421e18a-160601043133/85/1-s2-0-S0022286015000939-main-12-320.jpg)
![groups have less negative charge (O14 = À0.394e, O15 = À0.384e
and O17 = À0.413e, O18 = À0.373e) when compare to other oxy-
gen atoms (O5 = À0.563e, O6 = À0.530e) of title molecule. Reason
for this less negative charges of oxygen atoms in the nitro groups
are presence of positive charges of nitrogen atoms
N13 = N16 = +0.511e. The C8 (0.015e) and C10 (0.019e) carbon
atoms have neutral charges; this may be due to attachments of
N16 and N13 atoms respectively.
Electrostatic potential, total electron density and molecular
electrostatic potential
Fig. 8 shows, the electrostatic potential (ESP), the total electron
density (TED) and Molecular electro static potential (MEP) surfaces
of the title molecule under investigation are constructed by using
B3LYP method. The color scheme of ESP (Fig. 8a) is the negative
electrostatic potentials are shown in red (Oxygen atoms) and yel-
low, slightly electron rich region (Nitrogen atom) the intensity of
which is proportional to the absolute value of the potential energy,
electrostatic while green indicates surface areas where the poten-
tials are close to zero. Green areas cover parts of the molecule
where electrostatic potentials are close to zero (CAC and CAH
bonds). The total electron density of the title molecule computed
at the 0.020000 a.u. isodensity surface. The TED plots for title
molecule show a uniform distribution (Fig. 8b). The color code of
these maps is in the range between À4.062 eÀ2
(deepest red) and
+4.062 eÀ2
(deepest blue) in compound. The molecular electrostat-
ic potential surface MESP which is a 3D plot of electrostatic poten-
tial mapped onto the iso-electron density surface simultaneously
displays molecular shape, size and electrostatic potential values.
The color scheme for the MEP surface is red-electron rich or par-
tially negative charge; blue-electron deficient or partially positive
charge; light blue-slightly electron deficient region respectively.
From the (Fig. 8c) we can see that the negative potential sites are
on oxygen atoms as well as the positive potential sites are around
the hydrogen atoms. The negative (red color) regions of MEP were
related to electrophilic reactivity and the positive (blue color) ones
to nucleophilic reactivity. The color code of these maps is in the
range between À5.910 (deepest red) and +5.910 (blue) in the title
compound.
Global reactivity descriptors
The energy gap between HOMO and LUMO is a critical para-
meter to determine molecular electrical transport properties. By
using HOMO and LUMO energy values for a molecule, the global
chemical reactivity descriptors of molecules such as hardness (g),
chemical potential (l), softness (S), electronegativity (v) and elec-
trophilicity index (x) have been defined [62,63]. On the basis of
EHOMO and ELUMO, these are calculated using the below equations.
(a) Electrostatic potential map
(b) Electron density map
(c) Molecular electrostatic Potential map (MEP)
Fig. 8. (a) Electrostatic potential (ESP), (b) Electron density (ED), (c) molecular electrostatic Potential map (MEP) of N-(2, 4-dinitrophenyl)-L-alanine methyl ester.
82 K. Govindarasu, E. Kavitha / Journal of Molecular Structure 1088 (2015) 70–84](https://image.slidesharecdn.com/b17d5b6d-b0bf-4fa4-a445-07ce8421e18a-160601043133/85/1-s2-0-S0022286015000939-main-13-320.jpg)
![Using Koopman’s theorem [64] for closed-shell molecules,
The hardness of the molecule is
g ¼ ðI À AÞ=2
The chemical potential of the molecule is
l ¼ ÀðI þ AÞ=2
The softness of the molecule is
S ¼ 1=2g
The electro negativity of the molecule is
v ¼ ðI þ AÞ=2
The electrophilicity index of the molecule is
x ¼ l2
=2g
where I is the ionization potential and A is the electron affinity of
the molecule. I and A can be expressed through HOMO and LUMO
orbital energies as I = ÀEHOMO and A = ÀELUMO. The Ionization poten-
tial I and an electron affinity A of our molecule Dnp-ala-ome calcu-
lated by B3LYP/6-31G(d,p) level of calculation in ethanol/water/gas
environment is 6.5344/6.5227/6.7480 eV and 3.6872/3.6867/
3.7040 eV respectively. The calculated values of the hardness, soft-
ness, chemical potential, electronegativity and electrophilicity
index of our molecule in ethanol, water and gas environment is
shown in Supplementary material S2. Considering the chemical
hardness, large HOMO–LUMO gap represent a hard molecule and
small HOMO–LUMO gap represent a soft molecule. The value of
energy gap between the HOMO and LUMO is 2.8472, 2.8360 and
3.0440 eV in ethanol, water and gas, respectively, which is large.
So we conclude that our molecule is hard molecule, which is evi-
dent from Supplementary Table S2 the chemical hardness is
1.4236 (ethanol), 1.4180 (water), 1.5220 (gas) which is greater than
that of chemical softness.
Thermodynamic properties
The temperature dependence of the thermodynamic properties
heat capacity at constant pressure (Cp), entropy (S) and enthalpy
change (DH0 ? T) for Dnp-ala-ome was also determined by
B3LYP/6-31G(d,p) level of calculation in the temperature range
100–1000 K and listed in Table 6. Fig. 9 depicts that the entropies,
heat capacities, and enthalpy changes were increasing with tem-
perature due to the fact that the molecular vibrational intensities
increase with temperature [65]. These observed relations of the
thermodynamic functions vs. temperatures were fitted by quadrat-
ic formulas, and the corresponding fitting regression factors (R2
)
are 0.990, 0.959 and 0.979 for heat capacity, entropy and enthalpy
changes respectively. The correlation graphics of temperature
dependence of thermodynamic functions for Dnp-ala-ome mole-
cule are shown in Fig. 9. Vibrational zero-point energy of the mole-
cule Dnp-ala-ome is 560.42 kJ/mol.
Conclusion
The vibrational properties of N-(2,4-dinitrophenyl)-L-alanine
methyl ester have been investigated using experimental tech-
niques (FT-IR and FT-Raman) and density functional theory
employing B3LYP/6-31G(d,p) level of calculation. The theoretically
vibrational wavenumbers were compared with the experimental
values, which yield good agreement with the calculated values.
The geometry optimizations have been carried out using DFT-
B3LYP and M06-2X levels of calculations and are compared with
the reported values. From the optimized geometry analysis we
identified that B3LYP level of calculation is closer to experimental
findings when compared to M06-2X level of calculation. NBO ana-
lysis clearly manifests the evidence of the intramolecular
(N2AH20Á Á ÁO17) charge transfer from LP(2)O15/LP(1)O17 with
r⁄
(N2AH20) results in a stabilization energy of 10.58/4.53 kJ/mol
respectively. Overall, the TD-DFT calculations on the molecule pro-
vided deep insight into their electronic structures and properties.
MEP predicts the most reactive part in the molecule. The calculated
first order hyperpolarizability was found to be 14.94 Â 10À30
esu,
which is 40 times greater than reported in literature for urea.
The UV spectrum was measured in ethanol solution and results
are compared with theoretical results. The energies of important
MO’s and the kmax of the compound were also determined from
TD-DFT method. The HOMO and LUMO study for the title molecule
is carried out and find out the energy distribution and energy gap.
Based on the frequencies scaled and the principle of statistic ther-
modynamics, thermodynamic properties ranging from 100 to
1000 K were obtained and it is obvious that, the gradients of C0
p
and S0
m to the temperature decrease, but that of DH0
m increases,
as the temperature increases. The comparison of predicted bands
with experimental was done and shows an acceptable general
agreement. When all theoretical results scanned, they are showing
good correlation with experimental data.
Appendix A. Supplementary material
Supplementary data associated with this article can be found, in
the online version, at http://dx.doi.org/10.1016/j.molstruc.2015.02.
008.
Table 6
Thermodynamic properties at different temperatures at the B3LYP/6-31G (d,p) level
for N-(2,4-dinitrophenyl)-L-alanine methyl ester.
T (K) S0
m (J molÀ1
KÀ1
) C0
p,m (J molÀ1
KÀ1
) DH0
m (kJ molÀ1
)
100.00 375.35 135.07 8.47
200.00 493.15 212.52 25.9
298.15 591.84 286.44 50.41
300.00 593.62 287.81 50.94
400.00 686.17 357.44 83.28
500.00 772.46 416.15 122.05
600.00 852.69 463.65 166.13
700.00 927.14 501.91 214.48
800.00 996.26 533.06 266.28
900.00 1060.57 558.73 320.91
1000.00 1120.58 580.13 377.88
200 400 600 800 1000
0
200
400
600
800
1000
1200
S0
m
(Jmol-1
K-1
),C0
p,m
(Jmol-1
K-1
)and
H0
m
(KJmol-1
)
Temperature (K)
(S0
m
(J mol-1
K-1
)
C0
p,m
(J mol-1
K-1
)
H0
m
(KJ mol-1
)
R2
=0.990
R2
=0.959
R2
=0.979
Fig. 9. Correlation graphs of thermodynamic properties at different temperature for
N-(2,4-dinitrophenyl)-L-alanine methyl ester.
K. Govindarasu, E. Kavitha / Journal of Molecular Structure 1088 (2015) 70–84 83](https://image.slidesharecdn.com/b17d5b6d-b0bf-4fa4-a445-07ce8421e18a-160601043133/85/1-s2-0-S0022286015000939-main-14-320.jpg)
![References
[1] P.N. Prasad, D.J. Williams, Introduction to Nonlinear Optical Effects in
Molecules and Polymers, Wiley, New York, 1991.
[2] S.R. Marder, J.E. Sohn, G.D. Stucky (Eds.), Materials for Non-Linear Optics,
American Chemical Society, Washington, DC, 1991.
[3] B.E.A. Saleh, M.C. Teich, Fundamentals of Photonics, Wiley, New York, 1991.
[4] B.G. Penn, B.H. Cardelino, C.E. Moore, A.W. Shields, D.O. Frazier, Prog. Cryst.
Growth Charact. 22 (1991) 19–51.
[5] K. Kolraush, Raman Spectra, Izdatinlit, Moskwa, 1952.
[6] K. Machida, A. Kagayama, Y. Satto, T. Uno, Spcctrochim. Acta 34A (1978) 909.
[7] I.M. Oliveira, D. Bonatto, J.A.P. Henriques, in: A. Mendez-Vilas (Ed.), Current
Research, Technology and Education Topics in Applied Microbiology and
Microbial Biotechnology, Formatex Research Center, Badajoz, 2010.
[8] K.S. Ju, R.E. Parales, Microbiol. Mol. Biol. Rev. 74 (2) (2010) 250.
[9] Mario Ttilio S. Rosado, Maria Leonor R.S. Duarte, Rui Fausto’, J. Mol. Struct.
410–411 (1997) 343.
[10] Aude Simon, Luke MacAleese, Philippe Maıˆtre, Joe Lemaire, Terrance B.
McMahon, J. Am. Chem. Soc. 129 (2007) 2829.
[11] John D. Ewbank, V. Joseph klimkowski, Khamis Siam, Lothar Schafer, J. Mol.
Struct. 160 (1987) 275.
[12] N. Vijayan, S. Rajasekaran, G. Bhagavannarayana, R. Ramesh Babu, R.
Gopalakrishnan, M. Palanichamy, P. Ramasamy, Cryst. Growth Des. 6 (11)
(2006) 2441.
[13] Heloisa.N. Bordallo, Mariette. Barthes, Juergen. Eckert, Physica B 241–243
(1998) 1138–1140.
[14] L.I. Berezhinsky, G.I. Dovbeshko, M.P. Lisitsa, G.S. Litvinov, Spectrochim. Acta A
54 (1998) 349.
[15] M.K. Marchewk, M. Drozd, J. Janczak, Spectrochim. Acta A 79 (2011) 758.
[16] M.J. Frisch et al., Gaussian 09, Revision A.1, Gaussian Inc., Wallingford CT,
2009.
[17] P. Hohenberg, W. Kohn, Phys. Rev. 136 (1964) B86.
[18] A.D. Becke, J. Chem. Phys. 98 (1993) 5648.
[19] C. Lee, W. Yang, R.G. Parr, Phys. Rev. B 37 (1988) 785.
[20] E. Frisch, H.P. Hratchian, R.D. Dennington II, T.A. Keith, John Millam, B. Nielsen,
A.J. Holder, J. Hiscocks. Gaussian, Inc., GaussView Version 5.0.8, 2009.
[21] M.H. Jamroz, Vibrational Energy Distribution Analysis: VEDA 4 Program,
Warsaw, Poland, 2004.
[22] Y. Morino, K. Kuchitsu, J. Chem. Phys. 20 (1952) 1809.
[23] W.J. Taylor, J. Chem. Phys. 22 (1954) 1780.
[24] T. Miyazawa, T. Shimanouchi, S. Mizushima, J. Chem. Phys. 29 (1958) 611.
[25] G. Zerbi, J. Overend, B. Crawford, J. Chem. Phys. 38 (1963) 122.
[26] G. Keresztury, G. Jalsovszky, J. Mol. Struct. 10 (1971) 304.
[27] P. Pulay, G. Fogarasi, F. Pang, J.E. Boggs, J. Am. Chem. Soc. 101 (1979) 2550.
[28] L. Lapinski, P. Pongor, PED-program, Warsaw, 1994.
[29] E.D. Glendening, C.R. Landis, F. Weinhold, Comput. Mol. Sci. (2011) 1–42 (John
Wiley Sons, Ltd. WIREs).
[30] D.A. Kleinman, Phys. Rev. 126 (1962) 1977.
[31] S. Shen, G.A. Guirgis, J.R. Durig, Struct. Chem. 12 (2001) 33.
[32] D. Michalska, R. Wysoki´nski, Chem. Phys. Lett. 403 (2005) 211.
[33] D. Michalska, RAINT, A computer program for calculation of Raman intensities
from the Gaussian outputs, Wrocław University of Technology, 2002.
[34] Hoong-Kun Fun, Suchada Chantrapromm, Boonlerd Nilwanna, Thawanrat
Kobkeatthawin, Nawong Boonnak, Acta Cryst. E69 (2013) o1203.
[35] Martin Lutz and Arie Schouten, Acta Cryst. (2011). E67, o586. ISSN 1600.
[36] L.E. Sutton, Tables of Interatomic Distances, Chemical Society, London, 1958.
[37] F.H. Allen, O. Kennard, D.G. Watson, L. Brammer, A.G. Orpen, R. Taylor, J. Chem.
Soc., Perkin Trans. 2 (1987) S1.
[38] National Institute of Standards and Technology. Vibrational Frequency Scaling
Factors on the Web. http://srdata.nist.gov/cccbdb/vsf.asp (accessed Sept 24,
2007).
[39] L.J. Bellamy, The Infrared Spectra of Complex Molecules, third ed., Wiley,
NewYork, 1975.
[40] L.I. Berezhinsky, G.I. Dovbeshko, M.P. Lisitsa, G.S. Litvinov, Spcctrochim. Acta A
54 (1998) 349.
[41] A. Fu, D. Du, Z. Zhou, Spectrochim. Acta 59 (2003) 245.
[42] G. Socrates, Infrared Characteristic Group Frequencies, Wiley, New York, 1980.
[43] G. Varsanyi, Vibrational Spectra of Benzene Derivatives, Academic Press, New
York, 1969.
[44] N.P.G. Roeges, A Guide to the Complete Interpretation of Infrared Spectra of
Organic Structures, Wiley, New York, 1994.
[45] D.N. Singh, I.D. Singh, R.A. Yadav, Ind. J. Phys. 76B (3) (2002) 307.
[46] A. Spire, M. Barthes, H. Kallouai, G. DeNunzio, Physics D137 (2000) 392.
[47] N.B. Colthup, L.H. Daly, S.E. Wiberly, Introduction to Infrared and Raman
Spectroscopy, Academic Press, New York, 1975.
[48] R.M. Silverstein, G.C. Bassler, T.C. Morril, Spectrometric Identification of
Organic Compounds, fifth ed., John Wiley and Sons Inc., Singapore, 1991.
[49] R. Shanmugam, D. Sathyanarayana, Spectrochim. Acta 40A (1984) 764.
[50] N. Sundaraganesan, S. Ayyappan, H. Umamaheswari, B.D. Joshua, Spectrochim.
Acta 66A (2007) 17.
[51] N.B. Colthup, L.H. Daly, S.E. Wiberly, Introduction to Infrared and Raman
spectroscopy, third ed., Academic Press, Boston, 1990.
[52] S. George, Infrared and Raman Characteristic Group Frequencies, Tables and
Charts, third ed., Wiley, Chichester, 2001.
[53] O. Exner, S. Kovac, E. Solcaniova, Collect. Czech. Chem. Commun. 37 (1972)
2156.
[54] D.S. Ranga Rao, G. Thyagarajan, Indian J. Pure Appl. Phys. 16 (1978) 941.
[55] D.M. Burland, R.D. Miller, C.A. Walsh, Chem. Rev. 94 (1994) 31.
[56] C. Andraud, T. Brotin, C. Garcia, F. Pelle, P. Goldner, B. Bigot, A. Collet, J. Am.
Chem. Soc. 116 (1994) 2094.
[57] V.M. Geskin, C. Lambert, J.L. Bredas, J. Am. Chem. Soc. 125 (2003) 15651–
15658.
[58] D.A. Kleinman, Phys. Rev. 126 (1977) 1962.
[59] K. Govindarasu, E. Kavitha, Spectrochim. Acta A 122 (2014) 130.
[60] K. Fukui, T. Yonezawa, H. Shingu, J. Chem. Phys. 20 (1952) 722.
[61] K. Fukui, Science 218 (1982) 747.
[62] R. Parr, L. Szentpaly, S. Liu, Am. Chem. Soc. 121 (1999) 1922.
[63] P. Chattraj, B. Maiti, U. Sarkar, J. Phys. Chem. A 107 (2003) 4973.
[64] T.A. Koopmans, Physica 1 (1934) 104.
[65] Z. Ran, D. Baotong, S. Gang, S. Yuxi, Spectrochim. Acta 75A (2010) 1115.
84 K. Govindarasu, E. Kavitha / Journal of Molecular Structure 1088 (2015) 70–84](https://image.slidesharecdn.com/b17d5b6d-b0bf-4fa4-a445-07ce8421e18a-160601043133/85/1-s2-0-S0022286015000939-main-15-320.jpg)


