
Recommended
More Related Content
Similar to #221 COOIT Rabi Crop Estimate for 2012-13
Similar to #221 COOIT Rabi Crop Estimate for 2012-13 (20)
More from Solvent Extractors' Association of India
More from Solvent Extractors' Association of India (20)
Recently uploaded
Recently uploaded (10)
#221 COOIT Rabi Crop Estimate for 2012-13
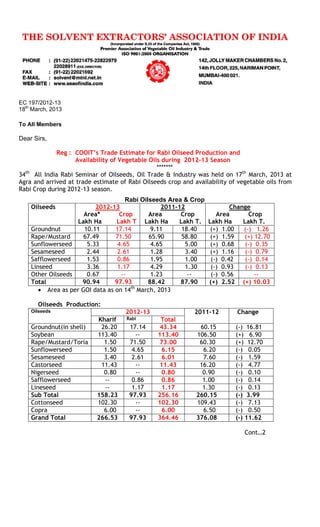
- 1. EC 197/2012-13 18th March, 2013 To All Members Dear Sirs, Reg : COOIT’s Trade Estimate for Rabi Oilseed Production and Availability of Vegetable Oils during 2012-13 Season ******* 34th All India Rabi Seminar of Oilseeds, Oil Trade & Industry was held on 17th March, 2013 at Agra and arrived at trade estimate of Rabi Oilseeds crop and availability of vegetable oils from Rabi Crop during 2012-13 season. Rabi Oilseeds Area & Crop Oilseeds 2012-13 Area* Crop Lakh Ha Lakh T 2011-12 Area Crop Lakh Ha Lakh T. Change Area Crop Lakh Ha Lakh T. Groundnut 10.11 17.14 9.11 18.40 (+) 1.00 (-) 1.26 Rape/Mustard 67.49 71.50 65.90 58.80 (+) 1.59 (+) 12.70 Sunflowerseed 5.33 4.65 4.65 5.00 (+) 0.68 (-) 0.35 Sesameseed 2.44 2.61 1.28 3.40 (+) 1.16 (-) 0.79 Safflowerseed 1.53 0.86 1.95 1.00 (-) 0.42 (-) 0.14 Linseed 3.36 1.17 4.29 1.30 (-) 0.93 (-) 0.13 Other Oilseeds 0.67 -- 1.23 -- (-) 0.56 -- Total 90.94 97.93 88.42 87.90 (+) 2.52 (+) 10.03 • Area as per GOI data as on 14th March, 2013 Oilseeds Production: Oilseeds 2012-13 2011-12 Change Kharif Rabi Total Groundnut(in shell) 26.20 17.14 43.34 60.15 (-) 16.81 Soybean 113.40 -- 113.40 106.50 (+) 6.90 Rape/Mustard/Toria 1.50 71.50 73.00 60.30 (+) 12.70 Sunflowerseed 1.50 4.65 6.15 6.20 (-) 0.05 Sesameseed 3.40 2.61 6.01 7.60 (-) 1.59 Castorseed 11.43 -- 11.43 16.20 (-) 4.77 Nigerseed 0.80 -- 0.80 0.90 (-) 0.10 Safflowerseed -- 0.86 0.86 1.00 (-) 0.14 Lineseed -- 1.17 1.17 1.30 (-) 0.13 Sub Total 158.23 97.93 256.16 260.15 (-) 3.99 Cottonseed 102.30 -- 102.30 109.43 (-) 7.13 Copra 6.00 -- 6.00 6.50 (-) 0.50 Grand Total 266.53 97.93 364.46 376.08 (-) 11.62 Cont…2
- 2. - 2 – General Observations :- 1. The area under Rabi Oilseeds Crop 2012-13 increased to 90.94 lakh hectares from 88.42 lakh hectares last year i.e. up by 2.52 lakh hectares. 2. Revision of Kharif Crop: The following revision has been made in kharif crop 2012-13 estimated earlier at the Kharif Convention held on 5th Nov.2012 at Delhi. Crop Revised Estimate (17.3.2013) Earlier Estimate (5.11.2012) Castorseed 11.43 Lakh Tones 10.70 Lakh Tones Cottonseed 330.00 Lakh Bales 334.00 Lakh Bales 3. Rabi Groundnut Crop has decreased to 17.14 lakh tones from 18.40 lakh tones of last year. 4. Rapeseed-mustard including Toria crop increased to 73.00 lakh tones from 60.30 lakh tones of last year. 5. The overall Rabi Oilseeds Crop 2012-13 increased to 97.93 lakh tones from 87.90 lakh tones last year. 6. Bales of cotton revised downward to 330 lakh bales from 334 lakh bales estimated earlier at the kharif Convention held on 5th Nov.,2012 at Delhi. 7. The overall 9 oilseed crops ( Kharif & Rabi) for the current year (2012-13) is estimated at 256.16 lakh tones compared to 260.15 lakh tones. 8. The total vegetable oil availability from Kharif and Rabi Oilseeds crops for the year 2012- 13(Nov-Oct) is estimated upward at 81.97 lakh tones compared to 81.52 lakh tones last year. 9. The import of vegetable oil during 2012-13 (Nov-Oct) is likely to increase by about 5.00 to 7.00 lakh tons and estimated in the range of 107.00 to 109.00 lakh tons from 101.92 lakh tons in previous year (2011-12). We are forwarding herewith trade estimate arrived at Rabi Seminar, for your kind information. Thanking you, Yours faithfully, (Dr. B.V.MEHTA) Executive Director Encl : COOIT’s Trade Estimate
- 3. 34th ALL INDIA SEMINAR ON RABI OILSEEDS, OIL TRADE AND INDUSTRY ON 17th MARCH, 2013 AT AGRA, U.P. COOIT’S ESTIMATE OF PRODUCTION AND MARKETABLE SURPLUS OF OILSEEDS AND AVAILABILITY OF VEGETABLE OILS DURING OIL YEAR 2012-13 1.GROUNDNUT (IN LAKH TONNES) Sr. No. State Trade Estimate 2012-13 Season 2011-12 Season Kharif Rabi Total Kharif Rabi Total 1. Gujarat 6.90 1.65 8.55 17.75 2.50 20.25 2. Maharashtra 1.40 0.11 1.51 1.80 1.00 2.80 3. Andhra Pradesh 5.00 4.78 9.78 5.50 4.00 9.50 4. Tamil Nadu 2.50 3.34 5.84 3.50 4.60 8.10 5. Karnataka 2.00 4.18 6.18 3.50 3.20 6.70 6. Madhya Pradesh/C.G. 1.90 -- 1.90 1.80 -- 1.80 7. Rajasthan 4.60 -- 4.60 5.50 -- 5.50 8. Punjab/Haryana/U.P. 0.60 -- 0.60 0.80 -- 0.80 9. Orissa 0.90 2.37 3.27 1.00 2.50 3.50 10. Others 0.40 0.71 1.11 0.60 0.60 1.20 Total in Shells 26.20 17.14 43.34 41.75 18.40 60.15 Equivalent in kernels (70%) Less:- Retained for sowing, Export Direct Consumption Sub Total 18.30 5.60 2.50 8.00 -------- 16.10 12.00 1.20 1.40 4.40 ------- 7.00 30.30 6.80 3.90 12.40 ------- 23.10 29.20 6.30 3.60 13.60 -------- 23.50 12.90 1.20 1.40 4.40 ------ 7.00 42.10 7.50 5.00 18.00 ------- 30.50 Marketable surplus (In kernels for crushing) 2.20 5.00 7.20 5.70 5.90 11.60 1.
- 4. 2. SOYBEAN Sr. No. State Trade Estimate 2012-13 Season 2011-12 Season Kharif Rabi Total Kharif Rabi Total 1. Madhya Pradesh 59.00 -- 59.00 55.00 -- 55.00 2. Maharashtra 37.00 -- 37.00 35.00 -- 35.00 3. Andhra Pradesh 2.00 -- 2.00 1.60 -- 1.60 4. Rajasthan 10.50 -- 10.50 10.00 -- 10.00 5. Karnataka 2.00 -- 2.00 2.40 -- 2.40 6. Chhatisgarh 1.60 -- 1.60 1.50 -- 1.50 7. Gujarat 0.90 -- 0.90 1.00 -- 1.00 7. Others 0.40 -- 0.40 -- -- -- Total Retained for sowing & Direct Consumption 113.40 7.50 2.50 10.00 -- -- -- --- 113.40 7.50 2.50 10.00 106.50 12.00 -- -- 106.50 12.00 Marketable surplus for crushing 103.40 -- 103.40 94.50 -- 94.50 3. RAPE/MUSTARD/TORIA Sr. No. State Trade Estimate 2012-13 Season 2011-12 Season Kharif (Toria) Rabi (R&M) Total Kharif (Toria) Rabi (R&M) Total A) 1. RAPE/MUSTARD/TORIA Uttar Pradesh 1.00 10.20 11.20 1.00 9.00 10.00 2. Rajasthan -- 34.35 34.35 -- 27.50 27.50 3. Punjab/Haryana 0.40 7.38 7.78 0.50 6.00 6.50 4. Gujarat -- 3.18 3.18 -- 2.40 2.40 5. M.P./Chhatisgarh -- 8.22 8.22 -- 6.90 6.90 6. West Bengal -- 3.50 3.50 -- 3.00 3.00 7. Bihar -- 1.67 1.67 -- -- -- 8. Eastern India & Others 0.10 3.00 3.10 -- 4.00 4.00 Total 1.50 71.50 73.00 1.50 58.80 60.30 Retained for sowing & Direct Consumption -- 2.00 2.00 -- 2.00 2.00 Marketable surplus for crushing 1.50 69.50 71.00 1.50 56.80 58.30 2.
- 5. 4. SUNFLOWERSEED Sr. No. State Trade Estimate 2012-13 Season 2011-12 Season Kharif Rabi Total Kharif Rabi Total 1. Karnataka 1.20 2.67 3.87 0.90 2.00 2.90 2. Andhra Pradesh 0.10 0.93 1.03 0.10 1.40 1.50 3. Maharashtra 0.20 0.25 0.45 0.20 0.60 0.80 4. Tamilnadu -- -- -- -- -- -- 5. Punjab -- -- -- -- -- -- 6. Haryana -- -- -- -- -- -- 7. Uttar Pradesh -- -- -- -- -- -- 8. Bihar -- -- -- -- -- -- 9. Others -- 0.80 0.80 -- 1.00 1.00 Total Retained for sowing , Direct Consumption & export 1.50 -- 4.65 -- 6.15 -- 1.20 -- 5.00 -- 6.20 -- Marketable surplus for crushing 1.50 4.65 6.15 1.20 5.00 6.20 5. SESAMESEED Sr. No. State Trade Estimate 2012-13 Season 2011-12 Season Kharif Rabi Total Kharif Rabi Total 1. Gujarat 0.10 0.33 0.43 0.40 0.60 1.00 2. Rajasthan 0.80 -- 0.80 1.10 -- 1.10 3. Tamil Nadu 0.10 0.22 0.32 0.10 0.30 0.40 4. Madhya Pradesh/C.G. 0.60 -- 0.60 0.50 -- 0.50 5. Andhra Pradesh 0.05 0.12 0.17 0.10 0.20 0.30 6. Maharashtra 0.05 -- 0.05 0.10 -- 0.10 7. Karnataka 0.10 -- 0.10 0.15 -- 0.15 8. U.P./Uttaranchal 1.00 -- 1.00 1.00 -- 1.00 9. West Bengal -- 1.48 1.48 -- 1.50 1.50 10. Orissa 0.40 0.46 0.86 0.50 0.70 1.20 11. Others 0.20 -- 0.20 0.25 0.10 0.35 Total Retained for sowing,direct Consumption & export 3.40 2.70 2.61 0.50 6.01 3.20 4.20 3.50 3.40 0.50 7.60 4.00 Marketable surplus for crushing 0.70 2.11 2.81 0.70 2.90 3.60 3.
- 6. 6. CASTORSEED Sr. No. State Trade Estimate 2012-13 Season ® 2011-12 Season Kharif Rabi Total Kharif Rabi Total 1. Gujarat 8.06 -- 8.06 12.20 -- 12.20 2. Rajasthan 1.65 -- 1.65 2.10 -- 2.10 3. Andhra Pradesh 1.50 -- 1.50 1.60 -- 1.60 4. Maharashtra & Others 0.22 -- 0.22 0.30 -- 0.30 Total Retained for sowing & export 11.43 -- -- -- 11.43 -- 16.20 -- -- -- 16.20 -- Marketable surplus for crushing 11.43 -- 11.43 16.20 -- 16.20 ® Revised at Global Castor Conference 2013 7. NIGERSEED Sr. No. State Trade Estimate 2012-13 Season 2011-12 Season Kharif Rabi Total Kharif Rabi Total 1. Orissa 0.20 -- 0.20 0.25 -- 0.25 2. M.P. & Chhatisgarh 0.20 -- 0.20 0.20 -- 0.20 3. Others 0.40 -- 0.40 0.45 -- 0.45 Total Retained for sowing, direct Consumption & export 0.80 0.25 -- -- 0.80 0.25 0.90 0.30 -- -- 0.90 0.30 Marketable surplus for crushing 0.55 -- 0.55 0.60 -- 0.60 8. SAFFLOWERSEED(KARDI) Sr. No. State Trade Estimate 2012-13 Season 2011-12 Season Kharif Rabi Total Kharif Rabi Total 1. Maharashtra -- 0.46 0.46 -- 0.60 0.60 2. Karnataka -- 0.25 0.25 -- 0.25 0.25 3. Andhra Pradesh -- 0.07 0.07 -- 0.10 0.10 4. Others -- 0.08 0.08 -- 0.05 0.05 Total Retained for sowing & Direct Consumption -- -- 0.86 0.10 0.86 0.10 -- -- 1.00 0.10 1.00 0.10 Marketable surplus for crushing -- 0.76 0.76 -- 0.90 0.90 4.
- 7. 9. LINSEED Sr. No. State Trade Estimate 2012-13 Season 2011-12 Season Kharif Rabi Total Kharif Rabi Total 1. Madhya Pradesh/C.G. -- 0.37 0.37 -- 0.45 0.45 2. Uttar Pradesh -- 0.08 0.08 -- 0.10 0.10 3. Maharashtra -- 0.09 0.09 -- 0.10 0.10 4. Bihar -- } } -- } } 5. Nagaland -- 0.63} 0.63} -- 0.65} 0.65} 6. Others -- } } -- } } Total Retained for sowing & Direct Consumption -- -- 1.17 -- 1.17 -- -- -- 1.30 -- 1.30 -- Marketable surplus for crushing -- 1.17 1.17 -- 1.30 1.30 TOTAL ESTIMATED PRODUCTION OF NINE MAJOR OILSEEDS 2012-13 Season 2011-12 Season Change Kharif 158.23 ® 172.25 (-) 14.02 Rabi 97.93 87.90 (+) 10.03 Total 256.16 260.15 (-) 3.99 ® Revised COTTONSEED 2012-13 Season® 2011-12 Season Bales of Cotton ( 170 Kg.each) 330.00 Lakh Bales 353.00 Lakh Bales Cottonseed Production @ 310 Kg/Bale 102.30 Lakh Tonnes 109.43 Lakh Tonnes Retained for Sowing & Direct Consumption 5.50 Lakh Tonnes 5.50 Lakh Tonnes Marketable Surplus 96.80 Lakh Tonnes 103.93 Lakh Tonnes Production of Washed Cottonseed Oil ( 11.5% ) 11.13 Lakh Tonnes 11.95 Lakh Tonnes ® - Revised on 17.3.2013 5.
- 8. COPRA ( Milling ) 2012-13 Season 2011-12 Season Estimated Production 6.00 Lakh Tonnes 6.50 Lakh Tonnes Equivalent Coconut Oil (65%) 3.90 Lakh Tonnes 4.23 Lakh Tonnes SOLVENT EXTRACTED OILS S. E. Oils Estimated for Oil Year 2012-13 Estimated for Oil Year 2011-12 Rice Bran Oil Edible 8.70 Non-Edible 0.30 9.00 Edible 8.50 Non-Edible 0.30 8.80 S.E. Rapeseed 1.60 1.50 S.E. Sunflowerseed 0.40 0.50 S.E. Groundnut 0.20 0.30 S.E. Cottonseed & Others Oils 0.60 0.50 Minor Oils (TBOs) 1.00 1.00 Local Palm Oil 0.80 0.70 Total 13.60 13.30 IMPORTED OIL Oils Forecast for Oil Year 2012-13 (Est.) (Nov-Oct) Oil Year 2011-12 (Nov-Oct) Edible Oil 105.00/107.00 99.81 Vanaspati -- --- Non-Edible Oil 2.00 2.11 Total 107.00/109.00 101.92 6.
- 9. COOIT’S ESTIMATE OF DOMESTIC AVAILABILITY OF VEGETABLE OILS DURING 2012-13 (NOV-OCT) & COMPARATIVE FOR 2011-12 (NOV-OCT) (IN LAKH TONNES) Sr. No. Oilseeds/ S.E. Oils Oil Reco- Very % 2012-13 Seasons Total Oil Availa bility 2011-12 Seasons Total Oil Availa bility Production Marketable Surplus Production Marketable Surplus Kharif Rabi Total Kharif Rabi Total Kharif Rabi Total Kharif Rabi Total I. Oilseeds 1. Groundnut (In Shell) 40 26.20 17.14 43.34 2.20 5.00 7.20 2.88 41.75 18.40 60.15 5.70 5.90 11.60 4.64 2. Soya 17 113.40 -- 113.40 103.40 -- 103.40 17.58 106.50 -- 106.50 94.50 -- 94.50 16.07 3. Rape/Mustard/Toria 33 1.50 71.50 73.00 1.50 69.50 71.00 23.43 1.50 58.80 60.30 1.50 56.80 58.30 19.24 4. Sunflower 35 1.50 4.65 6.15 1.50 4.65 6.15 2.15 1.20 5.00 6.20 1.20 5.00 6.20 2.17 5. Sesame 45 3.40 2.61 6.01 0.70 2.11 2.81 1.26 4.20 3.40 7.60 0.70 2.90 3.60 1.62 6. Castor 45 11.43 -- 11.43 11.43 -- 11.43 5.14 16.20 -- 16.20 16.20 -- 16.20 7.29 7. Niger 30 0.80 -- 0.80 0.55 -- 0.55 0.17 0.90 -- 0.90 0.60 -- 0.60 0.18 8. Safflower 30 -- 0.86 0.86 -- 0.76 0.76 0.23 -- 1.00 1.00 -- 0.90 0.90 0.27 9. Linseed 43 -- 1.17 1.17 -- 1.17 1.17 0.50 -- 1.30 1.30 -- 1.30 1.30 0.56 SUB-TOTAL 158.23 97.93 256.16 121.28 83.19 204.47 53.34 172.25 87.90 260.15 120.40 72.80 193.20 52.04 II. Other Oilseeds 10. Cottonseed 11.5 102.30 -- 102.30 96.80 -- 96.80 11.13 109.43 -- 109.43 103.93 -- 103.93 11.95 11. Copra 65 6.00 -- 6.00 6.00 -- 6.00 3.90 6.50 -- 6.50 6.50 -- 6.50 4.23 SUB-TOTAL 108.30 -- 108.30 102.80 -- 102.80 15.03 115.93 -- 115.93 110.43 -- 110.43 16.18 III. Secondary Source 12. Rice Bran 15 -- -- -- -- -- -- 9.00 -- -- -- -- -- -- 8.80 13. Rapseed Cake 9 -- -- -- -- -- -- 1.60 -- -- -- -- -- -- 1.50 14. Sunflowerseed Cake 12 -- -- -- -- -- -- 0.40 -- -- -- -- -- -- 0.50 15. Groundnut Cake 7 -- -- -- -- -- -- 0.20 -- -- -- -- -- -- 0.30 16. Cottonseed & Others 7 -- -- -- -- -- -- 0.60 -- -- -- -- -- -- 0.50 17. Mionr Oilseeds(TBOs) -- -- -- -- -- -- 1.00 -- -- -- -- -- -- 1.00 18. Local Palm Oil -- -- -- -- -- -- 0.80 -- -- -- -- -- -- 0.70 SUB-TOTAL -- -- -- -- -- -- 13.60 -- -- -- -- -- -- 13.30 GRAND TOTAL 266.53 97.93 364.46 224.08 83.19 307.27 81.97 288.18 87.90 376.08 230.83 72.80 303.63 81.52 10 Lakh = 1 Million