Download to read offline

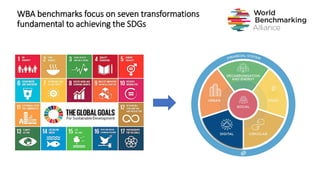

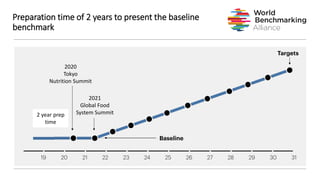
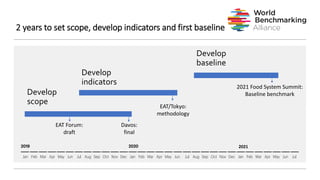
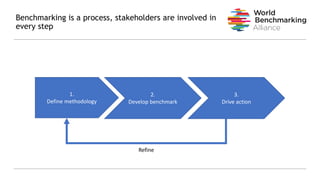
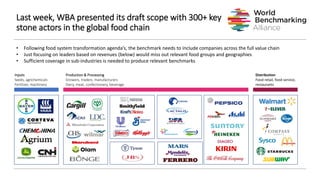
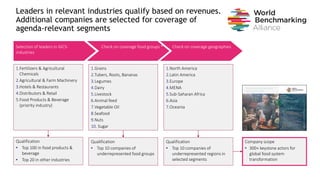
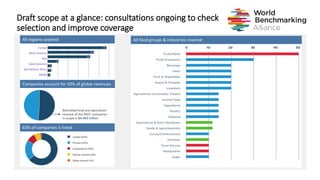
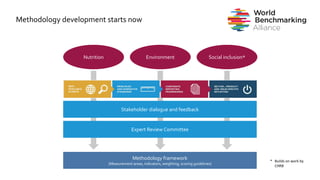
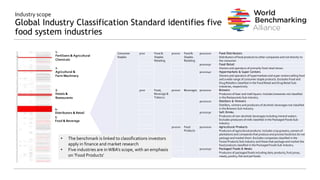
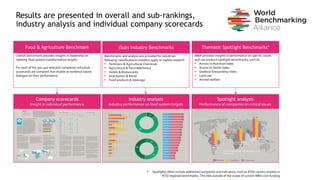

The document discusses the development of the World Benchmarking Alliance's Food and Agriculture Benchmark. It notes that over 2 years were spent defining the benchmark's scope, developing indicators, and creating a first baseline. The benchmark aims to track over 300 global companies across the full food value chain in areas like nutrition, environment, and social inclusion. It will provide overall and industry-level results as well as individual company scorecards to facilitate dialogue on performance meeting food system transformation targets.


