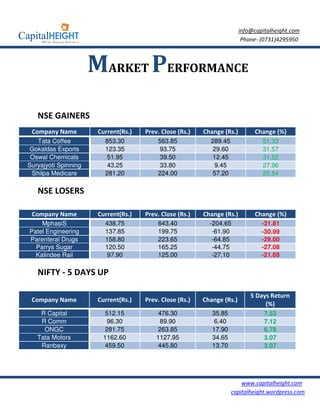
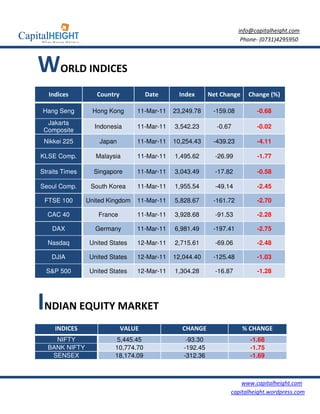
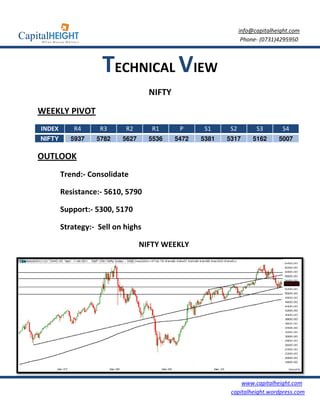
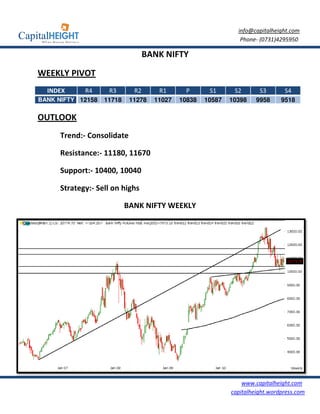
Weekly Newsletter
       Newsletter-Equity
14/03/2011


                      www.Capitalheight.com
                          Capitalheight.com
info@capitalheight.com
                                     Phone- (0731)4295950


Weekly Newsletter
  Contents
       Market Wrap
       Market Performance
           NSE Gainers
           NSE Losers
           NIFTY Five Days Up
           World Indices
           Indian Equity Market
       Technical Analysis
           Nifty Spot
           Bank Nifty Future


                                      www.capitalheight.com
                                  capitalheight.wordpress.com
info@capitalheight.com
                                                                          Phone- (0731)4295950


                        MARKET WRAP
      Indian equity market ends down 1.70%, Nifty slips below 5500, down 93.30 pts.
      India’s Jan IIP data came up at 3.7% vs. 1.6% as against expected at 2.7%.
      Global markets ends down, US markets down 1 - 3% & Euro markets down 2-3%.


Indian equity market ended down on geopolitical tensions and recent earthquake &
tsunami in Japan. Nifty slipped below the crucial level of 5500 and ended down 93.30
pts to end at 5545.45 while Sensex shredded 312.36 points to settle at 18174.09.
Bank nifty too ended down 192.45 pts to settle at 10774.70. Nifty is likely to consolidate
in range of 5300 - 5590. In frontline stocks, SBI, AXIS Bank, TCS, BHEL, & Tata Steel
lost 5 - 6% while in Mid-cap space Tata coffee surged 50% & Oswal chem. Up 36%.


India’s January IIP data came positive; up at 3.7% as against 1.6% (y/y) as against
expected at 2.7%. Capital goods space disappointed with de-growth of (-) 18.6% vs.
57.9% y/y while consumer non-durable goods grew at 6.9% vs. (-) 7%. Electricity sector
was upbeat at 10.5% vs. 5.6%. India’s food price inflation eased down to 9.52% vs.
10.39% while fuel price inflation came down at 9.48% vs. 12.56%. Primary articles
inflation eased to 13.96% vs. 14.85%.


Global   equity markets ended down on rising Mid-east and North SA tensions

and recent natural disaster in struggling Japanese economy. With that, other pacific rim
has been on high alert as well. DJIA ended down 1.0% while NASDAQ plunged 2.50%.
In Euro zone, DAX hit worst; down 2.75% or 197 pts at 6981, CAC down 2.3% or 91 pts
3298 and FTSE was down 2.7% or 162 pts at 5828. In Asian markets, Japanese
Nikkei slipped 4% or 440 pts at 10254, KLSE down 1.85 at 1496 while Chinese
Hangseng was marginally down 160 pts at 23250.

                                                                           www.capitalheight.com
                                                                       capitalheight.wordpress.com
info@capitalheight.com
                                                                          Phone- (0731)4295950


                      MARKET PERFORMANCE
   NSE GAINERS
 Company Name          Current(Rs.)   Prev. Close (Rs.)   Change (Rs.)        Change (%)
   Tata Coffee           853.30           563.85            289.45               51.33
 Gokaldas Exports        123.35            93.75             29.60               31.57
 Oswal Chemicals         51.95             39.50             12.45               31.52
Suryajyoti Spinning       43.25            33.80             9.45                27.96
 Shilpa Medicare         281.20           224.00             57.20               25.54

   NSE LOSERS

 Company Name          Current(Rs.)   Prev. Close (Rs.)   Change (Rs.)        Change (%)
    MphasiS              438.75           643.40            -204.65              -31.81
Patel Engineering        137.85           199.75             -61.90              -30.99
Parenteral Drugs         158.80           223.65             -64.85              -29.00
  Parrys Sugar           120.50           165.25             -44.75              -27.08
  Kalindee Rail          97.90            125.00             -27.10              -21.68

   NIFTY - 5 DAYS UP

                                                                             5 Days Return
 Company Name          Current(Rs.)   Prev. Close (Rs.)   Change (Rs.)
                                                                                  (%)
    R Capital           512.15             476.30            35.85                7.53
    R Comm               96.30              89.90             6.40                7.12
     ONGC               281.75             263.85            17.90                6.78
   Tata Motors          1162.60           1127.95            34.65                3.07
    Ranbaxy             459.50             445.80            13.70                3.07


                                                                         www.capitalheight.com
                                                                     capitalheight.wordpress.com
info@capitalheight.com
                                                                      Phone- (0731)4295950


WORLD INDICES
  Indices          Country           Date     Index       Net Change    Change (%)

Hang Seng         Hong Kong      11-Mar-11   23,249.78     -159.08         -0.68
  Jakarta
                  Indonesia      11-Mar-11   3,542.23       -0.67          -0.02
 Composite
 Nikkei 225         Japan        11-Mar-11   10,254.43     -439.23         -4.11

KLSE Comp.         Malaysia      11-Mar-11   1,495.62       -26.99         -1.77

Straits Times     Singapore      11-Mar-11   3,043.49       -17.82         -0.58

Seoul Comp.      South Korea     11-Mar-11   1,955.54       -49.14         -2.45

 FTSE 100       United Kingdom   11-Mar-11   5,828.67      -161.72         -2.70

  CAC 40            France       11-Mar-11   3,928.68       -91.53         -2.28

    DAX            Germany       11-Mar-11   6,981.49      -197.41         -2.75

  Nasdaq         United States   12-Mar-11   2,715.61       -69.06         -2.48

    DJIA         United States   12-Mar-11   12,044.40     -125.48         -1.03

  S&P 500        United States   12-Mar-11   1,304.28       -16.87         -1.28


INDIAN EQUITY MARKET
     INDICES                 VALUE              CHANGE                 % CHANGE
    NIFTY                5,445.45                -93.30                  -1.68
  BANK NIFTY             10,774.70              -192.45                  -1.75
   SENSEX                18,174.09              -312.36                  -1.69


                                                                     www.capitalheight.com
                                                                 capitalheight.wordpress.com
info@capitalheight.com
                                                                Phone- (0731)4295950


                    TECHNICAL VIEW
                                   NIFTY
WEEKLY PIVOT
INDEX       R4     R3      R2       R1      P      S1     S2         S3       S4
NIFTY      5937   5782    5627     5536    5472   5381   5317       5162     5007

OUTLOOK
        Trend:- Consolidate

        Resistance:- 5610 5790
                        0,

        Support:- 5300, 5
                        5170

        Strategy:- Sell on highs

                                 NIFTY WEEKLY


                                                              www.capitalheight.com
                                                          capitalheight.wordpress.com
info@capitalheight.com
                                                               Phone- (0731)4295950

                                  BANK NIFTY

WEEKLY PIVOT
  INDEX     R4      R3       R2      R1      P       S1      S2       S3       S4
BANK NIFTY 12158   11718    11278   11027   10838   10587   10398    9958     9518

OUTLOOK
     Trend:- Consolidate

     Resistance:- 11180 11670
                   1180,

     Support:- 10400, 10040
                    ,

     Strategy:- Sell on highs

                           BANK NIFTY WEEKLY


                                                                www.capitalheight.com
                                                            capitalheight.wordpress.com
info@capitalheight.com
                                                                                                          Phone- (0731)4295950


Disclaimer
 The information and views in this report, our website & all the service we provide are believed to be reliable, but we do not
accept any responsibility (or liability) for errors of fact or opinion. Users have the right to choose the product/s that suits
them the most.

Sincere efforts have been made to present the right investment perspective. The information contained herein is based on
analysis and up on sources that we consider reliable.

This material is for personal information and based upon it & takes no responsibility

The information given herein should be treated as only factor, while making investment decision. The report does not
provide individually tailor-made investment advice. Capitalheight recommends that investors independently evaluate
particular investments and strategies, and encourages investors to seek the advice of a financial adviser. Capitalheight shall
not be responsible for any transaction conducted based on the information given in this report, which is in violation of rules
and regulations of NSE and BSE.

The share price projections shown are not necessarily indicative of future price performance. The information herein,
together with all estimates and forecasts, can change without notice. Analyst or any person related to Capitalheight might be
holding positions in the stocks recommended. It is understood that anyone who is browsing through the site has done so at
his free will and does not read any views expressed as a recommendation for which either the site or its owners or
anyone can be held responsible for . Any surfing and reading of the information is the acceptance of this disclaimer.

All Rights Reserved.

Investment in Commodity and equity market has its own risks.

We, however, do not vouch for the accuracy or the completeness thereof. we are not responsible for any loss incurred
whatsoever for any financial profits or loss which may arise from the recommendations above. Capitalheight does not
purport to be an invitation or an offer to buy or sell any financial instrument. Our Clients (Paid Or Unpaid), Any third party or
anyone else have no rights to forward or share our calls or SMS or Report or Any Information Provided by us to/with anyone
which is received directly or indirectly by them. If found so then Serious Legal Actions can be taken.


                                                                                                         www.capitalheight.com
                                                                                                     capitalheight.wordpress.com

14 03-2011 weekly equity letter

  • 1.
    Weekly Newsletter Newsletter-Equity 14/03/2011 www.Capitalheight.com Capitalheight.com
  • 2.
    info@capitalheight.com Phone- (0731)4295950 Weekly Newsletter Contents Market Wrap Market Performance NSE Gainers NSE Losers NIFTY Five Days Up World Indices Indian Equity Market Technical Analysis Nifty Spot Bank Nifty Future www.capitalheight.com capitalheight.wordpress.com
  • 3.
    info@capitalheight.com Phone- (0731)4295950 MARKET WRAP Indian equity market ends down 1.70%, Nifty slips below 5500, down 93.30 pts. India’s Jan IIP data came up at 3.7% vs. 1.6% as against expected at 2.7%. Global markets ends down, US markets down 1 - 3% & Euro markets down 2-3%. Indian equity market ended down on geopolitical tensions and recent earthquake & tsunami in Japan. Nifty slipped below the crucial level of 5500 and ended down 93.30 pts to end at 5545.45 while Sensex shredded 312.36 points to settle at 18174.09. Bank nifty too ended down 192.45 pts to settle at 10774.70. Nifty is likely to consolidate in range of 5300 - 5590. In frontline stocks, SBI, AXIS Bank, TCS, BHEL, & Tata Steel lost 5 - 6% while in Mid-cap space Tata coffee surged 50% & Oswal chem. Up 36%. India’s January IIP data came positive; up at 3.7% as against 1.6% (y/y) as against expected at 2.7%. Capital goods space disappointed with de-growth of (-) 18.6% vs. 57.9% y/y while consumer non-durable goods grew at 6.9% vs. (-) 7%. Electricity sector was upbeat at 10.5% vs. 5.6%. India’s food price inflation eased down to 9.52% vs. 10.39% while fuel price inflation came down at 9.48% vs. 12.56%. Primary articles inflation eased to 13.96% vs. 14.85%. Global equity markets ended down on rising Mid-east and North SA tensions and recent natural disaster in struggling Japanese economy. With that, other pacific rim has been on high alert as well. DJIA ended down 1.0% while NASDAQ plunged 2.50%. In Euro zone, DAX hit worst; down 2.75% or 197 pts at 6981, CAC down 2.3% or 91 pts 3298 and FTSE was down 2.7% or 162 pts at 5828. In Asian markets, Japanese Nikkei slipped 4% or 440 pts at 10254, KLSE down 1.85 at 1496 while Chinese Hangseng was marginally down 160 pts at 23250. www.capitalheight.com capitalheight.wordpress.com
  • 4.
    info@capitalheight.com Phone- (0731)4295950 MARKET PERFORMANCE NSE GAINERS Company Name Current(Rs.) Prev. Close (Rs.) Change (Rs.) Change (%) Tata Coffee 853.30 563.85 289.45 51.33 Gokaldas Exports 123.35 93.75 29.60 31.57 Oswal Chemicals 51.95 39.50 12.45 31.52 Suryajyoti Spinning 43.25 33.80 9.45 27.96 Shilpa Medicare 281.20 224.00 57.20 25.54 NSE LOSERS Company Name Current(Rs.) Prev. Close (Rs.) Change (Rs.) Change (%) MphasiS 438.75 643.40 -204.65 -31.81 Patel Engineering 137.85 199.75 -61.90 -30.99 Parenteral Drugs 158.80 223.65 -64.85 -29.00 Parrys Sugar 120.50 165.25 -44.75 -27.08 Kalindee Rail 97.90 125.00 -27.10 -21.68 NIFTY - 5 DAYS UP 5 Days Return Company Name Current(Rs.) Prev. Close (Rs.) Change (Rs.) (%) R Capital 512.15 476.30 35.85 7.53 R Comm 96.30 89.90 6.40 7.12 ONGC 281.75 263.85 17.90 6.78 Tata Motors 1162.60 1127.95 34.65 3.07 Ranbaxy 459.50 445.80 13.70 3.07 www.capitalheight.com capitalheight.wordpress.com
  • 5.
    info@capitalheight.com Phone- (0731)4295950 WORLD INDICES Indices Country Date Index Net Change Change (%) Hang Seng Hong Kong 11-Mar-11 23,249.78 -159.08 -0.68 Jakarta Indonesia 11-Mar-11 3,542.23 -0.67 -0.02 Composite Nikkei 225 Japan 11-Mar-11 10,254.43 -439.23 -4.11 KLSE Comp. Malaysia 11-Mar-11 1,495.62 -26.99 -1.77 Straits Times Singapore 11-Mar-11 3,043.49 -17.82 -0.58 Seoul Comp. South Korea 11-Mar-11 1,955.54 -49.14 -2.45 FTSE 100 United Kingdom 11-Mar-11 5,828.67 -161.72 -2.70 CAC 40 France 11-Mar-11 3,928.68 -91.53 -2.28 DAX Germany 11-Mar-11 6,981.49 -197.41 -2.75 Nasdaq United States 12-Mar-11 2,715.61 -69.06 -2.48 DJIA United States 12-Mar-11 12,044.40 -125.48 -1.03 S&P 500 United States 12-Mar-11 1,304.28 -16.87 -1.28 INDIAN EQUITY MARKET INDICES VALUE CHANGE % CHANGE NIFTY 5,445.45 -93.30 -1.68 BANK NIFTY 10,774.70 -192.45 -1.75 SENSEX 18,174.09 -312.36 -1.69 www.capitalheight.com capitalheight.wordpress.com
  • 6.
    info@capitalheight.com Phone- (0731)4295950 TECHNICAL VIEW NIFTY WEEKLY PIVOT INDEX R4 R3 R2 R1 P S1 S2 S3 S4 NIFTY 5937 5782 5627 5536 5472 5381 5317 5162 5007 OUTLOOK Trend:- Consolidate Resistance:- 5610 5790 0, Support:- 5300, 5 5170 Strategy:- Sell on highs NIFTY WEEKLY www.capitalheight.com capitalheight.wordpress.com
  • 7.
    info@capitalheight.com Phone- (0731)4295950 BANK NIFTY WEEKLY PIVOT INDEX R4 R3 R2 R1 P S1 S2 S3 S4 BANK NIFTY 12158 11718 11278 11027 10838 10587 10398 9958 9518 OUTLOOK Trend:- Consolidate Resistance:- 11180 11670 1180, Support:- 10400, 10040 , Strategy:- Sell on highs BANK NIFTY WEEKLY www.capitalheight.com capitalheight.wordpress.com
  • 8.
    info@capitalheight.com Phone- (0731)4295950 Disclaimer The information and views in this report, our website & all the service we provide are believed to be reliable, but we do not accept any responsibility (or liability) for errors of fact or opinion. Users have the right to choose the product/s that suits them the most. Sincere efforts have been made to present the right investment perspective. The information contained herein is based on analysis and up on sources that we consider reliable. This material is for personal information and based upon it & takes no responsibility The information given herein should be treated as only factor, while making investment decision. The report does not provide individually tailor-made investment advice. Capitalheight recommends that investors independently evaluate particular investments and strategies, and encourages investors to seek the advice of a financial adviser. Capitalheight shall not be responsible for any transaction conducted based on the information given in this report, which is in violation of rules and regulations of NSE and BSE. The share price projections shown are not necessarily indicative of future price performance. The information herein, together with all estimates and forecasts, can change without notice. Analyst or any person related to Capitalheight might be holding positions in the stocks recommended. It is understood that anyone who is browsing through the site has done so at his free will and does not read any views expressed as a recommendation for which either the site or its owners or anyone can be held responsible for . Any surfing and reading of the information is the acceptance of this disclaimer. All Rights Reserved. Investment in Commodity and equity market has its own risks. We, however, do not vouch for the accuracy or the completeness thereof. we are not responsible for any loss incurred whatsoever for any financial profits or loss which may arise from the recommendations above. Capitalheight does not purport to be an invitation or an offer to buy or sell any financial instrument. Our Clients (Paid Or Unpaid), Any third party or anyone else have no rights to forward or share our calls or SMS or Report or Any Information Provided by us to/with anyone which is received directly or indirectly by them. If found so then Serious Legal Actions can be taken. www.capitalheight.com capitalheight.wordpress.com