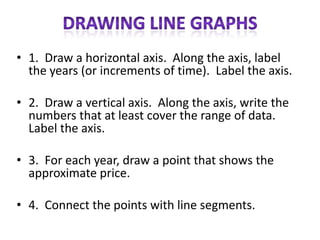
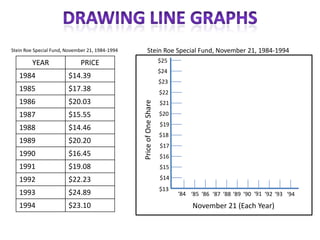
•   1.   Review: Line Graphs/Discuss HW
•   2.   Drawing Line Graphs
•   3.   Practice Drawing Line Graphs (Exercise 5)
•   4.   Review “Quiz” Bar and Line Graphs
• 1. Draw a horizontal axis. Along the axis, label
  the years (or increments of time). Label the axis.

• 2. Draw a vertical axis. Along the axis, write the
  numbers that at least cover the range of data.
  Label the axis.

• 3. For each year, draw a point that shows the
  approximate price.

• 4. Connect the points with line segments.
Stein Roe Special Fund, November 21, 1984-1994         Stein Roe Special Fund, November 21, 1984-1994
         YEAR                PRICE                                    $25
                                                                      $24
   1984                 $14.39
                                                                      $23
   1985                 $17.38                                        $22
   1986                 $20.03


                                                 Price of One Share
                                                                      $21
   1987                 $15.55                                        $20
                                                                      $19
   1988                 $14.46
                                                                      $18
   1989                 $20.20
                                                                      $17
   1990                 $16.45                                        $16
   1991                 $19.08                                        $15

   1992                 $22.23                                        $14
                                                                      $13
   1993                 $24.89                                              ‘84 ‘85 ‘86 ‘87 ‘88 ‘89 ‘90 ‘91 ‘92 ‘93 ‘94
   1994                 $23.10                                                   November 21 (Each Year)

11:00 ABE Math Week 2 Tuesday

  • 1.
    1. Review: Line Graphs/Discuss HW • 2. Drawing Line Graphs • 3. Practice Drawing Line Graphs (Exercise 5) • 4. Review “Quiz” Bar and Line Graphs
  • 2.
    • 1. Drawa horizontal axis. Along the axis, label the years (or increments of time). Label the axis. • 2. Draw a vertical axis. Along the axis, write the numbers that at least cover the range of data. Label the axis. • 3. For each year, draw a point that shows the approximate price. • 4. Connect the points with line segments.
  • 3.
    Stein Roe SpecialFund, November 21, 1984-1994 Stein Roe Special Fund, November 21, 1984-1994 YEAR PRICE $25 $24 1984 $14.39 $23 1985 $17.38 $22 1986 $20.03 Price of One Share $21 1987 $15.55 $20 $19 1988 $14.46 $18 1989 $20.20 $17 1990 $16.45 $16 1991 $19.08 $15 1992 $22.23 $14 $13 1993 $24.89 ‘84 ‘85 ‘86 ‘87 ‘88 ‘89 ‘90 ‘91 ‘92 ‘93 ‘94 1994 $23.10 November 21 (Each Year)