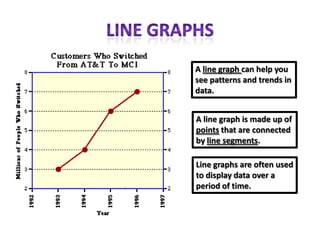
• 1. Discuss HW- Drawing Bar Graphs/Extra
  Practice (Exercise 2)
• 2. Line Graphs- Explanation and Examples
• 3. Line Graph Practice

• HW- Drawing Line Graphs
• 1. Draw and label the     Have you ever been sky diving?
  horizontal and vertical
  axes.

• 2. Draw and shade
  bars to display the
  data.

• 3. Give the graph a
  title.
A line graph can help you
see patterns and trends in
data.


A line graph is made up of
points that are connected
by line segments.

Line graphs are often used
to display data over a
period of time.
• 1. Find the given information
  on the horizontal axis.

• 2. Directly above, find the
  point on the line graph.

• 3. Trace a line across to the
  vertical axis.

• 4. Read the number.

• Or do the opposite. Start with
  the vertical, trace to the line
  graph, and read the number
  from the horizontal axis.
$10,000 Invested at 8% Annual Interest
                 $120,000

                 $100,000
Value of Money


                  $80,000

                  $60,000

                  $40,000

                  $20,000

                      $0
                            0         5       10       15       20       25   30

                                              Number of Years
• Exercise 4- Answer questions 1-13 based on
  the line graph on page 158.
Stein Roe Special Fund, November 21, 1984-1994   Stein Roe Special Fund, November 21, 1984-1994
         YEAR                PRICE
   1984                 $14.39
   1985                 $17.38
   1986                 $20.03
   1987                 $15.55
   1988                 $14.46
   1989                 $20.20
   1990                 $16.45
   1991                 $19.08
   1992                 $22.23
   1993                 $24.89
   1994                 $23.10

11:00 ABE Math Week 2 Monday

  • 1.
    • 1. DiscussHW- Drawing Bar Graphs/Extra Practice (Exercise 2) • 2. Line Graphs- Explanation and Examples • 3. Line Graph Practice • HW- Drawing Line Graphs
  • 2.
    • 1. Drawand label the Have you ever been sky diving? horizontal and vertical axes. • 2. Draw and shade bars to display the data. • 3. Give the graph a title.
  • 3.
    A line graphcan help you see patterns and trends in data. A line graph is made up of points that are connected by line segments. Line graphs are often used to display data over a period of time.
  • 4.
    • 1. Findthe given information on the horizontal axis. • 2. Directly above, find the point on the line graph. • 3. Trace a line across to the vertical axis. • 4. Read the number. • Or do the opposite. Start with the vertical, trace to the line graph, and read the number from the horizontal axis.
  • 5.
    $10,000 Invested at8% Annual Interest $120,000 $100,000 Value of Money $80,000 $60,000 $40,000 $20,000 $0 0 5 10 15 20 25 30 Number of Years
  • 6.
    • Exercise 4-Answer questions 1-13 based on the line graph on page 158.
  • 7.
    Stein Roe SpecialFund, November 21, 1984-1994 Stein Roe Special Fund, November 21, 1984-1994 YEAR PRICE 1984 $14.39 1985 $17.38 1986 $20.03 1987 $15.55 1988 $14.46 1989 $20.20 1990 $16.45 1991 $19.08 1992 $22.23 1993 $24.89 1994 $23.10