Download to read offline
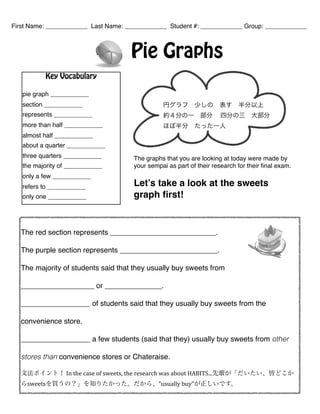


The document discusses several pie graphs created by students as part of a research project. It provides vocabulary to describe parts of pie graphs, such as sections and what they represent. For a sweets pie graph, the majority of students usually buy sweets from convenience stores or bakeries. About a quarter buy from convenience stores, and only a few buy from other stores. A car maker pie graph shows the red section represents Toyota and the purple and yellow sections represent Toyota and Honda. The majority of students like Toyota, and only one student likes Nissan. Three quarters of students like Toyota or Honda.


![Evaluation presentacion[1]](https://cdn.slidesharecdn.com/ss_thumbnails/evaluationpresentacion1-120706150411-phpapp01-thumbnail.jpg?width=640&height=640&fit=bounds)