Download to read offline
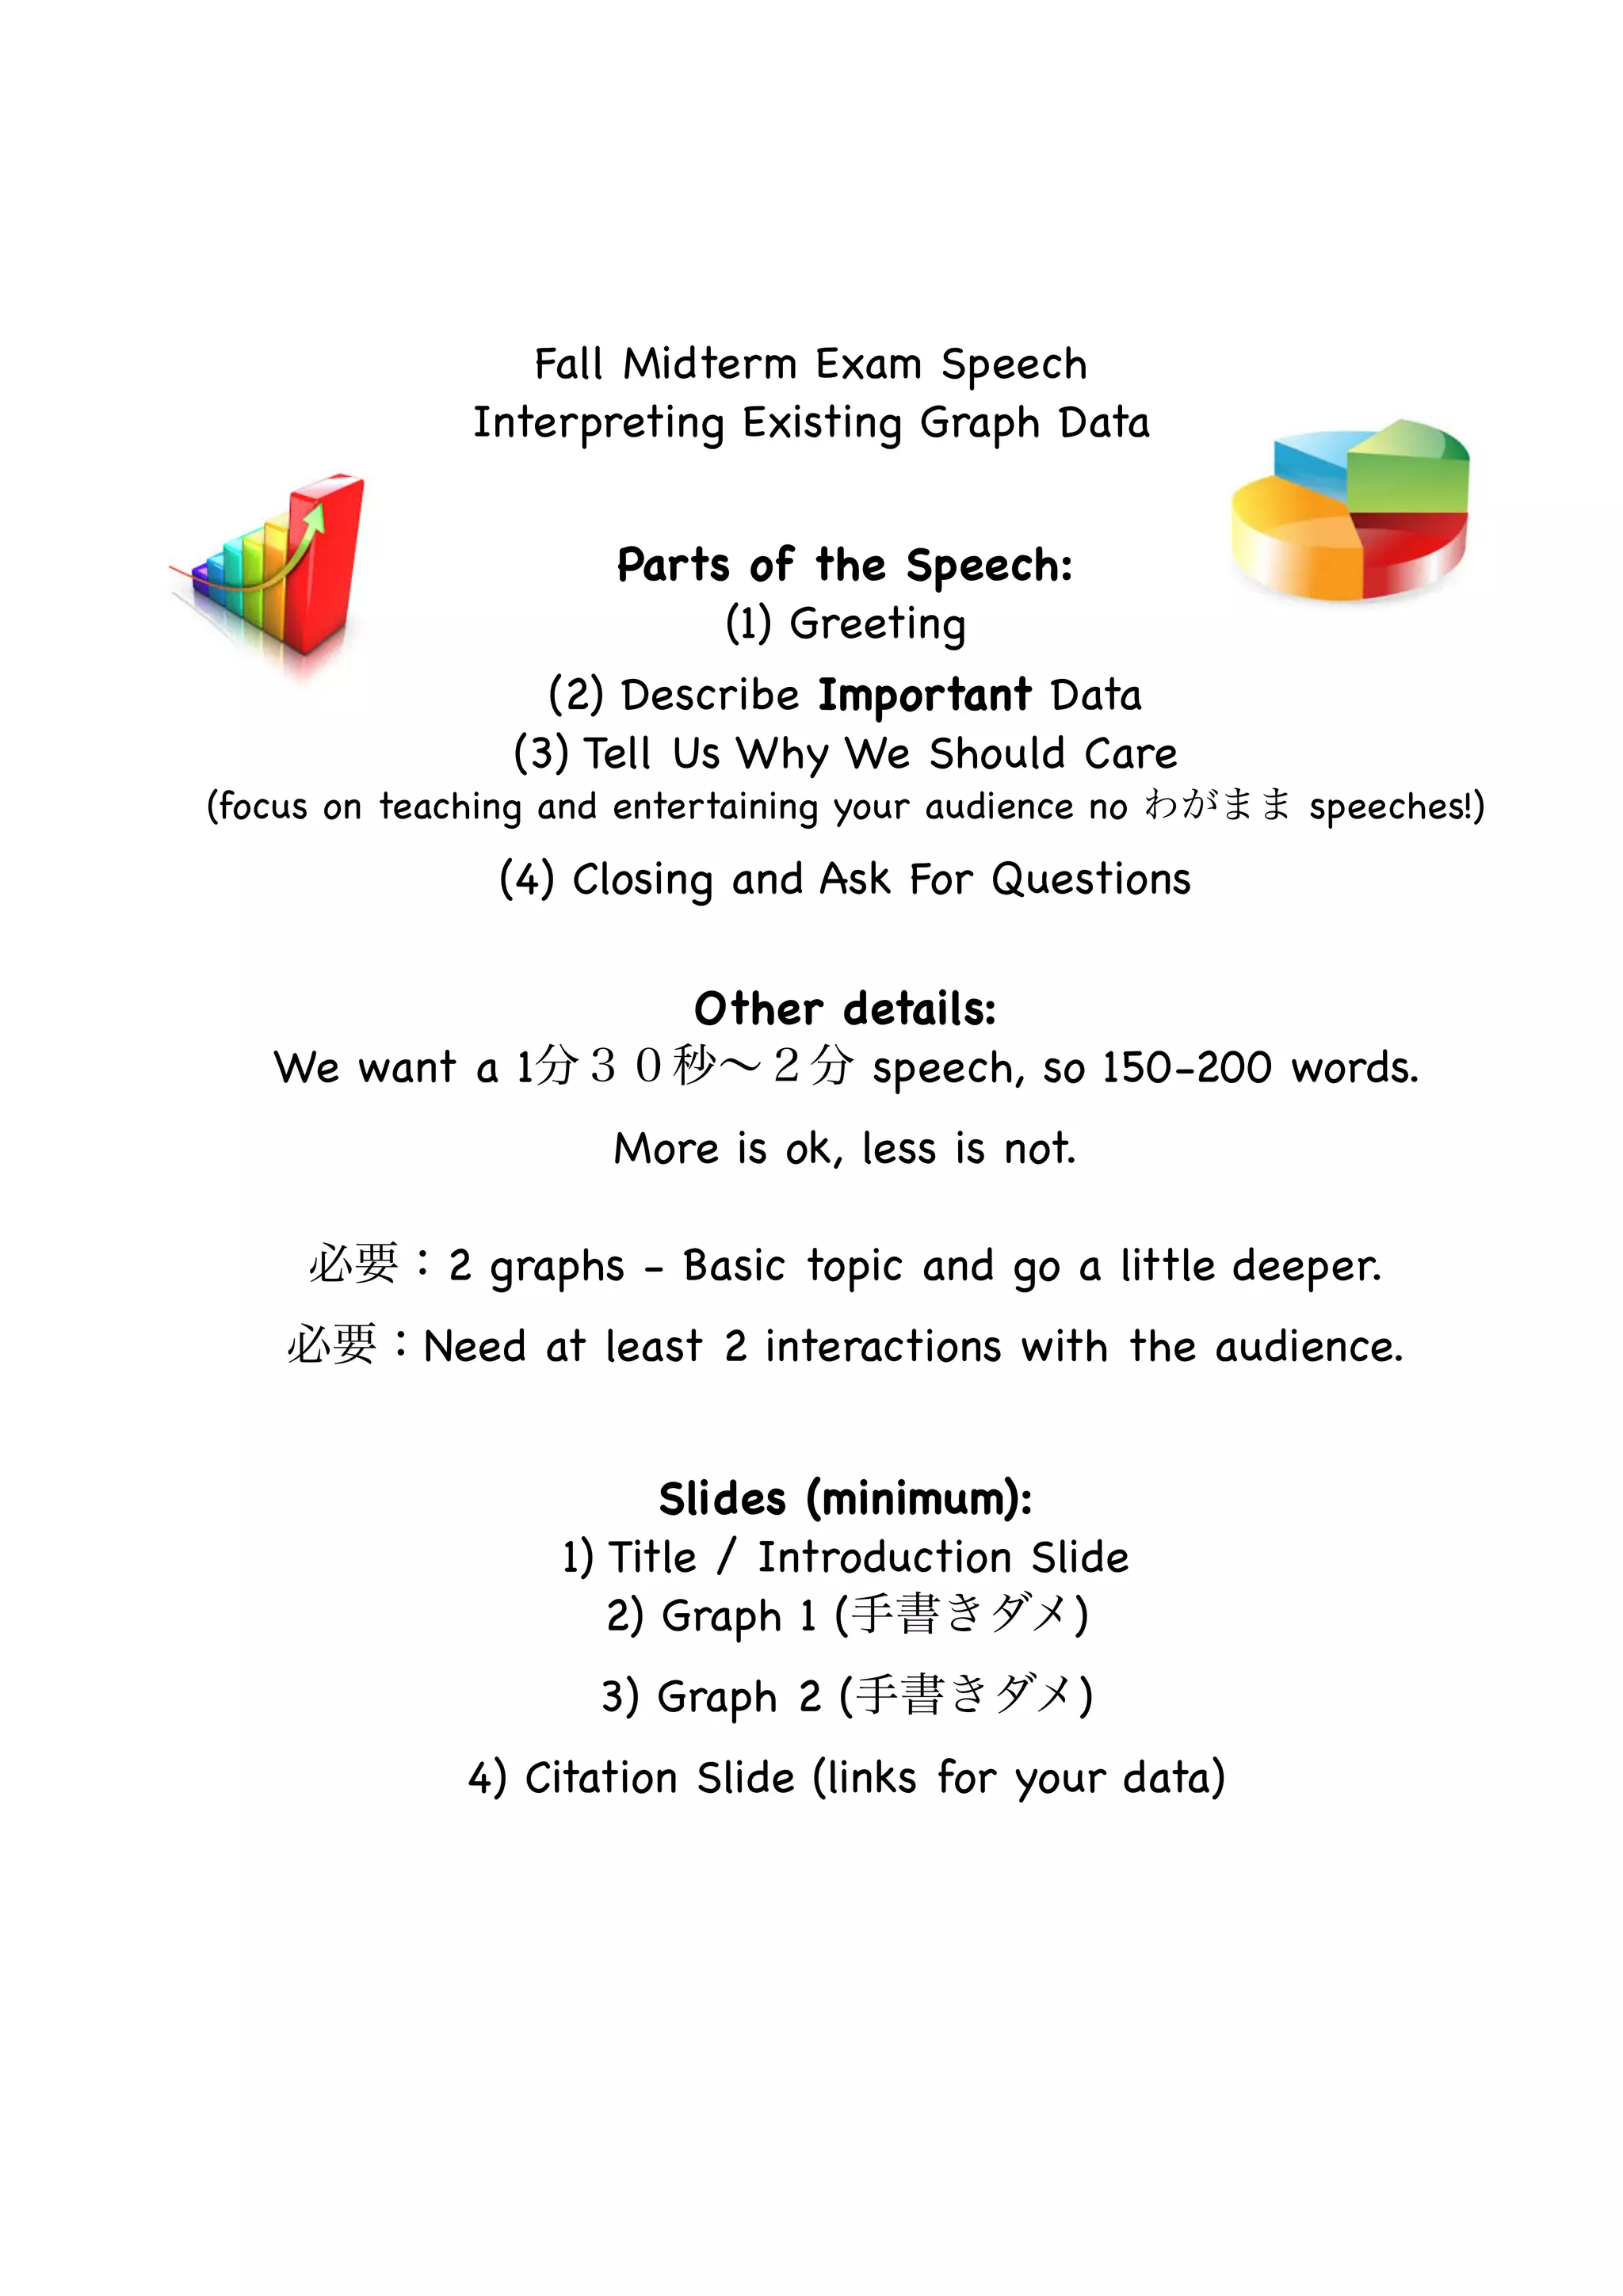

This document provides guidelines for a fall midterm exam speech interpreting existing graph data. The speech should include a greeting, description of important data from two graphs, an explanation of why the data is significant, and a closing that asks for questions. The speech must be between 150-200 words or 1-2 minutes long, include at least two interactions with the audience, and have slides for the title, two graphs created digitally rather than handwritten, and citations.