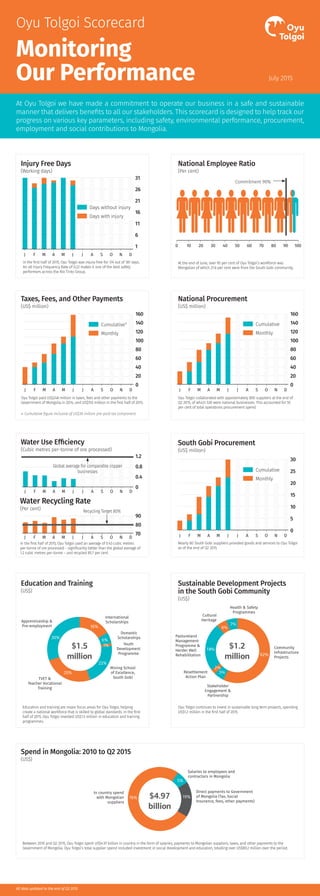
1. Spend in Mongolia: 2010 to Q2 2015
(US$)
At Oyu Tolgoi we have made a commitment to operate our business in a safe and sustainable
manner that delivers benefits to all our stakeholders. This scorecard is designed to help track our
progress on various key parameters, including safety, environmental performance, procurement,
employment and social contributions to Mongolia.
Oyu Tolgoi Scorecard
July 2015
Monitoring
Our Performance
National Procurement
(US$ million)
Education and training are major focus areas for Oyu Tolgoi, helping
create a national workforce that is skilled to global standards. In the first
half of 2015, Oyu Tolgoi invested US$1.5 million in education and training
programmes.
Education and Training
(US$)
Sustainable Development Projects
in the South Gobi Community
(US$)
Oyu Tolgoi continues to invest in sustainable long term projects, spending
US$1.2 million in the first half of 2015.
Resettlement
Action Plan
Stakeholder
Engagement &
Partnership
Cultural
Heritage
Health & Safety
Programmes
Pastureland
Management
Programme &
Herder Well
Rehabilitation
Community
Infrastructure
Projects
6%
7%
5%
2%
18%
62%
$1.2
million
$4.97
billion
Taxes, Fees, and Other Payments
(US$ million)
Oyu Tolgoi paid US$248 million in taxes, fees and other payments to the
Government of Mongolia in 2014, and US$155 million in the first half of 2015.
* Cumulative figure inclusive of US$30 million pre-paid tax component.
40
20
60
80
120
100
140
160
0
South Gobi Procurement
(US$ million)
J F M A M J J A S O N D
Water Use Efficiency
(Cubic metres per-tonne of ore processed)
Water Recycling Rate
(Per cent)
0
1.2
0.8
0.4
J F M A M J J A S O N D
In the first half of 2015, Oyu Tolgoi used an average of 0.43 cubic metres
per-tonne of ore processed – significantly better than the global average of
1.2 cubic metres per-tonne – and recycled 85.7 per cent.
70
80
90
J F M A M J J A S O N D
Recycling Target 80%
National Employee Ratio
(Per cent)
At the end of June, over 95 per cent of Oyu Tolgoi’s workforce was
Mongolian of which 21.6 per cent were from the South Gobi community.
100 20 30 40 50 60 70 80 90 100
Commitment 90%
Injury Free Days
(Working days)
In the first half of 2015, Oyu Tolgoi was injury-free for 174 out of 181 days.
An all Injury Frequency Rate of 0.22 makes it one of the best safety
performers across the Rio Tinto Group.
J F M A M J J A S O N D
6
1
11
16
21
26
31
Days with injury
Days without injury
76%
5%
19%
In country spend
with Mongolian
suppliers
Salaries to employees and
contractors in Mongolia
Direct payments to Government
of Mongolia (Tax, Social
Insurance, fees, other payments)
All data updated to the end of Q2 2015.
Between 2010 and Q2 2015, Oyu Tolgoi spent US$4.97 billion in country in the form of salaries, payments to Mongolian suppliers, taxes, and other payments to the
Government of Mongolia. Oyu Tolgoi’s total supplier spend included investment in social development and education, totalling over US$89.2 million over the period.
Monthly
Cumulative*
Oyu Tolgoi collaborated with approximately 800 suppliers at the end of
Q2 2015, of which 530 were national businesses. This accounted for 55
per cent of total operations procurement spend.
0
J F M A M J J A S O N D
20
40
60
80
100
120
140
160
Monthly
Cumulative
Nearly 80 South Gobi suppliers provided goods and services to Oyu Tolgoi
as of the end of Q2 2015.
0
J F M A M J J A S O N D
5
10
15
20
25
30
Monthly
Cumulative
Global average for comparable copper
businesses
Domestic
Scholarships
Apprenticeship &
Pre-employment
Mining School
of Excellence,
South GobiTVET &
Teacher Vocational
Training
International
Scholarships
Youth
Development
Programme
$1.5
million
16%
30%
25%
22%
1%
6%