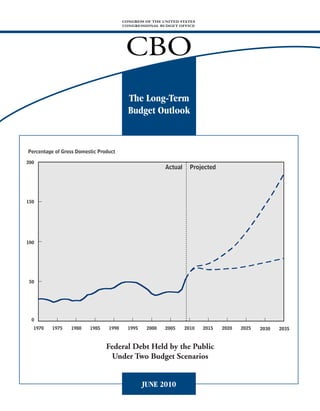
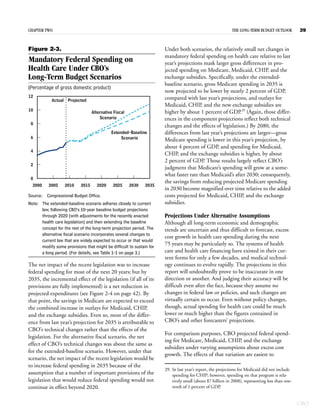
CONGRESS OF THE UNITED STATES
                                        CONGRESSIONAL BUDGET OFFICE


                                         CBO
                                          The Long-Term
                                          Budget Outlook


Percentage of Gross Domestic Product

200
                                                         Actual     Projected


150


100


 50


  0
  1970   1975    1980    1985    1990     1995    2000   2005     2010   2015   2020   2025   2030   2035


                                Federal Debt Held by the Public
                                 Under Two Budget Scenarios


                                                 JUNE 2010
Pub. No. 4130
A


                   CBO R E P O R T


The Long-Term Budget Outlook
                          June 2010


The Congress of the United States O Congressional Budget Office
Notes
      Unless otherwise indicated, the years referred to in this report are federal fiscal years (which
      run from October 1 to September 30).

      Numbers in the text and tables may not add up to totals because of rounding.

      In this report, “recently enacted health care legislation” refers to the Patient Protection and
      Affordable Care Act (Public Law 111-148) and the Health Care and Education Reconciliation
      Act of 2010 (P.L. 111-152).

      The figure on the cover shows federal debt held by the public under the Congressional Budget
      Office’s extended-baseline scenario (lower line) and alternative fiscal scenario (upper line).
      The extended-baseline scenario adheres closely to current law, following CBO’s 10-year base-
      line budget projections through 2020 (with adjustments for the aforementioned health care
      legislation) and then extending the baseline concept for the rest of the long-term projection
      period. The alternative fiscal scenario incorporates several changes to current law that are
      widely expected to occur or that would modify some provisions of law that might be difficult
      to sustain for a long period.

      Supplementary data underlying the long-term budget scenarios are posted along with this
      report on CBO’s Web site (www.cbo.gov).


CBO
Preface


T      his Congressional Budget Office (CBO) report examines the pressures on the federal
budget by presenting the agency’s projections of federal spending and revenues over the com-
ing decades. Under current laws and policies, an aging population and rapidly rising health
care costs will sharply increase federal spending for health care programs and Social Security.
Unless revenues increase at a similar pace, such spending will cause federal debt to grow to
unsustainable levels. If policymakers are to put the nation on a sustainable budgetary path,
they will need to let revenues increase substantially as a percentage of gross domestic product,
decrease spending significantly from projected levels, or adopt some combination of those two
approaches.

This report was prepared under the supervision of Joyce Manchester, with assistance and help-
ful comments from many others at CBO. Noah Meyerson wrote Chapter 1, with contribu-
tions from Jonathan Huntley, Benjamin Page, and Sam Papenfuss. Philip Ellis, Lyle Nelson,
and Julie Topoleski were the authors of Chapter 2. Noah Meyerson wrote Chapter 3, and
Joshua Shakin wrote Chapter 4. Michael Simpson wrote the appendixes. Charles Pineles-
Mark, Jonathan Schwabish, Michael Simpson, and Julie Topoleski developed the long-term
simulations, and Marika Santoro and Michael Simpson prepared the macroeconomic simula-
tions. David Weiner coordinated the revenue simulations, which were prepared by Paul Burn-
ham, Grant Driessen, Ed Harris, Larry Ozanne, Kurt Seibert, and Joshua Shakin. Sarah Axeen
and David Munroe provided research assistance.

Christine Bogusz, Christian Howlett, and Loretta Lettner edited and proofread the report,
with assistance from Leah Mazade and Sherry Snyder. Maureen Costantino and Jeanine Rees
prepared the report for publication, and Maureen Costantino designed the cover. Monte
Ruffin printed the initial copies, Linda Schimmel handled the print distribution, and Simone
Thomas prepared the electronic version for CBO’s Web site (www.cbo.gov).


                                                         Douglas W. Elmendorf
                                                         Director

June 2010


                                                                                                   CBO
Contents

    Summary                                                                  ix


1
    The Long-Term Outlook for the Federal Budget                              1
    Alternative Scenarios for the Long-Term Budget Outlook                    2
    The Long-Term Outlook for Spending                                        6
    The Long-Term Outlook for Revenues                                       12
    The Size of the Fiscal Imbalance                                         13
    Uncertainty of Long-Term Budget Projections                              16
    The Economic Impact of Rising Federal Debt                               17
    Changes in CBO’s Long-Term Projections Since June 2009                   22


2
    The Long-Term Outlook for Mandatory Spending on Health Care              25
    Overview of Current Financing for Health Care                            27
    The Historical Growth of Health Care Spending                            29
    CBO’s Projection Methodology                                             31
    Recent Health Care Legislation                                           33
    Long-Term Projections of Mandatory Federal Spending                      36
    Slowing the Growth of Health Care Costs                                  44


3
    The Long-Term Outlook for Social Security                                45
    How Social Security Works                                                45
    The Outlook for Social Security Spending and Revenues                    46
    Changes in CBO’s Long-Term Social Security Projections Since June 2009   50
    Slowing the Growth of Social Security Spending                           50


4
    The Long-Term Outlook for Revenues                                       51
    Revenues Over the Past 40 Years                                          53
    Revenue Projections Under CBO’s Long-Term Budget Scenarios               54
    Changes in CBO’s Long-Term Revenue Projections Since June 2009           59
    Implications of the Long-Term Revenue Scenarios                          60


                                                                                  CBO
VI   THE LONG-TERM BUDGET OUTLOOK


             A
                                Long-Term Projections Through 2080                             65


             B
                                Demographic and Economic Variables Underlying CBO’s Analysis   73


CBO
CONTENTS                                                                                  THE LONG-TERM BUDGET OUTLOOK   VII


      Tables
           1 1.   Assumptions About Spending and Revenues Underlying CBO’s
                      Long Term Budget Scenarios                                                           3

           1 2.   Projected Spending and Revenues Under CBO’s Long Term Budget Scenarios                   7

           1 3.   The Federal Fiscal Gap Under CBO’s Long Term Budget Scenarios                           15

           2 1.   Excess Cost Growth in Spending for Health Care                                          31

           2 2.   Financial Measures for Medicare’s Hospital Insurance Trust Fund Under
                      CBO’s Extended Baseline Scenario                                                    44

           3 1.   Financial Measures for Social Security Under CBO’s Long Term Budget Scenarios           49

           4 1.   Assumptions About Revenues Underlying CBO’s Long Term Budget Scenarios                  54

           4 2.   Sources of Growth in Total Revenues as a Share of GDP Between
                     2010 and 2035 Under CBO’s Extended Baseline Scenario                                 55

           4 3.   Estimates of Effective Marginal Tax Rates Under CBO’s Extended Baseline Scenario        61

           4 4.   Individual Income and Payroll Taxes as a Share of Income Under
                      CBO’s Extended Baseline Scenario                                                    63


      Figures
           1 1.   Revenues and Primary Spending, by Category, Under CBO’s Long Term
                     Budget Scenarios                                                                      5

           1 2.   Federal Debt Held by the Public Under CBO’s Long Term Budget Scenarios                  14

           1 3.   Reductions in Primary Spending or Increases in Revenues in Various Years
                     Needed to Close the 25 Year Fiscal Gap Under CBO’s Alternative
                     Fiscal Scenario                                                                      16

           1 4.   Various Paths for Primary Spending That Would Close the 25 Year Fiscal Gap
                      Under CBO’s Alternative Fiscal Scenario                                             17

           1 5.   Real GDP per Capita Under Stable Economic Conditions or with
                      Crowding Out Effects                                                                20

           1 6.   Federal Debt Held by the Public With and Without Crowding Out Effects                   21

           1 7.   Comparison of CBO’s 2009 and 2010 Budget Projections Under the
                     Extended Baseline Scenario                                                           23

           1 8.   Comparison of CBO’s 2009 and 2010 Budget Projections Under the
                     Alternative Fiscal Scenario                                                          24

           2 1.   Distribution of Spending for Health Services and Supplies, 2008                         27


                                                                                                                         CBO
VIII   THE LONG-TERM BUDGET OUTLOOK


              Figures (Continued)
                 2 2.     Mandatory Federal Spending on Health Care, by Category, Under
                             CBO’s Extended Baseline Scenario                                              38

                 2 3.     Mandatory Federal Spending on Health Care Under CBO’s Long Term
                             Budget Scenarios                                                              39

                 2 4.     Comparison of CBO’s 2009 and 2010 Projections of Mandatory Federal
                             Spending on Health Care Under the Extended Baseline Scenario                  42

                 2 5.     Mandatory Federal Spending on Health Care Under CBO’s Alternative
                             Fiscal Scenario and Different Assumptions About Excess Cost Growth            43

                 3 1.     Spending for Social Security Under CBO’s Long Term Budget Scenarios              46

                 3 2.     The Population Age 65 or Older as a Percentage of the Population Ages 20 to 64   47

                 4 1.     Total Revenues Under CBO’s Long Term Budget Scenarios                            52

                 4 2.     Revenues, by Source, 1970 to 2009                                                53

                 4 3.     Individual Income Tax Revenues Under CBO’s Extended Baseline Scenario and
                              Two Variants                                                                 56

                 4 4.     The Impact of the Alternative Minimum Tax on Individual Income Tax
                             Liability Under CBO’s Extended Baseline Scenario, 2009 to 2035                60

                 A 1.     Revenues and Primary Spending, by Category, Under CBO’s Long Term
                             Budget Scenarios Through 2080                                                 66

                 A 2.     Federal Debt Held by the Public Under CBO’s Long Term Budget Scenarios
                              Through 2080                                                                 67

                 A 3.     Comparison of CBO’s 2009 and 2010 Budget Projections Under the
                             Extended Baseline Scenario Through 2080                                       68

                 A 4.     Comparison of CBO’s 2009 and 2010 Budget Projections Under the
                             Alternative Fiscal Scenario Through 2080                                      69

                 A 5.     Spending for Social Security Under CBO’s Long Term Budget Scenarios
                             Through 2080                                                                  70

                 A 6.     Total Revenues Under CBO’s Long Term Budget Scenarios Through 2080               71


              Boxes
                 1 1.     The Statutory Pay As You Go Act of 2010                                           4

                 1 2.     How the Aging of the Population and Rising Costs for Health Care
                             Affect Federal Spending on Major Mandatory Programs                           10

                 2 1.     National Spending on Health Care                                                 40


CBO
Summary


R         ecently, the federal government has been record-
ing the largest budget deficits, as a share of the economy,
                                                               The Outlook for Major Health Care
                                                               Programs and Social Security
since the end of World War II. As a result of those defi-
                                                               CBO projects that if current laws do not change, federal
cits, the amount of federal debt held by the public has
                                                               spending on major mandatory health care programs will
surged. At the end of 2008, that debt equaled 40 percent
                                                               grow from roughly 5 percent of GDP today to about
of the nation’s annual economic output (as measured
                                                               10 percent in 2035 and will continue to increase there-
by gross domestic product, or GDP), a little above the
                                                               after.1 Those projections include all of the effects of the
40-year average of 36 percent. Since then, large budget
                                                               recently enacted health care legislation, which is expected
deficits have caused debt held by the public to shoot
                                                               to increase federal spending in the next 10 years and for
upward; the Congressional Budget Office (CBO) projects
                                                               most of the following decade.2 By 2030, however, that
that federal debt will reach 62 percent of GDP by the end
                                                               legislation will slightly reduce federal spending for health
of this year—the highest percentage since shortly after
                                                               care if all of its provisions are fully implemented, CBO
World War II. The sharp rise in debt stems partly from
                                                               projects. That reduction in the level of spending in 2030
lower tax revenues and higher federal spending related to
                                                               yields lower projections of health care spending in the
the recent severe recession and turmoil in financial mar-
                                                               longer term—even though, owing to the great uncertain-
kets. However, the growing debt also reflects an imbal-
                                                               ties involved in projecting such spending many decades
ance between spending and revenues that predated those
                                                               in the future, enactment of the legislation did not cause
economic developments.
                                                               CBO to change its estimates of longer-term growth rates
                                                               for spending on the government’s health care programs.
As the economy recovers and the policies adopted to
counteract the recession and the financial turmoil phase
                                                               Under current law, spending on Social Security is also
out, budget deficits will probably decline markedly in the
                                                               projected to rise over time as a share of GDP, albeit much
next few years. But over the long term, the budget out-
look is daunting. The retirement of the baby-boom gen-
                                                               1. Mandatory programs are ones that do not require annual appro-
eration portends a significant and sustained increase in          priations by the Congress; the major mandatory health programs
the share of the population receiving benefits from Social        consist of Medicare, Medicaid, the Children’s Health Insurance
Security, Medicare, and Medicaid. Moreover, per capita            Program, and health insurance subsidies that will be provided
spending for health care is likely to continue rising faster      through the exchanges established by the recently enacted health
than spending per person on other goods and services for          care legislation.
many years (although the magnitude of that gap is very         2. For details, see Congressional Budget Office, letter to the Honor-
uncertain). Without significant changes in government             able Nancy Pelosi about the budgetary effects of H.R. 4872, the
                                                                  Reconciliation Act of 2010 (March 20, 2010), and Chapter 2 of
policy, those factors will boost federal outlays sharply
                                                                  this report. If all of its provisions are carried out, the legislation
relative to GDP in coming decades under any plausible             will also increase federal revenues and reduce budget deficits over
assumptions about future trends in the economy, demo-             the 2010–2019 period and in subsequent years, according to esti-
graphics, and health care costs.                                  mates by CBO and the staff of the Joint Committee on Taxation.


                                                                                                                                           CBO
X    THE LONG-TERM BUDGET OUTLOOK


      less dramatically. CBO projects that Social Security          percentages thereafter. At the same time, government
      spending will increase from less than 5 percent of GDP        spending on everything other than the major mandatory
      today to about 6 percent in 2030 and then stabilize at        health care programs, Social Security, and interest on fed-
      roughly that level.                                           eral debt—activities such as national defense and a wide
                                                                    variety of domestic programs—would decline to the low-
      All told, CBO projects, the aging of the population and       est percentage of GDP since before World War II.
      the rising cost of health care will cause spending on the
      major mandatory health care programs and Social Secu-         That significant increase in revenues and decrease in
      rity to grow from roughly 10 percent of GDP today to          the relative importance of other spending would offset
      about 16 percent of GDP 25 years from now if current          much—though not all—of the rise in spending on health
      laws are not changed. (By comparison, spending on all of      care programs and Social Security. As a result, debt would
      the federal government’s programs and activities, exclud-     increase from its already high levels relative to GDP, as
      ing interest payments on debt, has averaged 18.5 percent      would the required interest payments on that debt.
      of GDP over the past 40 years.) To put U.S. fiscal policy     Federal debt held by the public would grow from an
      on a sustainable path, lawmakers would have to substan-       estimated 62 percent of GDP this year to about 80 per-
      tially reduce the growth in outlays for those programs        cent by 2035. Interest payments, which absorb federal
      relative to the amounts that CBO is projecting—or else        resources that could otherwise be used to pay for govern-
      match that growth with equivalent declines in other           ment services, currently amount to more than 1 percent
      federal spending, corresponding increases in federal          of GDP; under this scenario, they would rise to 4 percent
      revenues, or some combination of the two.                     of GDP (or one-sixth of federal revenues) by 2035.

                                                                    The budget outlook is much bleaker under the alternative
      Alternative Long-Term Scenarios                               fiscal scenario, which incorporates several changes to cur-
      In this report, CBO presents the long-term budget pic-        rent law that are widely expected to occur or that would
      ture under two scenarios that embody different assump-        modify some provisions of law that might be difficult to
      tions about future policies governing federal revenues and    sustain for a long period. In this scenario, CBO assumed
      spending. Budget projections grow increasingly uncertain      that Medicare’s payment rates for physicians would grad-
      as they extend farther into the future, so this report        ually increase (which would not happen under current
      focuses largely on the next 25 years. However, because        law) and that several policies enacted in the recent health
      considerable interest exists in the longer-term outlook,      care legislation that would restrain growth in health care
      figures showing projections through 2080 are presented        spending would not continue in effect after 2020. In
      in Appendix A, and associated data are available on           addition, under the alternative scenario, spending on
      CBO’s Web site.                                               activities other than the major mandatory health care
                                                                    programs, Social Security, and interest would fall below
      The first long-term budget scenario used in this analysis,    the average level of the past 40 years relative to GDP,
      the extended-baseline scenario, adheres closely to current    though not as low as under the extended-baseline sce-
      law. It incorporates CBO’s current estimate of the impact     nario. More important, CBO assumed for this scenario
      of the recently enacted health care legislation on revenues   that most of the provisions of the 2001 and 2003 tax cuts
      and mandatory spending. (That estimate is unchanged           would be extended, that the reach of the alternative mini-
      from the one that CBO and the staff of the Joint Com-         mum tax would be kept close to its historical extent, and
      mittee on Taxation published in March, when the legisla-      that over the longer run, tax law would evolve further so
      tion was being considered.) Under this scenario, the expi-    that revenues would remain at about 19 percent of GDP,
      ration of most of the tax cuts enacted in 2001 and 2003,      near their historical average.
      the growing reach of the alternative minimum tax, and
      the way in which the tax system interacts with economic       Under that combination of policy assumptions, federal
      growth would result in steadily higher average tax rates.     debt would grow much more rapidly than under the
      Those rising rates, combined with the tax provisions of       extended-baseline scenario. With significantly lower reve-
      the recent health care legislation, would push total reve-    nues and higher outlays, debt would reach 87 percent of
      nues to 23 percent of GDP by 2035—much higher than            GDP by 2020, CBO projects. After that, the growing
      has typically been seen in recent decades—and to larger       imbalance between revenues and noninterest spending,


CBO
SUMMARY                                                                                        THE LONG-TERM BUDGET OUTLOOK    XI


combined with spiraling interest payments, would swiftly           abroad, and less domestic investment—which in turn
push debt to unsustainable levels. Debt as a share of GDP          would lower income growth in the United States.
would exceed its historical peak of 109 percent by 2025
and would reach 185 percent in 2035.                           B   Growing debt would also reduce lawmakers’ ability to
                                                                   respond to economic downturns and other challenges.
Neither of those scenarios represents a prediction by
CBO of what policies will be in effect during the next         B   Over time, higher debt would increase the probability
several decades. The policies adopted in coming years will         of a fiscal crisis in which investors would lose confi-
surely differ from those assumed for the scenarios. (And           dence in the government’s ability to manage its
even if the assumed policies were adopted, their economic          budget, and the government would be forced to pay
and budgetary consequences would certainly differ from             much more to borrow money.
those projected in this report.) Nevertheless, these projec-
tions, encompassing two very different sets of policy          Keeping deficits and debt from growing to unsustainable
assumptions, provide a clear indication of the serious         levels would require raising revenues as a percentage of
nature of the fiscal challenge facing the nation.              GDP significantly above past levels, reducing outlays
                                                               sharply relative to CBO’s projections, or some combina-
                                                               tion of those approaches. Making such changes while
The Impact of Growing                                          economic activity and employment remain well below
Deficits and Debt                                              their potential levels would probably slow the economic
In fact, CBO’s projections understate the severity of the      recovery. However, the sooner that long-term changes to
long-term budget problem because they do not incorpo-          spending and revenues are agreed on, and the sooner they
rate the significant negative effects that accumulating        are carried out once the economic weakness ends, the
substantial amounts of additional federal debt would           smaller will be the damage to the economy from growing
have on the economy:                                           federal debt. Earlier action would require more sacrifices
                                                               by earlier generations to benefit future generations, but it
B   Large budget deficits would reduce national saving,        would also permit smaller or more gradual changes and
    leading to higher interest rates, more borrowing from      would give people more time to adjust to them.


                                                                                                                              CBO
CHAPTER


                                                                      1
                              The Long-Term Outlook for the
                                     Federal Budget


T      he federal government has recently been recording
the largest budget deficits, relative to the size of the econ-
                                                                         Looking beyond the next decade, the fiscal outlook wors-
                                                                         ens further. Although long-term budget projections are
omy, since 1945. As a result, the amount of federal debt                 highly uncertain, if current laws were followed, the aging
held by the public has surged. Debt is expected to equal                 of the population and rising costs for health care would
62 percent of the economy’s annual output, or gross                      almost certainly cause federal spending to rise sharply
domestic product (GDP), at the end of this fiscal year, up               relative to GDP. Federal revenues would increase to sig-
from 40 percent at the end of 2008. That sharp deteriora-                nificantly higher levels under current law than have ever
tion in the fiscal situation reflects several factors: an                been seen in the United States, but they would still fall
imbalance between spending and revenues that predated                    short of spending, according to CBO’s long-term projec-
the recent recession and the turmoil in financial markets;               tions. Consequently, federal debt would grow relative to
a decline in tax revenues and an increase in spending on                 the size of the economy after the next decade. By 2035, it
benefit programs caused by those economic problems;                      would equal 79 percent of GDP—the highest percentage
and the costs of federal policies enacted in response to the             in U.S. history except for the period between 1944 and
problems.                                                                1950.

If current laws were to remain unchanged, the budget                     An alternative scenario presented in this report incor-
deficit would drop markedly as a percentage of GDP                       porates several changes to current law that are widely
in the next few years, the Congressional Budget Office                   expected to occur or that would modify some provisions
(CBO) projects, and federal debt held by the public                      of law that might be difficult to sustain for a long period.
would stabilize at about 67 percent of GDP for the next                  If such changes occurred—maintaining what some ana-
decade.1 Those baseline projections, however, understate                 lysts might consider “current policy” as opposed to cur-
the budget deficits that would arise if policies that are in             rent law—revenues would increase much more slowly
effect now or have been in effect recently were extended,                than spending, and federal debt would balloon to 185
instead of implementing what current laws specify for                    percent of GDP by 2035. As debt grows, so does the bur-
future years. Specifically, if most provisions of the tax cuts           den of paying interest on it; thus, under that alternative
enacted in 2001 and 2003 were extended rather than                       scenario, interest outlays would rise from about 1 percent
allowed to expire as scheduled, if provisions designed to                of GDP today to 9 percent by 2035. With still larger
limit the reach of the alternative minimum tax (AMT)                     amounts of debt projected for later years under that sce-
were also extended, and if annual appropriations kept                    nario, such a path for federal borrowing would clearly be
pace with the growth of GDP, by 2020 the budget                          unsustainable.
deficit would be growing steadily. In that case, debt
held by the public would reach almost 90 percent of                      Moreover, the projected outcomes under both scenarios
GDP in 2020.                                                             do not include the harmful effects that rising debt would
                                                                         have on economic growth and interest rates. If those
1. See Congressional Budget Office, An Analysis of the President’s       effects were taken into account, projected debt would
   Budgetary Proposals for Fiscal Year 2011 (March 2010).                increase even faster.


                                                                                                                                        CBO
2    THE LONG-TERM BUDGET OUTLOOK


      If policymakers are to put the nation on a sustainable                          rent tax law, federal revenues would grow significantly
      budgetary path, they will need to let revenues increase                         faster than GDP over the long run under this scenario.
      substantially as a percentage of GDP, decrease spending
      significantly from projected levels, or adopt some combi-                   B   The alternative fiscal scenario embodies several possible
      nation of those two approaches. With economic activity                          changes to current law that would continue certain tax
      and employment currently well below the levels that                             and spending policies that people have grown accus-
      could be achieved by fully utilizing the nation’s labor                         tomed to (because the policies are in place now or
      force and capital stock, raising revenues or curbing                            have been in place recently). Versions of some of the
      spending immediately would probably slow the economic                           changes assumed in the scenario—such as those
      recovery. However, the sooner that long-term changes to                         related to the AMT and Medicare’s payments to
      spending and revenues are agreed on, and the sooner they                        physicians—have regularly been enacted in the past.
      are implemented after the period of economic weakness,                          Those and certain other changes included in the sce-
      the smaller will be the damage to the economy from
                                                                                      nario—such as changes related to the tax cuts enacted
      rising federal debt.
                                                                                      in 2001 and 2003—are widely expected to be made in
                                                                                      some form over the next few years. If they are, they
      Alternative Scenarios for the                                                   will receive special treatment under the Statutory Pay-
      Long-Term Budget Outlook                                                        As-You-Go Act of 2010 (Public Law 111-139), which
      In this report, CBO presents two sets of long-term bud-                         excludes some of the costs of such changes from the
      get projections that are based on differing assumptions                         law’s budget enforcement rules. (For details, see
      about future policy (see Table 1-1):                                            Box 1-1.)

      B   The extended-baseline scenario adheres most closely to                      After 2020, the alternative fiscal scenario also incor-
          current law. It follows CBO’s March 2010 baseline                           porates potential modifications to several provisions of
          budget projections (adjusted for the effects of recently                    current law that might be difficult to sustain for a long
          enacted health care legislation) for the next decade and                    period. Those provisions include certain restraints on
          then extends the baseline concept beyond that 10-year                       the growth of spending for Medicare and indexing
          window.2 This scenario incorporates CBO’s current                           provisions that will slow the growth of subsidies for
          estimate of the impact of the recent health care legisla-                   health insurance coverage. Other provisions of current
          tion on revenues and mandatory spending; that esti-                         law, if continued, would cause tax revenues as a per-
          mate is unchanged from March. The current-law                               centage of GDP to ultimately rise well above the levels
          assumption of the extended-baseline scenario implies                        that U.S. taxpayers have seen in the past. Therefore,
          that many adjustments that lawmakers have routinely                         the alternative fiscal scenario also incorporates unspec-
          made in the past—such as changes to the AMT and to                          ified changes in tax law that would keep revenues
          the Medicare program’s payments to physicians—will
                                                                                      constant as a share of GDP after 2020. Together, the
          not be made again.3 Because of the structure of cur-
                                                                                      changes in the alternative fiscal scenario represent one
                                                                                      interpretation of what it would mean to continue
      2. CBO’s baseline is a benchmark for measuring the budgetary
         effects of proposed changes to federal revenues or spending. It
                                                                                      today’s underlying fiscal policy. However, different
         consists of projections of budget authority, outlays, revenues, and          analysts might perceive the underlying intention of
         the deficit or surplus over 10 years calculated according to rules set       current policy differently.
         forth in the Balanced Budget and Emergency Deficit Control Act
         of 1985. Those projections are not intended to be predictions of         The projections in this report understate the size of the
         future budgetary outcomes; rather, they represent CBO’s best             budgetary shortfalls that would be likely to result from
         judgment of how economic and other factors would affect federal
                                                                                  such fiscal policies. For the purposes of the projections,
         revenues and spending if current laws did not change.
                                                                                  CBO assumed stable economic conditions after 2020—
      3. The alternative minimum tax is a parallel income tax system with         in particular, a constant real (inflation-adjusted) interest
         fewer exemptions, deductions, and rates than the regular income
         tax. Households must calculate the amount they owe under both            rate on federal debt and steady growth rates for real wages
         the AMT and the regular income tax and pay the larger of the two         and output. That approach omits the pressures that a
         amounts.                                                                 rise in debt as a percentage of GDP would have on real


CBO
CHAPTER ONE                                                                                                       THE LONG-TERM BUDGET OUTLOOK           3


Table 1-1.
Assumptions About Spending and Revenues Underlying CBO’s
Long-Term Budget Scenarios
                            Extended-Baseline Scenario                               Alternative Fiscal Scenario
                                                          Assumptions About Spending
Medicare                    As scheduled under current law                           As scheduled under current law, except that payment rates
                                                                                     for physicians grow with the Medicare economic index
                                                                                     (rather than at the lower rates of the sustainable growth rate
                                                                                     mechanism) and that after 2020, several policies that would
                                                                                     restrain spending growth are assumed not to be in effect

Medicaid and Exchange       As scheduled under current law                           As scheduled under current law, except that after 2020,
Subsidies                                                                            a policy that would slow the growth of subsidies for health
                                                                                     insurance coverage is assumed not to be in effect

CHIP                        As projected in CBO's baseline through 2020; adjusted    As projected in CBO's baseline through 2020; adjusted
                            for growth in per capita GDP and the size of the         for growth in per capita GDP and the size of the
                            under-18 population thereafter                           under-18 population thereafter

Social Security             As scheduled under current law                           As scheduled under current law

Other Noninterest           As projected in CBO's baseline through 2020; remaining   As projected in CBO's baseline through 2013; remaining at
Spending                    at the 2020 level as a share of GDP thereafter, except   the 2010 level as a share of GDP (minus stimulus and related
                            that some refundable tax credits, Medicare premiums,     spending) thereafter, except that some refundable tax credits,
                            and certain payments by states to Medicare are as        Medicare premiums, and certain payments by states to Medicare
                            scheduled under current law                              are as scheduled under current law

                                                          Assumptions About Revenues
Individual Income Taxes     As scheduled under current law                           Through 2020, tax cuts from EGTRRA and JGTRRA are extended
                                                                                     (except for rate reductions that apply to high-income taxpayers)
                                                                                     and AMT relief is extended; thereafter, individual income taxes
                                                                                     are adjusted to keep total revenues constant as a share of GDP

Payroll Taxes               As scheduled under current law                           As scheduled under current law

Corporate Income Taxes      As scheduled under current law through 2020; remaining   As scheduled under current law through 2020; remaining
                            constant as a share of GDP thereafter                    constant as a share of GDP thereafter

Excise Taxes                As scheduled under current law                           As scheduled under current law though 2020; remaining
                                                                                     constant as a share of GDP thereafter

Estate and Gift Taxes       As scheduled under current law                           2009 tax rates and exemption amount (adjusted for inflation)
                                                                                     continue through 2020; revenues are constant as a share of
                                                                                     GDP thereafter

Other Sources of Revenue    As scheduled under current law through 2020; remaining   As scheduled under current law through 2020; remaining
                            constant as a share of GDP thereafter                    constant as a share of GDP thereafter

Source: Congressional Budget Office.
Notes: The extended-baseline scenario adheres closely to current law, following CBO’s 10-year baseline budget projections through 2020
       (with adjustments for the recently enacted health care legislation) and then extending the baseline concept for the rest of the long-
       term projection period. The alternative fiscal scenario incorporates several changes to current law that are widely expected to occur or
       that would modify some provisions that might be difficult to sustain for a long period.
        CHIP = Children’s Health Insurance Program; GDP = gross domestic product; EGTRRA = Economic Growth and Tax Relief Recon-
        ciliation Act of 2001; JGTRRA = Jobs and Growth Tax Relief Reconciliation Act of 2003; AMT = alternative minimum tax.


                                                                                                                                                        CBO
4    THE LONG-TERM BUDGET OUTLOOK


          Box 1-1.
          The Statutory Pay-As-You-Go Act of 2010
           In February 2010, lawmakers enacted a new version                  Act provides special treatment for legislation that
           of some of the budget enforcement procedures that                  does the following:
           were in effect in the 1990s. The Statutory Pay-As-
           You-Go Act of 2010 (Public Law 111-139) aims to                    B   Amends or supersedes the system for updating
           make sure that most new legislation affecting reve-                    Medicare’s payments to physicians;
           nues or mandatory spending does not increase federal
           budget deficits. The law requires the Congressional                B   Continues the parameters of the estate and gift
           Budget Office (CBO) to estimate the potential bud-                     taxes at their 2009 levels, adjusted for inflation;
           getary effects of proposed legislation that is subject to
           the new procedures; it also requires the Office of                 B   Adjusts the exemption amounts under the alterna-
           Management and Budget to keep a running tally of                       tive minimum tax to keep the number of people
           the average annual budgetary impact of any such leg-                   affected by that tax at the same level as in 2008; or
           islation that is enacted.1 If, at the end of a Congres-
           sional session, the tally shows a net cost for the bud-            B   Extends certain expiring provisions of the Eco-
           get year from such legislation, the Administration                     nomic Growth and Tax Relief Reconciliation
           must order a sequestration—canceling certain already                   Act of 2001 and the Jobs and Growth Tax Relief
           enacted mandatory funding—to cover that cost.                          Reconciliation Act of 2003 for taxpayers who cur-
                                                                                  rently make less than $250,000 (in the case of
           Under current law, some payment rates and tax rates                    couples filing joint returns) or $200,000 (in the
           will change significantly if they are not extended at                  case of single filers).
           their present levels. The Statutory Pay-As-You-Go
                                                                              Such legislation is subject to the new law’s pay-as-
                                                                              you-go rules. But the tally of the budgetary effects of
           1. The Statutory Pay-As-You-Go Act does not apply to discre-
                                                                              the legislation must reflect specific “current-policy
              tionary funding provided in appropriation acts or to any leg-   adjustments” that reduce the recorded cost of those
              islative provision that the Congress designates as an           changes. The authority to allow for such adjustments
              emergency requirement.                                          expires on January 1, 2012.


      interest rates and economic growth. It also omits the                   last year, the highest level since World War II. Those fac-
      impact that higher effective marginal tax rates and the                 tors will keep spending at roughly the same level in 2010
      increasing value of government benefits would have on                   and 2011, CBO projects. However, as the economy
      incentives to work and save.4                                           recovers and the budgetary effects of those policies dimin-
                                                                              ish, primary spending is projected to decline to 20 per-
      The Extended-Baseline Scenario                                          cent of GDP and remain near that level through 2020. In
      Under CBO’s current-law scenario, primary spending—
                                                                              subsequent years, primary spending would follow a long
      all spending except interest payments on federal debt—
                                                                              upward trajectory under the extended-baseline scenario,
      would drop relative to GDP in the next few years, level
                                                                              reaching 24 percent of GDP in 2035 (see the top panel of
      out for the rest of the decade, and grow significantly in
      later decades. The severe recession and financial turmoil,              Figure 1-1) and 30 percent in 2080.5 (This report focuses
      as well as federal policies implemented in response to                  on primary spending because growth in debt as a share of
      them, pushed primary spending to 23 percent of GDP                      GDP is determined mainly by the relationship between
                                                                              revenues and primary outlays.)
      4. Effective marginal tax rates on labor or capital income represent
         the percentage of the last dollar of such income that is taken by    5. Longer-term versions of some of the figures in this chapter are
         federal taxes.                                                          presented in Appendix A.


CBO
CHAPTER ONE                                                                                                    THE LONG-TERM BUDGET OUTLOOK        5


Figure 1-1.
Revenues and Primary Spending, by Category, Under CBO’s Long-Term
Budget Scenarios
(Percentage of gross domestic product)
                                                         Extended-Baseline Scenario
30
                                Actual Projected

25                                                   Total Primary Spending
               Revenues

20

                                                                       Other Noninterest Spending
15


10                                                                        Medicare, Medicaid,
                                                                      CHIP, and Exchange Subsidies
 5
                                                                              Social Security
 0
  2000               2005                2010               2015                2020               2025               2030                2035


                                                         Alternative Fiscal Scenario
30
                                Actual Projected
                                                                                                          Revenues
                                                     Total Primary Spending
25


20

                                                                        Other Noninterest Spending
15


10                                                                         Medicare, Medicaid,
                                                                       CHIP, and Exchange Subsidies
 5
                                                                              Social Security
 0
  2000               2005                2010               2015               2020                2025               2030                2035

Source: Congressional Budget Office.
Notes: Primary spending refers to all spending other than interest payments on federal debt.
       The extended-baseline scenario adheres closely to current law, following CBO’s 10-year baseline budget projections through 2020
       (with adjustments for the recently enacted health care legislation) and then extending the baseline concept for the rest of the long-
       term projection period. The alternative fiscal scenario incorporates several changes to current law that are widely expected to occur or
       that would modify some provisions that might be difficult to sustain for a long period. (For details, see Table 1-1 on page 3.)
       CHIP = Children’s Health Insurance Program.


                                                                                                                                                  CBO
6    THE LONG-TERM BUDGET OUTLOOK


      Revenues would also rise considerably under current law;        On the revenue side, the alternative fiscal scenario
      by the 2020s, they would reach higher levels relative to the    incorporates the assumptions that most of the cuts in
      size of the economy than ever recorded in the nation’s his-     individual income taxes enacted in 2001 and 2003 that
      tory. Currently about 15 percent of GDP, revenues would         are now scheduled to expire in 2011 (except the lower
      jump to 19 percent in 2012 as the economic recovery             rates applying to high-income taxpayers) are extended
      increased taxable income, and thus tax receipts; as most of     through 2020; that relief from the AMT, which expired
      the tax reductions enacted in 2001 and 2003 expired at          after 2009, continues through 2020; and that the 2009
      the end of 2010 as scheduled; and as the reach of the           parameters of the estate tax (adjusted for inflation) apply
      AMT expanded greatly, because (unlike most of the tax           through 2020. Thereafter, revenues are assumed to
      code) the dollar amounts of its parameters do not increase      remain at their 2020 level of just over 19 percent of GDP,
                                                                      about a percentage point above the average of the past
      with inflation. In subsequent years, revenues would con-
                                                                      40 years. That revenue path, combined with the spending
      tinue to rise relative to GDP, for three main reasons. First,
                                                                      policies described above, would produce a deficit equal to
      ongoing increases in real income would push taxpayers
                                                                      16 percent of GDP by 2035 and would push federal debt
      into higher tax brackets. Second, ongoing inflation, even       to levels unprecedented in the United States. Debt would
      if modest, would cause more people to owe tax under the         exceed 100 percent of GDP by 2023 and 200 percent by
      AMT. And third, the recently enacted excise tax on certain      2037.
      high-premium health insurance plans would have a grow-
      ing effect on revenues. Taken together, those factors
      would cause federal revenues to grow faster than the econ-      The Long-Term Outlook for Spending
      omy, reaching 23 percent of GDP in 2035 and 30 percent          Excluding interest payments on debt held by the public,
      in 2080.                                                        federal outlays have averaged 18.5 percent of GDP over
                                                                      the past 40 years. Such primary spending is now unusu-
      However, even with revenues rising to those levels (and         ally high—and is expected to remain so through next
      omitting the economic effects of such increases), the bud-      year—because of the recent recession, tumult in financial
      get would still be out of balance over the long term under      markets, and policies implemented in response to those
      the extended-baseline scenario. As a result, the deficit        conditions. However, CBO projects that such outlays will
                                                                      decline to 20 percent of GDP by 2014.
      (including interest costs) would equal about 4 percent of
      GDP in 2035, and federal debt held by the public would
                                                                      Beyond that point, primary spending would rise again
      continue to accumulate, rising to 79 percent of GDP in          under both of CBO’s long-term budget scenarios—to
      2035 and larger percentages thereafter.                         24 percent of GDP by 2035 under the extended-baseline
                                                                      scenario and to 26 percent under the alternative fiscal
      The Alternative Fiscal Scenario                                 scenario (see Table 1-2). In both cases, primary outlays
      Under the alternative fiscal scenario, primary spending         would continue to grow steadily in later years.
      would be 1.6 percentage points higher as a share of GDP
      in 2020 than under the extended-baseline scenario (see          Mandatory Outlays for Health Care
      the bottom panel of Figure 1-1). That difference would          Programs and Social Security
      grow in later years. The higher spending stems from sev-        Federal spending for mandatory programs has grown
      eral assumptions of the alternative fiscal scenario: that       sharply as a share of primary outlays in the past several
      lawmakers would act to raise Medicare’s payments to             decades, reaching about 60 percent in recent years. Most
      physicians; that lawmakers would not allow various              of that growth has been concentrated in the three largest
      restraints on the growth of costs for Medicare and for          entitlement programs—Medicare, Medicaid, and Social
      health insurance subsidies to have their full effect in the
      decade after 2020; and that federal spending for things         6. Mandatory programs are ones that do not require annual appro-
      other than major mandatory programs or interest pay-               priations by the Congress; the funding available for them is gener-
                                                                         ally not limited. Most mandatory spending is for entitlement
      ments would be similar to typical recent levels as a per-          programs, in which the federal government is required to make
      centage of GDP (rather than declining through 2020,                payments to any person or other entity that meets the eligibility
      as under the extended-baseline scenario).6                         criteria set in law.


CBO
CHAPTER ONE                                                                                                   THE LONG-TERM BUDGET OUTLOOK         7


Table 1-2.
Projected Spending and Revenues Under CBO’s Long-Term Budget Scenarios
(Percentage of gross domestic product)
                                                               2010                           2020                            2035
                                                                                 Extended-Baseline Scenario
Spending
  Primary spending
     Social Security                                            4.8                            5.2                              6.2
     Medicarea                                                  3.6                            4.1                              5.9
     Medicaid, CHIP, and exchange subsidies                     1.9                            2.8                              3.8
     Other noninterest spending                                12.5
                                                              ____                              8.3
                                                                                              ____                              7.8
                                                                                                                              ____
       Subtotal, primary spending                              22.9                            20.4                            23.7
  Interest spending                                            1.4
                                                              ____                             3.1
                                                                                              ____                              3.9
                                                                                                                              ____
           Total Spending                                      24.3                            23.5                            27.6
Revenues                                                       14.9                            20.7                            23.3
Deficit (-) or Surplus
  Primary deficit or surplus                                   -8.0                             0.3                            -0.4
  Total deficit                                                -9.4                            -2.7                            -4.3
Debt Held by the Publicb                                         62                              66                              79

                                                                                   Alternative Fiscal Scenario
Spending
  Primary spending
     Social Security                                            4.8                            5.2                              6.2
     Medicarea                                                  3.6                            4.3                              7.0
     Medicaid, CHIP, and exchange subsidies                     1.9                            2.9                              3.9
     Other noninterest spending                                12.5
                                                              ____                             9.7
                                                                                              ____                              9.3
                                                                                                                              ____
       Subtotal, primary spending                              22.9                            22.1                            26.4
  Interest spending                                            1.4
                                                              ____                             3.8
                                                                                              ____                              8.7
                                                                                                                              ____
           Total Spending                                      24.3                            25.9                            35.2
Revenues                                                       14.9                            19.3                            19.3
Deficit
  Primary deficit                                              -8.0                            -2.9                            -7.2
  Total deficit                                                -9.4                            -6.6                           -15.9
Debt Held by the Publicb                                         62                              87                             185

Source: Congressional Budget Office.
Notes: Primary spending refers to all spending other than interest payments on federal debt. The primary deficit or surplus is the difference
       between revenues and primary spending.
       The extended-baseline scenario adheres closely to current law, following CBO’s 10-year baseline budget projections through 2020
       (with adjustments for the recently enacted health care legislation) and then extending the baseline concept for the rest of the long-
       term projection period. The alternative fiscal scenario incorporates several changes to current law that are widely expected to occur or
       that would modify some provisions that might be difficult to sustain for a long period. (For details, see Table 1-1 on page 3.)
       CHIP = Children’s Health Insurance Program.
a. Spending for Medicare beneficiaries includes amounts funded through beneficiaries’ premiums.
b. At the end of the year.


                                                                                                                                                  CBO
8    THE LONG-TERM BUDGET OUTLOOK


      Security. Together, federal outlays for those three pro-                ever, CBO projects that the number of workers per
      grams accounted for an average of 46 percent of primary                 beneficiary will decline significantly over the next quarter
      spending over the past 10 years, up from 27 percent in                  century (from 2.9 in 2010 to 2.0 in 2035) and then will
      1975.                                                                   continue to drift downward.

      Under CBO’s scenarios, all of the projected growth in                   In the case of the major mandatory health care programs,
      primary outlays as a share of GDP in coming years stems                 both aging and the rapid growth of per capita health care
      from increases in mandatory spending, particularly in                   costs are responsible for the projected rise in federal
      spending for the government’s major health care pro-                    spending as a share of GDP, because more elderly people
      grams: Medicare, Medicaid, the Children’s Health Insur-                 will use increasingly expensive health care. (For a detailed
      ance Program (CHIP), and insurance subsidies that will                  breakdown of the roles played by those two factors, see
      be provided through the exchanges created by the                        Box 1-2 on page 10.) In its long-term projections, CBO
      recently enacted health care legislation. Under both of                 anticipates that spending growth for health programs will
      CBO’s scenarios, total outlays for those health programs                moderate from past rates even if federal laws do not
      would roughly double as a share of GDP over the next                    change (see Chapter 2). Both Medicaid and CHIP are
      25 years, from 5.5 percent in 2010 to about 10 percent or               financed jointly by the federal government and state gov-
      11 percent in 2035.7 (For details about long-term projec-               ernments, so growth in federal spending is expected to
      tions of health care spending, see Chapter 2.) Spending                 slow as states move to limit their costs. And even without
      on Social Security would rise much more slowly, from                    changes to the laws governing Medicare, growth in
      almost 5 percent of GDP in 2009 to about 6 percent in                   spending on that program is projected to slow (though
      the 2030s and beyond (see Chapter 3).                                   to a lesser degree than for the other health programs)
                                                                              because of future regulatory changes to the program and
      Causes of Spending Growth. Two factors account for the                  changes to the health care system as a whole.
      projected increases in outlays for the government’s large
      entitlement programs: the aging of the population and                   Effects of Recent Legislation. The health care legislation
      the rapid growth of health care costs per capita. The                   enacted in March 2010—the Patient Protection and
      retirement of the large baby-boom generation born                       Affordable Care Act (P.L. 111-148), as modified by the
      between 1946 and 1964 portends a long-lasting shift in                  Health Care and Education Reconciliation Act (P.L. 111-
      the age profile of the U.S. population. That shift will sub-            152)—will cause major changes in the components of
      stantially alter the balance between the working-age and                federal spending on health care. Both the expansion of
      retirement-age segments of the population. The share of                 eligibility for Medicaid and the provision of subsidies
      people age 65 or older is projected to grow from 13 per-                through new insurance exchanges will increase federal
      cent in 2010 to 20 percent in 2035, while the share of                  spending. At the same time, the legislation contains vari-
      people ages 20 to 64 is expected to fall from 60 percent to             ous provisions that will substantially reduce spending on
      55 percent. In later decades, the aging of the population               Medicare relative to what would have occurred under
      is expected to continue, but at a slower rate, because of               prior law. On net, the legislation will raise federal spend-
      increases in life expectancy.                                           ing on health care during most of the next two decades
                                                                              but lower it by the end of the second decade, according to
      In the case of Social Security, population aging drives the             the projections of CBO and the staff of the Joint Com-
      projected growth of spending as a percentage of GDP.                    mittee on Taxation (JCT). During that period, the net
      Initial Social Security benefits are based on an individual’s           effects in either direction represent less than 0.5 percent
      earnings, indexed to the overall growth of wages. Because               of GDP in any year.
      average benefits increase at approximately the same rate as
      average earnings, economic growth does not significantly                As discussed in Chapter 2, CBO does not believe it has
      change Social Security spending as a share of GDP. How-                 an analytic basis for evaluating the effects of the legisla-
                                                                              tion on the growth rate of spending over the very long
      7. Those totals include gross Medicare spending (that is, they do not   run. Therefore, after the next decade or two (depending
         net out offsetting receipts, which consist mainly of premiums paid   on the scenario), the projections in this report extrapolate
         by Medicare beneficiaries).                                          federal spending on health care (including the incremen-


CBO
CHAPTER ONE                                                                                                    THE LONG-TERM BUDGET OUTLOOK           9


tal effects of the legislation) using the same growth rates             baseline scenario—a difference that persists in later years
that would be assumed in the absence of the legislation.                because the growth rates of spending beyond that point
Because those growth rates are applied to different levels              are the same under the two scenarios. That gap highlights
of spending, however, health care spending varies from                  the important implications of those health care policies
the amounts that would be projected without that legisla-               for the federal budget.
tion for the rest of the long-term projection period.
                                                                        Under both scenarios, the trust funds for Social Security
Differences Between the Long-Term Scenarios. Spending                   and Part A of Medicare would become insolvent during
for Social Security would be identical under CBO’s                      the long-term projection period.10 However, to measure
extended-baseline and alternative fiscal scenarios, and                 the imbalance between the revenues and the outlays for
spending for Medicaid, CHIP, and the exchange subsidies                 benefits currently specified in law, CBO assumed that the
would be very similar. In the case of Medicare, however,                two programs would continue to pay benefits as now
spending would be about 1 percentage point higher rela-
                                                                        scheduled. (Spending for other parts of Medicare also
tive to GDP in 2035 under the alternative fiscal scenario
                                                                        flows through a trust fund, but automatic infusions of
than under the extended-baseline scenario, and the differ-
                                                                        general funds effectively ensure that it cannot become
ence would widen to 2 percentage points by 2080. Those
                                                                        insolvent. Medicaid has no underlying trust fund.)
projected spending paths differ for two main reasons:

B   Under the current-law assumptions of the extended-                  Other Federal Outlays
    baseline scenario, Medicare’s sustainable growth rate               A larger difference between the two scenarios involves
    mechanism would reduce payment rates for physicians                 projections of federal spending for everything besides the
    by 21 percent this year, with additional smaller reduc-             major mandatory health programs and Social Security.
    tions for the next few years.8 Under the alternative fis-           Other primary spending (net of Medicare premiums and
    cal scenario, by contrast, Medicare’s payment rates for             other offsetting receipts) would total about 8 percent of
    physicians would be stable in 2010 and then increase                GDP in 2020 under the extended-baseline scenario and
    gradually.                                                          about 10 percent under the alternative fiscal scenario,
                                                                        declining slowly thereafter in both cases. Under the
B   The extended-baseline scenario incorporates the                     extended-baseline scenario, interest payments by the gov-
    effects of the recent health care legislation, as esti-             ernment would increase to almost 4 percent of GDP by
    mated by CBO and JCT, over the next 20 years and                    2035 and then remain close to that level thereafter. Under
    then extrapolates those effects on spending levels in               the alternative fiscal scenario, interest spending would
    later years.9 By contrast, the alternative fiscal scenario          equal 9 percent of GDP in 2035 and would continue to
    incorporates the estimated effects of that legislation              rise dramatically—by 2055, it would exceed that year’s
    for only 10 years and then extrapolates the estimated               total federal revenues.
    changes in spending levels beyond that. In particular,
    several policies that would restrain the growth of                  Other Noninterest Spending Under the Extended-
    spending for Medicare are assumed in the alternative                Baseline Scenario. For the extended-baseline scenario,
    scenario not to be in effect after 2020, yielding a                 CBO used its 2010–2020 baseline projections of outlays
    higher level of spending in the 2020s and beyond.                   for programs other than the major mandatory health care
                                                                        programs and Social Security. This year, about one-
The upshot of those differences is that Medicare spending
                                                                        seventh of those outlays (or about 1.9 percent of GDP)
in 2035 is projected to be about 17 percent higher under
the alternative fiscal scenario than under the extended-                are associated with the federal government’s response to

                                                                        10. The balances of those trust funds represent the total amount that
8. Those projections do not include the effects of recent legislation
                                                                            the government is legally authorized to spend on each program.
   that delayed the reduction in payment rates until December 2010.
                                                                            For a discussion of the legal issues related to trust fund insolvency,
9. See Congressional Budget Office, letter to the Honorable Nancy           see Christine Scott, Social Security: What Would Happen If the
   Pelosi about the budgetary effects of H.R. 4872, the Reconcilia-         Trust Funds Ran Out? Report for Congress RL33514 (Congres-
   tion Act of 2010 (March 20, 2010).                                       sional Research Service, August 20, 2009).


                                                                                                                                                     CBO
10   THE LONG-TERM BUDGET OUTLOOK


          Box 1-2.
          How the Aging of the Population and Rising Costs for Health Care
          Affect Federal Spending on Major Mandatory Programs
           In the Congressional Budget Office’s (CBO’s) long-                   health care programs and Social Security: the aging of
           term projections of spending, growth in noninterest                  the U.S. population, which increases the number of
           spending as a share of gross domestic product (GDP)                  beneficiaries in those programs, and rapid growth in
           is attributable entirely to increases in spending on                 health care costs per beneficiary. CBO calculated how
           several large mandatory programs: Social Security,                   much of the projected rise in federal spending for the
           Medicare, Medicaid, and (to a lesser extent) insur-                  health care programs and Social Security under the
           ance subsidies that will be provided through the                     extended-baseline scenario is attributable to aging
           exchanges established by the recently enacted health                 and how much is attributable to “excess cost
           care legislation.1 The health programs are the main                  growth”—the extent to which health care costs per
           drivers of that growth; they are responsible for                     enrollee (adjusted for changes in the age profile of the
           80 percent of the total projected rise in spending on                population) grow faster than GDP per capita. CBO
           those mandatory programs over the next 25 years.                     made that calculation by comparing the outlays pro-
                                                                                jected under the extended-baseline scenario with the
           Two factors underlie the projected increase in federal               outlays that would occur under two alternative paths:
           spending on the government’s major mandatory                         one with an aging population but no excess cost
                                                                                growth for health care programs, and one with no
                                                                                aging but with excess cost growth.
           1. Under the new law, certain people with income up to
              400 percent of the federal poverty level will be eligible for
              federal subsidies to reduce their cost of obtaining private       The interaction between the aging of the population
              health insurance coverage. Although the premium subsidies         and excess cost growth accentuates their individual
              are structured as tax credits, most of the funds involved will    effects. As aging causes the number of beneficiaries of
              be classified as outlays because their value will generally       Medicare and Medicaid to rise, higher health care
              exceed what recipients’ income tax liability would otherwise
                                                                                spending per person has a larger impact. Conversely,
              be. CBO’s spending projections for major mandatory health
              care programs also include the Children’s Health Insurance        when health care costs are growing, having more
              Program, but spending on that program constitutes less than       beneficiaries imposes a larger budgetary cost. That
              0.1 percent of GDP.                                               interaction can be identified separately, or—as in


                                                                                                                                  Continued

      the recent recession.11 Over the coming decade, such                      expected to equal 1.1 percent of GDP this year)—is
      spending is either scheduled to expire under current law                  assumed to increase at the same rate as inflation through
      or is explicitly assumed in CBO’s projections to be tem-                  2020. Because output generally grows faster than prices
      porary and not to recur. Much of the rest of the govern-                  do, that spending is projected to shrink as a share of
      ment’s other noninterest spending—including spending                      GDP: from 12.5 percent this year to 10.9 percent in
      on military operations in Iraq and Afghanistan (which is                  2012 and 8.3 percent in 2020.

      11. The total amount of 1.9 percent of GDP includes outlays from          For later years, other noninterest outlays are generally
          the American Recovery and Reinvestment Act of 2009 (Public            assumed to remain constant at their 2020 levels as a share
          Law 111-5) and the portion of outlays for unemployment insur-         of GDP under the extended-baseline scenario. However,
          ance and the Supplemental Nutrition Assistance Program (for-
                                                                                two components of that spending were modeled
          merly known as Food Stamps) that CBO estimates would not
          occur if economic output were at its potential level. For a related   explicitly. First, premiums paid by Medicare beneficiaries
          discussion, see Congressional Budget Office, The Effects of Auto-     and certain payments by states to Medicare—which
          matic Stabilizers on the Federal Budget (May 2010).                   are classified as offsetting receipts (that is, as offsets to


CBO
CHAPTER ONE                                                                                      THE LONG-TERM BUDGET OUTLOOK   11


   Box 1-2.                                                                                                    Continued
   How the Aging of the Population and Rising Costs for Health Care
   Affect Federal Spending on Major Mandatory Programs
        Explaining Projected Growth in Federal                 effect on spending for Social Security. Given the sub-
       Spending on Major Mandatory Health Care                 stantial uncertainties that exist about long-term rates
           Programs and Social Security by                     of cost growth for health care, much more caution
              2035 and 2080, by Source                         should be applied to those longer-term projections.
    (Percent)                                                  (For a discussion of the rates of excess cost growth
                                           Excess Cost
                                                               that underlie those calculations, and the basis for
                     Aging                   Growth            them, see Chapter 2.)
                      Major Health Care Programs
                                                               Looking only at the major health care programs,
                          and Social Security
                                                               CBO found excess cost growth to be the main factor
    2035               63                      37
                                                               responsible for the projected increase in federal
    2080               44                      56
                                                               spending for those programs. Specifically, excess
                      Major Health Care Programs               cost growth accounts for 55 percent of the programs’
                                                               projected growth by 2035 and 71 percent by 2080.
    2035               45                      55
    2080               29                      71
                                                               Again, the precision of those calculations should not
                                                               be taken as an indication of certainty. Future rates of
    Source: Congressional Budget Office.                       aging and especially of excess cost growth could differ
                                                               substantially from CBO’s assumptions, particularly in
    CBO’s analysis—it can be allocated according to the        the longer term.
    shares attributable to aging and excess cost growth.

    Of the two factors, aging is the more important over          Sources of Growth in Federal Spending on
    the next 25 years. With the interaction allocated            Major Mandatory Health Care Programs and
    between the two, aging accounts for 63 percent of the               Social Security, 2010 to 2035
    total projected growth in spending on Social Security      (Percentage of gross domestic product)
    and the major mandatory health care programs by
    2035, and excess cost growth accounts for 37 percent       18
                                                                                            Effect of Excess
    (see the table above and the figure at right). That        16                             Cost Growth
    result is not surprising given that the aging of the       14
    baby-boom generation will significantly expand the         12
    number of people participating in many of those                                                     Effect of Aging
                                                               10
    programs.
                                                                8
                                                                6              Spending in the Absence of
    Over the longer term, however, the situation changes.
                                                                              Aging and Excess Cost Growth
    By 2080, excess cost growth is responsible for 56 per-      4

    cent of the total projected growth in federal spending      2
    on the health care programs and Social Security, and        0
    the share attributable to aging falls to 44 percent. The     2010      2015      2020        2025          2030   2035
    impact of excess cost growth is felt only in the health
    care programs; rising health care costs have no direct     Source: Congressional Budget Office.


                                                                                                                                CBO
12   THE LONG-TERM BUDGET OUTLOOK


      outlays) and which will equal 0.4 percent of GDP in                    its 10-year baseline projections, CBO projects that inter-
      2010—are projected to increase at the same rate as gross               est spending will increase again—to 2.0 percent of GDP
      Medicare outlays.12 When those offsetting receipts rise,               in 2013 and 3.1 percent in 2020—as federal debt grows
      total spending falls. Second, the refundable portions of               and interest rates rebound from their recent unusually
      the earned income tax credit and the child tax credit,                 low levels.
      which the budget records as outlays, were modeled along
      with revenues. Such refunds are projected to decrease                  For the long-term budget projections, CBO assumed that
      over time as incomes rise. Because of the projected                    interest rates would remain stable after 2020, meaning
      changes in those two components, other primary spend-                  that interest outlays would grow at the same pace as fed-
      ing is projected to decline to 7.8 percent of GDP by                   eral debt. Under the extended-baseline scenario, annual
      2035. For comparison, over the past 40 years, such                     interest spending would approach 4 percent of GDP by
      spending has never fallen below 8.3 percent of GDP.                    2035 and then grow slowly, reaching 5 percent in 2080.
                                                                             Under the alternative fiscal scenario, interest spending
      Other Noninterest Spending Under the Alternative Fiscal                would grow much faster—from 4 percent of GDP in
      Scenario. In the alternative fiscal scenario, spending for             2020 to almost 9 percent by 2035 and much more in
      most programs other than the major mandatory health                    later years—because of widening deficits and ballooning
      care programs and Social Security is assumed to match                  debt. As discussed later in this chapter, higher federal
      CBO’s baseline projections for the next few years                      debt would in fact lead to higher interest rates, making
      (12.5 percent of GDP in 2010, 12.4 percent in 2011,                    interest outlays even larger, particularly under the alterna-
      and 10.9 percent in 2012). For subsequent years, CBO’s                 tive fiscal scenario.
      starting point was to assume that such spending would
      remain at this year’s levels relative to GDP rather than
      declining to the 2020 levels relative to GDP projected in              The Long-Term Outlook for Revenues
      the baseline. However, in extrapolating this year’s levels,            Federal revenues have fluctuated between 15 percent and
      CBO removed the budgetary effect of unusual, short-                    21 percent of GDP over the past 40 years, averaging
      term policies related to current economic conditions.                  about 18 percent. Just as spending priorities have
      With those policies (and offsetting receipts related to                changed during that period, the composition of revenues
      Medicare) excluded, primary spending on programs other                 has shifted. Receipts from payroll taxes have grown faster
      than the major mandatory health care programs and                      than GDP, producing a larger share of total revenue.13 At
      Social Security will equal 10.5 percent of GDP in 2010,                the same time, the shares of revenue contributed by cor-
      CBO estimates. Under the alternative fiscal scenario, that             porate income taxes and excise taxes have shrunk.
      percentage would continue from 2013 through the end
      of the long-term projection period.                                    After totaling nearly 18 percent of GDP in 2008, federal
                                                                             revenues fell sharply the following year, to about 15 per-
      Net of offsetting receipts from Medicare and outlays on                cent of GDP, because of the recession and the tax cuts
      refundable tax credits, other noninterest spending is pro-             enacted in response to it. CBO expects revenues to
      jected to equal 10.2 percent of GDP in 2013. Thereafter,               remain near 15 percent of GDP this year. However,
      because of increases in offsetting receipts and decreases in           under the current-law assumptions of CBO’s baseline,
      tax credit refunds, the net amount is projected to decline             revenues would rebound over the next decade with
      to 9.3 percent of GDP by 2035.                                         improvement in the economy, the scheduled expiration
                                                                             of tax cuts enacted in 2001 and 2003, and sharp growth
      Interest Spending. For much of the past decade, federal                in the number of taxpayers subject to the alternative min-
      debt was relatively constant as a share of GDP, but federal            imum tax. As a result, revenues would equal 19 percent of
      interest spending declined (from 2.3 percent of GDP in                 GDP in 2012 and close to 21 percent in 2020.
      2000 to 1.3 percent in 2009) because interest rates fell. In
                                                                             13. The bulk of payroll tax revenue comes from taxes designated for
      12. In Congressional Budget Office, The Long-Term Budget Outlook           Social Security and Medicare; smaller amounts come from unem-
          (June 2009), those offsetting receipts were netted against Medi-       ployment insurance taxes and contributions to federal retirement
          care spending rather than against other spending.                      programs.


CBO
CHAPTER ONE                                                                                         THE LONG-TERM BUDGET OUTLOOK        13


Under the extended-baseline scenario, revenues would           shortfalls accumulate over time, whereas the “fiscal gap”
continue to rise gradually thereafter, reaching 23 percent     summarizes the shortfall over a given period in a single
of GDP by 2035. That increase would occur largely              value. Both measures show that projected revenues are
because, under current law, real growth in income would        insufficient to support projected spending—with a fairly
push people into higher tax brackets over time and infla-      modest divergence under the extended-baseline scenario
tion-related increases in income would make more               and a very large one under the alternative fiscal scenario.
income subject to the AMT. As a result of those factors,       Looking at how the fiscal gap changes over time demon-
the effective marginal tax rate on labor income would rise     strates the effect of delaying action to address the budget-
from 29 percent today to about 38 percent in 2035. Rev-        ary imbalance.
enues would also increase relative to GDP throughout the
projection period because the recently enacted excise tax      The Accumulation of Federal Debt
on certain high-premium health insurance plans would           For a combination of federal spending and revenues to be
affect a growing share of plans over time. All told, average   sustainable over time, the resulting debt must eventually
tax rates (taxes as a share of income) would rise consider-    grow no faster than the economy. The most meaningful
ably, and people at various points in the income scale         measure of federal debt for such projections is debt held
would pay a very different percentage of their income          by the public, which represents the amount that the gov-
in taxes than people at the same points do today.              ernment is borrowing in the financial markets (by issuing
                                                               Treasury securities) to pay for federal operations and
For the alternative fiscal scenario, by contrast, CBO          activities. That borrowing competes with other partici-
assumed that current tax law would be changed over time        pants in the credit markets for financial resources and can
to continue certain policies to which people have grown        crowd out private investment.14
accustomed and to keep revenues as a percentage of GDP
more consistent with past patterns. Specifically, CBO          A useful barometer of fiscal policy is the amount of gov-
assumed that through 2020, most of the tax cuts enacted        ernment debt held by the public relative to annual eco-
in 2001 and 2003 would continue (except rate reductions        nomic output. Such debt stood at 40 percent of GDP at
applying to high-income taxpayers), relief from the AMT        the end of 2008, a little above the 40-year average of
would continue, and the estate tax would be extended           36 percent. Since then, large deficits have caused debt
with the rates and exemption amounts (adjusted for infla-      held by the public to increase sharply—to 53 percent of
tion) in effect in 2009. (If those changes to current law      GDP at the end of 2009 and, CBO projects, to 62 per-
were made, they would receive special treatment under          cent by the end of this year. Debt has exceeded 50 percent
the Statutory Pay-As-You-Go Act of 2010, as explained in       of GDP during only one other period in U.S. history:
Box 1-1 on page 4.) Beyond 2020, CBO assumed that              between 1942 and 1956, when it spiked (peaking at
tax law would evolve to keep total revenues at the same        109 percent of GDP) because of a surge in federal
share of GDP as in 2020. Under those assumptions, reve-        spending during World War II.
nues would increase to just over 19 percent of GDP in
2020 (rather than the almost 21 percent under the              Under the assumptions of CBO’s extended-baseline sce-
extended-baseline scenario) and would remain at that           nario, annual budget deficits would decline to 2.3 per-
level in later years. Thus, revenues projected under the       cent of GDP by 2014. After that, both deficits and debt
alternative fiscal scenario are lower than those estimated     would remain stable relative to GDP for several years. But
under the extended-baseline scenario by more than 1 per-       then growth in spending on the major mandatory health
cent of GDP in 2020 and by about 4 percent in 2035.            care programs, Social Security, and interest payments
(Details of CBO’s long-term revenue projections are            would cause deficits to increase, and debt would once
presented in Chapter 4.)                                       again grow faster than the economy. By 2035, it would
                                                               equal 79 percent of GDP (see Figure 1-2).

The Size of the Fiscal Imbalance                               14. In contrast, debt held by trust funds and other government
How large is the long-term budgetary shortfall facing the          accounts—which, together with debt held by the public, make up
U.S. government? Two measures offer complementary                  gross federal debt—represents internal transactions of the govern-
perspectives: Annual amounts of federal debt show how              ment and thus has no effect on credit markets.


                                                                                                                                        CBO
14   THE LONG-TERM BUDGET OUTLOOK


      Figure 1-2.
      Federal Debt Held by the Public Under CBO’s Long-Term Budget Scenarios
      (Percentage of gross domestic product)
      200
                                       Actual Projected
      175

      150

      125                                                                        Alternative Fiscal Scenario

      100

       75
                                                                                                   Extended-Baseline Scenario
       50

       25

         0
          2000               2005               2010               2015               2020               2025               2030               2035

      Source: Congressional Budget Office.
      Note: The extended-baseline scenario adheres closely to current law, following CBO’s 10-year baseline budget projections through 2020
            (with adjustments for the recently enacted health care legislation) and then extending the baseline concept for the rest of the long-
            term projection period. The alternative fiscal scenario incorporates several changes to current law that are widely expected to occur or
            that would modify some provisions that might be difficult to sustain for a long period. (For details, see Table 1-1 on page 3.)

      Under the alternative fiscal scenario, deficits would also               (23.3 percent of GDP in 2035, compared with 19.3 per-
      decline for a few years after 2010 and then grow again,                  cent under the alternative fiscal scenario), and noninterest
      but at a much faster rate. By 2020, debt would approach                  spending for things other than the major mandatory
      90 percent of GDP. After that, the growing imbalance                     health programs and Social Security would reach the
      between revenues and noninterest spending, combined                      lowest levels relative to output since before World War II
      with the spiraling cost of interest payments, would swiftly              (7.8 percent of GDP in 2035, compared with 9.3 percent
      push debt to unsustainable levels. Debt would surpass its                under the alternative fiscal scenario). With the changes
      historical peak of 109 percent of GDP by 2025 and                        assumed in the extended-baseline scenario, the sharp
      would exceed 200 percent of GDP in 2037.                                 increase in outlays projected for the major health care
                                                                               programs and Social Security could be accommodated
      The federal government could not issue ever-larger                       with a fairly small increase in debt relative to the size of
      amounts of debt relative to the size of the economy indef-               the economy.
      initely. If debt continued to rise rapidly relative to GDP,
      investors at some point would begin to doubt the govern-                 Many budget analysts believe that the alternative fiscal
      ment’s willingness to pay interest on that debt. Therefore,              scenario presents a more realistic picture of the nation’s
      under the alternative fiscal scenario, the government                    underlying fiscal policy than the extended-baseline sce-
      would eventually need to cut spending well below the                     nario does—because, for example, it does not allow the
      levels projected under that scenario or increase taxes well              impact of the AMT to expand substantially. The explo-
      above their average historical percentage of GDP to put                  sive path of federal debt under the alternative fiscal
      the federal budget on a sustainable path.                                scenario underscores the need for large and rapid policy
                                                                               changes to put the nation on a sustainable fiscal course.
      Debt would rise much more slowly relative to GDP
      under the extended-baseline scenario because current law                 The Fiscal Gap
      would lead to both of those sorts of adjustments. In that                How much would policies have to change to avoid unsus-
      scenario, revenues would reach historically high levels                  tainable increases in government debt? A useful answer


CBO
CHAPTER ONE                                                                                                    THE LONG-TERM BUDGET OUTLOOK         15


Table 1-3.
The Federal Fiscal Gap Under CBO’s Long-Term Budget Scenarios
(Percentage of gross domestic product)
                                                Present Value of the Future Stream of
                                                Revenues or Outlays over a Given Period                                  Fiscal Gap
Projection Period                             Revenues                          Outlays                           (Outlays minus revenues)
                                                                         Extended-Baseline Scenario
25 Years (2010 to 2034)                           22.7                                 23.9                                    1.2
50 Years (2010 to 2059)                           23.7                                 24.5                                    0.8
75 Years (2010 to 2084)                           25.0                                 25.7                                    0.7

                                                                          Alternative Fiscal Scenario
25 Years (2010 to 2034)                           20.7                                 25.5                                    4.8
50 Years (2010 to 2059)                           19.8                                 26.7                                    6.9
75 Years (2010 to 2084)                           19.5                                 28.2                                    8.7

Source: Congressional Budget Office.
Notes: The fiscal gap is a measure of federal shortfalls over a given period. It represents the extent to which the government would need to
       immediately and permanently either raise tax revenues or cut spending—or do both, to some degree—to make the government’s
       debt the same size (relative to gross domestic product, or GDP) at the end of the period that it was at the beginning of 2010.
       To allow for the increase in the nominal value of federal debt that would occur even if that debt was maintained at its current share of
       GDP outlays include current debt, and revenues include the present value of the target end-of-period debt. (The end-of-period debt is
           ,
       equal to GDP in the last year of the period multiplied by the ratio of debt to GDP at the beginning of 2010. A present value is a single
       number that describes a flow of future revenues or outlays in terms of an equivalent lump sum received or spent today.)
       The extended-baseline scenario adheres closely to current law, following CBO’s 10-year baseline budget projections through 2020
       (with adjustments for the recently enacted health care legislation) and then extending the baseline concept for the rest of the long-
       term projection period. The alternative fiscal scenario incorporates several changes to current law that are widely expected to occur or
       that modify some current provisions that might be difficult to sustain for a long period. (For details, see Table 1-1 on page 3.)

comes from looking at the fiscal gap, which measures the                  quarter century. If the change came entirely from reve-
immediate change in spending or revenues that would be                    nues, it would amount to roughly a one-quarter increase
necessary to keep the debt-to-GDP ratio the same at the                   in revenues relative to the amount projected for 2020 and
end of a given period as at the beginning of the period.                  later years. If the change came entirely from spending, it
The fiscal gap is conceptually similar to the actuarial                   would represent a cut of roughly one-fifth in primary
imbalance for Social Security (see Table 3-1 in                           spending from the amount projected for 2020 and a cut
Chapter 3). Both measures quantify a long-term shortfall                  of one-sixth from the amount projected for 2035.
in present-value terms—that is, as a single number that
describes a flow of future revenues or outlays in terms of
an equivalent lump sum received or spent today—and
both can be expressed as a share of GDP.15                                15. The fiscal gap equals the present value of revenues over a given
                                                                              period minus the present value of outlays over that period,
                                                                              adjusted to keep federal debt at its current percentage of GDP.
The fiscal gap over the next 25 years would amount to
                                                                              Specifically, current debt is added to the outlay measure, and the
1.2 percent of GDP under the extended-baseline scenario                       present value of the target end-of-period debt (which equals GDP
or 4.8 percent under the alternative fiscal scenario (see                     in the last year of the period multiplied by the ratio of debt to
Table 1-3). In other words, relative to the projections of                    GDP at the beginning of 2010) is added to the revenue measure.
the alternative fiscal scenario, an immediate and perma-                      The present value of a stream of future revenues is computed by
                                                                              taking the revenues for each year, discounting each value to 2010
nent reduction in spending or increase in revenues equal                      dollars, and summing the resulting series. The same method is
to 4.8 percent of GDP—the equivalent of almost                                applied to the projected stream of outlays. CBO used a real dis-
$700 billion in this year’s federal budget—would be                           count rate equal to the effective interest rate on debt held by the
needed to create a sustainable fiscal path for the next                       public, which was assumed to be 2.7 percent in the long term.


                                                                                                                                                    CBO
16   THE LONG-TERM BUDGET OUTLOOK


      Figure 1-3.                                                              The Effect of Delaying Action on the
                                                                               Fiscal Imbalance
      Reductions in Primary Spending or                                        Waiting to close the fiscal gap would make the necessary
      Increases in Revenues in Various Years                                   changes larger. To illustrate the costs of delay, CBO simu-
      Needed to Close the 25-Year Fiscal Gap                                   lated the effects of closing the fiscal gap under the alterna-
      Under CBO’s Alternative Fiscal                                           tive fiscal scenario beginning in 2011, 2015, 2020, or
                                                                               2025. Those simulations indicate that postponing action
      Scenario                                                                 would substantially increase the size of the policy adjust-
      (Percentage of gross domestic product)                                   ments needed to put the budget on a sustainable course.
      14
                                                                               For example, if lawmakers wanted to close the fiscal gap
                                                                 12.3          through 2035 but did not begin until 2015, they would
      12                                                                       have to reduce primary spending or increase revenues
      10                                                                       over that period by 5.7 percent of GDP, rather than by
                                                 7.9
                                                                               4.8 percent if they acted in 2011 (see Figure 1-3). If they
       8                                                                       waited until 2020 to close the fiscal gap through 2035,
       6                         5.7                                           they would have to cut noninterest outlays or raise reve-
                 4.8
                                                                               nues over that period by 7.9 percent of GDP. Moreover,
       4                                                                       those simulations omit the effects that deficits and debt
       2                                                                       would have on economic growth and interest rates in the
                                                                               intervening years; incorporating such effects would make
       0
                                                                               the impact of delaying policy changes even more severe.
              Actions         Actions          Actions         Actions
              Begin in        Begin in         Begin in        Begin in
               2011            2015             2020            2025
                                                                               Another perspective on the effects of delay comes from
                                                                               the so-called sustainable spending level—the fixed
      Source: Congressional Budget Office.
                                                                               amount of outlays (measured as a share of GDP) that
      Notes: Primary spending refers to all spending other than interest       could be supported by a projected stream of revenues. To
             payments on federal debt.                                         eliminate the fiscal gap through 2035 under the alterna-
             The fiscal gap is a measure of federal shortfalls over a given    tive fiscal scenario, primary outlays could be reduced to
             period. It represents the extent to which the government          17.3 percent of GDP in 2015 and later. If no changes
             would need to immediately and permanently either raise tax        were made until 2020, primary outlays would have to fall
             revenues or cut spending—or do both, to some degree—to
                                                                               permanently to 15.9 percent of GDP, and if action was
             make the government’s debt the same size (relative to gross
                                                                               delayed until 2025, the projected revenue stream would
             domestic product) at the end of the period that it was at the
                                                                               only support primary outlays of 12.1 percent of GDP
             beginning of 2010.
                                                                               (see Figure 1-4). By comparison, primary outlays are
             The alternative fiscal scenario incorporates several changes
                                                                               expected to equal 23.0 percent of GDP this year.
             to current law that are widely expected to occur or that
             would modify some provisions that might be difficult to sus-
             tain for a long period. (For details, see Table 1-1 on page 3.)   Uncertainty of Long-Term
      Over 75 years, the fiscal gap would amount to only                       Budget Projections
      0.7 percent of GDP under the extended-baseline scenario                  Future budgetary outcomes will depend in large part on
      because revenues would be approximately the same as pri-                 future policies—as evidenced by the difference between
                                                                               the debt paths of the two scenarios analyzed in this
      mary spending in the long term (though both would be
                                                                               report. But outcomes will also depend on factors outside
      much greater relative to GDP than in the past). Under
                                                                               the direct control of policymakers, such as the state of the
      the alternative fiscal scenario, deficits would grow every               economy and demographic trends. For example, if long-
      year, so the fiscal gap would be larger over longer periods.             term economic growth is slower than projected, deficits
      Creating a sustainable fiscal path for the next 75 years                 will be greater for any given set of policies. Conversely, if
      under that scenario would require immediate and perma-                   fertility rates are higher than assumed or improvements in
      nent policy changes equal to 8.7 percent of GDP.                         mortality are smaller, the population will be younger than


CBO
CHAPTER ONE                                                                                                     THE LONG-TERM BUDGET OUTLOOK       17


Figure 1-4.
Various Paths for Primary Spending That Would Close the 25-Year Fiscal Gap
Under CBO’s Alternative Fiscal Scenario
(Percentage of gross domestic product)
25


20

            Cuts Begin in 2011
                                        Cuts Begin in 2015
15                                                              Cuts Begin in 2020


10                                                                                                        Cuts Begin in 2025


 5


 0
  2010                           2015                        2020                       2025                        2030
Source: Congressional Budget Office.
Notes: Primary spending refers to all spending other than interest payments on federal debt.
         Closing the 25-year fiscal gap would make federal debt the same size (relative to gross domestic product, or GDP) at the end of the
         period that it was at the beginning. This analysis uses the fiscal gap and revenue projections in CBO’s alternative fiscal scenario and
         then calculates the amount of primary spending that would close the fiscal gap if spending was held constant as a share of GDP going
         forward from various points in time.
         The alternative fiscal scenario incorporates several changes to current law that are widely expected to occur or that would modify
         some provisions that might be difficult to sustain for a long period. (For details, see Table 1-1 on page 3.)

projected, and spending on Social Security and Medicare                    debt would still grow to more than 150 percent of GDP
will be lower as a percentage of GDP for any given set                     in 2035 under the alternative fiscal scenario.) And even
of policies. (Values for the major demographic and eco-                    if revenues increase significantly relative to GDP in the
nomic variables that underpin CBO’s long-term projec-                      future—as under the extended-baseline scenario—debt is
tions are described in Appendix B.)                                        likely to remain at levels that are extremely high by past
                                                                           standards. Indeed, debt is already at historically high lev-
The government’s future mandatory spending will also                       els, and federal interest costs are likely to grow substan-
depend crucially on future health care costs. The rate at                  tially when interest rates return to more normal levels.
which health care costs have grown has varied greatly in
the past. For an analysis of how altering CBO’s assump-
tions about such cost growth would affect projected                        The Economic Impact of Rising
health care spending, see Chapter 2.                                       Federal Debt
                                                                           The economic effects of growth in federal debt depend
Although the size of future budgetary shortfalls is uncer-                 partly on the economic conditions that prevail when defi-
tain, if revenues remain at past levels relative to GDP—as                 cits are incurred. When the long-term outlook for the
under the alternative fiscal scenario—federal debt is likely               budget appears sustainable, running deficits for a limited
to keep growing rapidly under any plausible assumptions                    time is not necessarily detrimental to the economy.
about future trends in the economy, demographics, and                      Indeed, when the economy has substantial unemploy-
health care costs. (For instance, if the rate of productivity              ment and unused factories, offices, and equipment, run-
growth was 50 percent higher than assumed in this                          ning deficits generally increases output and employment
report, or about equal to the rate seen during the 1960s,                  relative to what would occur with a balanced budget. For


                                                                                                                                                   CBO
18   THE LONG-TERM BUDGET OUTLOOK


      instance, the larger deficits that result from automatic                  Whatever policies lawmakers chose to tackle the fiscal
      declines in tax revenues or increases in government                       imbalance, taking those actions earlier would lead to
      spending (such as for unemployment benefits) during                       higher output in the long run, enhance the well-being of
      and immediately after a recession help reduce the severity                future generations, and reduce the risk of a fiscal crisis. At
      of the downturn by offsetting some of the decline in dis-                 the same time, however, early action could make current
      posable income and thus supporting demand for goods                       generations worse off than if action was deferred.
      and services.16 Similarly, policymakers’ actions to go
      beyond such “automatic stabilizers” by reducing taxes and                 Crowding Out of Capital and Related
      increasing spending further during a period of economic
                                                                                Economic Effects
      weakness can also lessen the severity of the downturn. As
                                                                                Increased government borrowing tends to crowd out pri-
      an example, CBO estimated that the spending increases
                                                                                vate investment in productive capital, leading to a smaller
      and tax cuts enacted in the American Recovery and
      Reinvestment Act of 2009 (P.L. 111-5) boosted output                      capital stock and lower output in the long run than
      and employment significantly during the past year com-                    would otherwise be the case. Deficits tend to have that
      pared with what would have happened in the absence of                     effect on private investment because the portion of
      that legislation.17 Thus, the federal government’s ability                people’s savings used to buy government bonds is not
      to run budget deficits enables fiscal policy to offset some               available to pay for such investment.
      of the negative effects of recessions.
                                                                                An exception is that government borrowing to finance
      Even temporary deficits, however, produce increases in                    public investment, such as improvements in infrastruc-
      debt that have harmful consequences in the long run                       ture, need not reduce future output if the public invest-
      (assuming the government does not run budget surpluses                    ment is as productive as private investment. However, the
      later to retire the additional debt). Moreover, economic                  long-term rise in debt projected by CBO is driven by
      fluctuations resulting from business cycles are not the                   increases in government transfer payments (such as
      fundamental source of the long-term budgetary pressures                   spending on entitlement programs) rather than increases
      facing the nation. Instead, outlays are projected to rise
                                                                                in government investment.
      above the amount that can be funded from current rates
      of taxation because of increases in Social Security spend-                Other factors can offset some of that crowding-out effect.
      ing and, more important, continuing growth in federal
                                                                                Greater government borrowing tends to lead to greater
      spending on health care programs as a share of GDP (see
                                                                                private saving, which increases the funds available both to
      Box 1-2 on page 10). If those developments are not pre-
                                                                                purchase government debt and to finance private invest-
      vented or offset through changes elsewhere in the budget,
      the resulting increase in deficits will hurt the economy                  ment. Government borrowing generally boosts private
      through several channels, as described below.                             saving for several reasons:

      At the same time, steps taken to address the looming                      B   Crowding out usually leads to higher interest rates,
      deficits could also have negative consequences. Raising                       which raise the return on saving;
      revenues significantly relative to GDP (as under the
      extended-baseline scenario) would harm the economy                        B   Some people save more because they anticipate that
      through the impact on people’s decisions about how                            taxes will be raised, or spending cut, in the future to
      much to work and save. The size of that impact, and                           cover the cost of paying interest on the accumulated
      its implications for individuals, would depend crucially                      debt; and
      on the specific tax policies involved. Cutting federal
      spending could also have negative effects on individuals,                 B   The policies that give rise to deficits (such as tax cuts
      businesses, and the economy.                                                  or increased government transfer payments) put more
                                                                                    money in private hands, some of which is probably
      16. See Congressional Budget Office, The Effects of Automatic Stabiliz-       saved.
          ers on the Federal Budget.
      17. See Congressional Budget Office, Estimated Impact of the Ameri-
                                                                                Overall, however, the offsetting rise in private saving is
          can Recovery and Reinvestment Act on Employment and Economic          generally smaller than the change in the deficit, so greater
          Output from January 2010 Through March 2010 (May 2010).               government borrowing leads to lower national saving.

CBO
CHAPTER ONE                                                                                                  THE LONG-TERM BUDGET OUTLOOK          19


Lower national saving means that the nation as a whole is              Under the extended-baseline scenario, crowding-out
setting aside fewer resources for the future, which results            effects would be more modest. Real GDP per capita
in lower income in the long run than would otherwise                   would be slightly lower, and debt as a percentage of GDP
occur. That reduction in saving leads to lower domestic                slightly higher, than under stable economic conditions
investment. At the same time, however, higher interest                 (see Figure 1-6). However, those projections of GDP and
rates attract more foreign capital to the United States and            debt do not incorporate the negative impact that the
induce U.S. savers to keep more of their money at home.                higher tax rates in effect under that scenario would have
Such net inflows of capital prevent U.S. investment from
                                                                       on incentives to work and save.
declining as much as national saving does. But those
capital inflows also create the obligation for more profits            In the second case, CBO analyzed the effects of rising
and interest to flow overseas in the future. Therefore,
                                                                       debt using a model of the economy that assumes that
although flows of capital into the United States can help
                                                                       people make decisions about how much to work and save
maintain domestic investment, the gains from that addi-
                                                                       on the basis of current and anticipated government poli-
tional investment do not fully accrue to U.S. residents.
                                                                       cies and economic conditions (such as wages and interest
CBO has analyzed the economic effects of rising federal                rates). In that analysis, CBO compared economic out-
debt under two sets of assumptions. Those analyses go                  comes under a policy that would stabilize the ratio of
beyond the long-term budget projections, which assume                  debt to GDP earlier with outcomes under a policy that
a stable economy unaffected by deficits in the long run.               would allow that ratio to grow for another 10 years before
                                                                       being stabilized. The underlying budgetary assumptions
In the first case, CBO assessed the impact on the econ-                used in the analysis follow those of the alternative fiscal
omy if private saving were to respond to changes in                    scenario (adapted for that particular model) until policy
deficits according to a simple rule that reflects how                  is changed to stabilize the debt-to-GDP ratio.19 In princi-
such saving has behaved in the past. Specifically, CBO                 ple, that ratio could be stabilized through any number of
assumed that for each $1 increase in the deficit, con-
                                                                       government policies. CBO analyzed two possible policies:
sumption would fall—and therefore, other things being
                                                                       one in which marginal tax rates were increased, and one
equal, saving would rise—by 40 cents. Because that
assumption is based on past outcomes, it serves as a useful            in which government transfer payments (which were
rule of thumb in situations that are within the range of               assumed to go mainly to older people) were reduced.
experience. However, when projected interest rates and
the debt-to-GDP ratio rise to levels rarely seen before,               CBO’s analysis suggested that delaying action for
that rule of thumb may no longer be relevant.                          10 years—and thus allowing the debt-to-GDP ratio to
                                                                       rise by an additional 30 percentage points under the
CBO estimated that with that rule of thumb applied, real               assumptions of the analysis—would result in output’s
GDP per capita in 2027 under the alternative fiscal sce-               being about 2 percent to 4 percent lower in the long run
nario would be about 17 percent lower than it would be                 than it would be if the ratio was stabilized earlier at lower
under the stable economic conditions assumed for the                   levels, depending on the policy used to stabilize the debt.
long-term budget projections (see Figure 1-5).18 That                  (Despite those reductions, output would continue to be
reduction would occur because of the crowding out of                   higher than current levels because of productivity
investment. Incorporating the lower output and higher                  growth.) Most of the reduction in output would stem
interest rates implied by crowding out would accelerate                from two factors: the crowding out of investment in pro-
the projected growth of debt as a percentage of GDP                    ductive capital, which would cause the capital stock to be
under that scenario. Even with crowding-out effects taken
                                                                       6 percent to 10 percent smaller if action was delayed,
into account, however, GDP per capita would be consid-
erably higher in 2027 than it is now because of continued
                                                                       19. The economic model used for this comparison is capable of esti-
growth in productivity.
                                                                           mating outcomes only under sustainable government policies.
                                                                           Therefore, the analysis had to involve stabilizing the debt-to-GDP
18. Results could not be estimated beyond 2027 under the alternative       ratio at some point rather than allowing it to increase indefinitely.
    fiscal scenario because the implications of the simple crowding-       For more details of the analysis, see Congressional Budget Office,
    out assumption used in this analysis are not realistic under the       Economic Impacts of Waiting to Resolve the Long-Term Budget
    debt levels that occur in later years.                                 Imbalance (forthcoming).


                                                                                                                                                   CBO
20   THE LONG-TERM BUDGET OUTLOOK


      Figure 1-5.
      Real GDP per Capita Under Stable Economic Conditions or with
      Crowding-Out Effects
      (2010 dollars)
      70,000
                                                                                                      Stable Economic
                                                                                                         Conditions

      60,000
                                                                                                                      Extended-Baseline Scenario
                                                                                                                       with Crowding-Out Effects

      50,000                                               Alternative Fiscal Scenario
                                                                                      a
                                                           with Crowding-Out Effects


      40,000


            0
             2010                        2015                       2020                      2025                       2030                      2035

      Source: Congressional Budget Office.
      Notes: “Crowding out” refers to the fact that government borrowing (to finance deficits) tends to crowd out private investment in productive
             capital, leading to a smaller capital stock and lower output in the long run than would otherwise occur. The stable economic conditions
             that CBO used in making its long-term budget projections under both scenarios included assumptions—after 2020—of a constant real
             (inflation-adjusted) interest rate on federal debt and steady growth rates for real wages and output.
                The extended-baseline scenario adheres closely to current law, following CBO’s 10-year baseline budget projections through 2020
                (with adjustments for the recently enacted health care legislation) and then extending the baseline concept for the rest of the long-
                term projection period. The alternative fiscal scenario incorporates several changes to current law that are widely expected to occur or
                that would modify some provisions that might be difficult to sustain for a long period. (For details, see Table 1-1 on page 3.)
                GDP = gross domestic product.
      a. Results could not be estimated beyond 2027 for the alternative fiscal scenario with crowding-out effects because the simple crowding-out
         assumption used in this analysis does not yield realistic results in later years under that scenario.

      and the effects of higher marginal tax rates on incentives                   all future generations by amounts equivalent to a cut of
      to work and save (in the case of the policy involving                        roughly 1 percent to 2 percent of their lifetime consump-
      higher taxes).                                                               tion, again depending on the specific policies adopted.

      Another conclusion of CBO’s analysis was that genera-                        Other Consequences of Rising Federal Debt
      tions born after about 2015 would be worse off if action                     Besides the outcomes described above, which would
      to stabilize the debt-to-GDP ratio was delayed from 2015                     unfold incrementally over time, higher debt could raise
      to 2025. People born before 1990, however, would be                          the probability of a fiscal crisis in which investors would
      better off if action was delayed, largely because they                       lose confidence in the government’s willingness to fully
      would partly or wholly avoid the policy changes needed                       honor its obligations, and thus, the government would be
      to stabilize the debt (leaving aside the negative effects of a               forced to pay much more for debt financing.20 Interest
      possible fiscal crisis or of reduced flexibility for the gov-                rates might rise only gradually to reflect growing uncer-
      ernment to respond to economic challenges, as described                      tainty about whether government debt would be fully
      below). Finally, generations born between 1990 and 2015                      honored, but other countries’ experiences suggest that a
      could either gain or lose from a delay depending on the                      loss of investor confidence could occur abruptly instead.
      details of the policy used to stabilize the debt (again
      leaving aside some other effects of growing debt). In the                    20. See Congressional Budget Office, Federal Debt and the Risk of a
      long run, a 10-year delay would reduce the well-being of                         Fiscal Crisis (forthcoming).


CBO
CHAPTER ONE                                                                                                   THE LONG-TERM BUDGET OUTLOOK        21


Figure 1-6.
Federal Debt Held by the Public With and Without Crowding-Out Effects
(Percentage of gross domestic product)
200

180

                                                       Alternative Fiscal Scenario                   Alternative
160
                                                       with Crowding-Out Effectsa                  Fiscal Scenario
140

120
                                                                                                           Extended-Baseline Scenario
100                                                                                                         with Crowding-Out Effects

 80
                                                                                                           Extended-Baseline Scenario
 60


  0
   2010                       2015                       2020                       2025                       2030                       2035

Source: Congressional Budget Office.
Notes: “Crowding out” refers to the fact that government borrowing (to finance deficits) tends to crowd out private investment in productive
       capital, leading to a smaller capital stock and lower output in the long run than would otherwise occur. The stable economic conditions
       that CBO used in making its long-term budget projections under both scenarios included assumptions—after 2020—of a constant real
       (inflation-adjusted) interest rate on federal debt and steady growth rates for real wages and output.
       The extended-baseline scenario adheres closely to current law, following CBO’s 10-year baseline budget projections through 2020
       (with adjustments for the recently enacted health care legislation) and then extending the baseline concept for the rest of the long-
       term projection period. The alternative fiscal scenario incorporates several changes to current law that are widely expected to occur or
       that would modify some provisions that might be difficult to sustain for a long period. (For details, see Table 1-1 on page 3.)
a. Results could not be estimated beyond 2027 for the alternative fiscal scenario with crowding-out effects because the simple crowding-out
   assumption used in this analysis does not yield realistic results in later years under that scenario.

If interest rates on government debt spiked, the value of                 to fund its other commitments. Greater debt in the
outstanding government debt would fall sharply. That                      future would increase the risk that investors would be
decline in value could precipitate a broader financial crisis             unwilling to finance all of the outlays or revenue reduc-
by causing large losses for mutual funds, pension funds,                  tions needed to deal with unforeseen events unless they
insurance companies, banks, and other holders of federal                  were compensated with very high interest rates. Instead,
debt. Experience in other countries suggests that resolv-                 to reassure investors concerned about a widening deficit
ing such a crisis would require fiscal policy changes that                during a recession, policymakers might be forced to raise
would be far more drastic and painful than if policies had
                                                                          taxes or reduce spending suddenly, probably exacerbating
been adjusted sooner to avoid a crisis.
                                                                          already weak economic conditions.
Higher debt would also reduce policymakers’ ability to
                                                                          Even in the absence of a crisis, the longer that debt kept
respond to unexpected challenges, such as economic
downturns or international crises. Lower amounts of                       growing, the more significant would be the policy
debt, by contrast, give the government the ability to bor-                changes needed to control it, which could further
row to meet sudden needs. If federal debt had been larger                 increase the burden of fiscal tightening on future genera-
in 2008 than it was, the government might have had less                   tions. Large and abrupt changes in fiscal policy, such as
flexibility to respond to the financial turmoil and slump-                cuts in government transfer payments, would be more
ing economy by using money to stimulate economic                          difficult for people to adjust to than smaller and more
activity and stabilize the financial sector while continuing              gradual changes. In addition, larger increases in tax rates


                                                                                                                                                  CBO
22   THE LONG-TERM BUDGET OUTLOOK


      would lead to greater losses in economic efficiency by              insurance plans, thus resulting in a larger share of com-
      reducing incentives for work and saving.                            pensation taking the form of taxable wages. Combining
                                                                          all of the direct and indirect effects, CBO projects that
                                                                          the new excise tax will increase revenues as a share of
      Changes in CBO’s Long-Term                                          GDP by just over half a percentage point in 2035 and
      Projections Since June 2009                                         by more than 3 percentage points in 2080.
      The long-term paths for primary spending presented in
      this report are similar to the ones that CBO published              Federal debt is slightly higher in the next few decades
      last year, but the paths for revenues differ.21 In the              under the extended-baseline scenario than was projected
      extended-baseline scenario, the recent enactment of                 in 2009 (see the bottom panel of Figure 1-7). In later
      major health care legislation has increased projected reve-         decades, however, debt is substantially lower because of
      nues, particularly in the 2030s and beyond, thus slowing            the higher projected growth in revenues. In the 2009 pro-
      the accumulation of debt considerably. In the alternative           jection, revenues grew more slowly than outlays, and debt
      fiscal scenario, the health care legislation and changes in         rose rapidly after 2030, reaching 200 percent of GDP in
      CBO’s assumptions have pushed up projected revenues in              2067. In the current projection, revenues and outlays
      the next few decades but lowered them thereafter. As in             follow similar paths throughout the long-term projection
      last year’s projection for that scenario, debt accumulates          period. As a result, debt grows much less—from its cur-
      very rapidly.                                                       rent level of about 60 percent of GDP to 75 percent by
                                                                          2032 and exceeding 100 percent by 2080.
      Changes in Projections Under the
      Extended-Baseline Scenario                                          Changes in Projections Under the
      Compared with the previous long-term outlook, CBO’s                 Alternative Fiscal Scenario
      current projections for primary spending under the                  The differences between CBO’s current and previous pro-
      extended-baseline scenario are slightly higher before 2020          jections of primary spending under the alternative fiscal
      and are a little lower after 2030 (see the top panel of             scenario are very small. On average, outlays are 0.1 per-
      Figure 1-7). The longer-run difference arises almost                cent of GDP lower over the projection period (see the
      entirely because CBO has reduced its projection of                  top panel of Figure 1-8), mostly because of changes in
      spending on major mandatory health care programs for                projected health care spending.
      later years of the projection period. That reduction
      reflects two factors: technical changes in the projected            The revisions to revenues are slightly more complicated.
      growth rate of health care costs and a slightly lower pro-          CBO’s 2009 projection was based on the assumption that
      jected level of health care spending in 2030 because of the         receipts from income taxes would consistently grow faster
      recent legislation (see Chapter 2).                                 than GDP, causing total projected revenues to gradually
                                                                          increase from 18 percent of GDP in 2012 to 19 percent
      The largest change in the extended-baseline scenario                in 2035 and 22 percent in 2080. In the current projec-
      since last year is a significant increase in projected reve-        tion, revenues are estimated to rise at a faster rate over the
      nues as a percentage of GDP, especially in the 2030s and            next decade, primarily because of the economic recovery
      later years. Whereas previously CBO projected that total            and the additional taxes imposed by the health care legis-
      revenues would reach 22 percent of GDP in 2035 and                  lation. However, tax policy is assumed to adjust after
      26 percent in 2080, the current extended-baseline sce-              2020 so revenues remain at their projected 2020 level
      nario has revenues growing to 23 percent of GDP in                  (just over 19 percent of GDP) for the rest of the long-
      2035 and 30 percent in 2080 (an increase of 4 percentage            term projection period. Consequently, revenues are
      points for that year). Most of the change in revenues               projected to be higher for years before 2035 and lower
      stems from the new excise tax on high-premium health                afterward.
      insurance plans that is scheduled to take effect in 2018.
      That tax will not only generate additional revenues                 Taking those changes together, the striking increase in
      directly when it is paid but also increase revenues if              debt that was projected under the alternative fiscal sce-
      people opt to avoid it by selecting lower-cost health               nario in last year’s report is apparent this year as well (see
                                                                          the bottom panel of Figure 1-8). Federal debt is projected
      21. See Congressional Budget Office, The Long-Term Budget Outlook   to reach 100 percent of GDP in 2023 and then continue
          (June 2009).                                                    to grow at an unsustainable pace.

CBO
CHAPTER ONE                                                                                                    THE LONG-TERM BUDGET OUTLOOK        23


Figure 1-7.
Comparison of CBO’s 2009 and 2010 Budget Projections Under the
Extended-Baseline Scenario
(Percentage of gross domestic product)
                                                         Revenues and Primary Spending
30


25


20
                                                                                    Spending                        Revenues
                                                                                         2009 Projection                  2009 Projection
                                                                                           2010 Projection                2010 Projection
15


10
 0
  2010                        2015                       2020                       2025                       2030                         2035


                                                         Federal Debt Held by the Public
200

175

150

125

100

 75                                                        2010 Projection

 50                                                                                      2009 Projection

 25

  0
     2010                      2015                       2020                       2025                       2030                        2035

Source: Congressional Budget Office.
Notes: Primary spending refers to all spending other than interest payments on federal debt.
         The extended-baseline scenario adheres closely to current law, following CBO’s 10-year baseline budget projections through 2020
         (with adjustments for the recently enacted health care legislation) and then extending the baseline concept for the rest of the long-
         term projection period. (For details, see Table 1-1 on page 3.)


                                                                                                                                                   CBO
24   THE LONG-TERM BUDGET OUTLOOK


      Figure 1-8.
      Comparison of CBO’s 2009 and 2010 Budget Projections Under the
      Alternative Fiscal Scenario
      (Percentage of gross domestic product)
                                                             Revenues and Primary Spending
      30


      25


      20


                                                                                         Spending                           Revenues
      15                                                                                         2009 Projection                2009 Projection
                                                                                                 2010 Projection                2010 Projection


      10
       0
        2010                        2015                       2020                       2025                       2030                         2035


                                                             Federal Debt Held by the Public
      200

      175

      150

      125
                     2010 Projection
      100

       75

       50                2009 Projection

       25

        0
           2010                      2015                       2020                      2025                       2030                         2035

      Source: Congressional Budget Office.
      Notes: Primary spending refers to all spending other than interest payments on federal debt.
               The alternative fiscal scenario incorporates several changes to current law that are widely expected to occur or that would modify
               some provisions that might be difficult to sustain for a long period. (For details, see Table 1-1 on page 3.)


CBO
CHAPTER


                                                        2
                      The Long-Term Outlook for
                   Mandatory Spending on Health Care


S       pending for health care in the United States has
been growing faster than the economy for many years,
                                                             and the increasing pressure of premiums and cost-sharing
                                                             requirements on enrollees’ finances.
posing a challenge not only for the federal government’s
two major health insurance programs, Medicare and            Even assuming that such changes occur, the Congressio-
Medicaid, but also for state and local governments and       nal Budget Office anticipates that federal spending on
the private sector. Measured as a percentage of the          the government’s major mandatory health care programs
nation’s gross domestic product, total spending on health    will continue to rise relative to GDP. CBO has projected
care services and supplies increased from 5 percent in       spending for those programs—Medicare, Medicaid, the
1960 to 10 percent in 1985 and 15 percent in 2008, the       Children’s Health Insurance Program, and the insurance
most recent calendar year for which data are available.      subsidies that will be provided through exchanges estab-
Federal spending for Medicare and Medicaid rose from         lished by the recently enacted health care legislation,
2.2 percent of GDP in fiscal year 1985 to 5.3 percent in     described below—under two scenarios.1 Under the
2009. Underlying those trends, health care spending per      extended-baseline scenario, which reflects current law,
person has grown faster than the nation’s economic out-      federal spending for those programs would grow from
put per person by an average of about 2 percentage points    5.5 percent of GDP today to about 10 percent of GDP in
per year over long periods. Key factors contributing to      2035; about 6 percent of GDP would be devoted to
that faster growth are the emergence and increased use of    Medicare, and about 4 percent would be spent on Medic-
new medical technologies, rising personal income, and
                                                             aid, CHIP, and the exchange subsidies. For the alternative
the expanding scope of health insurance coverage.
                                                             fiscal scenario, CBO assumes that several policies
Such rates of growth cannot continue indefinitely, how-      designed to restrain federal spending on health care
ever, because if they did, total spending on health care     would not be continued. As a result, mandatory federal
would eventually account for all of the country’s eco-       spending on health care programs would grow faster,
nomic output—an implausible outcome. Instead, over           reaching about 11 percent of GDP by 2035. Medicare
time, people will try to limit their spending for health     spending would grow to about 7 percent of GDP, and
care in order to maintain their consumption of other         federal spending on Medicaid, CHIP, and the exchange
goods and services. In addition, state governments—          subsidies would reach about 4 percent of GDP. Beyond
which pay a large share of Medicaid’s costs and have con-    2035, federal health care spending would continue to
siderable influence on those costs—will need to reduce       climb relative to GDP under both scenarios.
spending growth in order to balance their budgets. Thus,
even in the absence of changes in federal law, growth in     1. In this report, federal discretionary spending on health care—that
spending on Medicaid and on health care in the private          is, spending that is subject to annual appropriations—is included
sector will gradually slow. The rate of growth of spending      in the budget projections for other noninterest spending (see
                                                                Table 1-2 in Chapter 1). Some mandatory spending on health
on Medicare is also expected to slow, but to a lesser           care (for example, spending for federal retirees) is also included in
extent, reflecting changes in medical practices common          other noninterest spending; that mandatory spending represents a
to all patients, regulatory changes allowed under the law,      very small share of the federal budget.


                                                                                                                                        CBO
26   THE LONG-TERM BUDGET OUTLOOK


      Quantifying the extent to which the rate of growth of                 modified to reflect different policies under the alternative
      health care spending will decline under current law is dif-           fiscal scenario). Looking beyond the next two decades,
      ficult. The growth of such spending relative to the growth            determining the impact of the legislation on federal
      of the economy has varied greatly from year to year dur-              health care spending is very difficult because the uncer-
      ing the past several decades, so projections of the likely            tainties involved are so great. Moreover, disentangling the
      difference in growth rates during the next few decades are            effects of the legislation from steps that would have been
      very uncertain. As the projection period lengthens, the               taken under prior law to slow the growth of health care
      uncertainties mount because the likelihood of significant             spending becomes increasingly challenging. Conse-
      changes in medical practice and technology increases. As              quently, CBO’s approach in formulating the longer-term
      a result, CBO’s projections of health care spending for               projections in this report has been to incorporate the
      the next few decades probably provide more real informa-              projected effects of the legislation on the level of federal
      tion than its projections for the longer term.                        spending for health care over the next one or two decades
                                                                            (depending on the scenario) and to extrapolate such
      A new consideration in this year’s Long-Term Budget Out-
                                                                            spending (including the incremental effects of the legisla-
      look is the recent enactment of the Patient Protection and
                                                                            tion) using the same growth rates that would have been
      Affordable Care Act, or PPACA (Public Law 111-148),
                                                                            applied in the absence of the legislation. The use of that
      and the Health Care and Education Reconciliation Act of
                                                                            mechanical approach reflects CBO’s judgment that the
      2010 (P.L. 111-152). That legislation has significant and
                                                                            agency does not have an analytic basis for projecting the
      conflicting implications for federal spending. On the one
                                                                            effects of the recently enacted legislation on the growth
      hand, it will substantially expand eligibility for Medicaid
                                                                            rate of federal health care spending over the very long
      (mostly at federal expense) and provide subsidies through
                                                                            term.3
      the new insurance exchanges. On the other hand, the
      legislation will significantly decrease Medicare outlays,             The projections presented in this report differ from those
      largely by reducing payment rates for many types of                   in last year’s Long-Term Budget Outlook because of both
      health care providers relative to the rates that would have           technical changes in CBO’s methodology and the impact
      been paid under prior law, but also by making other
                                                                            of the health care legislation. In last year’s report,
      specific changes in the program and establishing a
                                                                            CBO projected that mandatory federal spending on
      mechanism designed to control the growth in Medicare’s
                                                                            health care would total between 10 percent and 11 per-
      costs per enrollee. (The legislation made numerous other
                                                                            cent of GDP in 2035 under the extended-baseline sce-
      changes as well, but their impact on federal spending for
                                                                            nario, slightly higher than the agency’s current projec-
      health care is generally more modest.) The legislation will
                                                                            tion.4 Under the alternative fiscal scenario, last year’s
      also increase federal revenues significantly (as discussed in
                                                                            projection for mandatory spending on health care was
      Chapter 4); one noteworthy provision is a tax that will be
                                                                            about 11 percent of GDP in 2035—essentially the same
      imposed, starting in 2018, on employment-based health
                                                                            as the current projection.
      insurance plans with relatively high premiums, which will
      encourage enrollees in those plans to shift to less expen-
                                                                            3. For further discussion of the challenges of projecting the long-
      sive and less extensive coverage.                                        term effects of legislation on federal health care spending, see
                                                                               Congressional Budget Office, letter to the Honorable Max Baucus
      CBO and the staff of the Joint Committee on Taxation                     about different measures for analyzing proposals to reform health
      (JCT) have estimated the budgetary effects of that legisla-              care (October 30, 2009).
      tion in detail for the next 10 years and in a much less               4. One factor complicating the comparison is that this year’s report
      precise way for the following 10 years.2 The projections                 presents figures for gross spending for Medicare, whereas last year’s
                                                                               report focused on net Medicare spending—that is, gross spending
      reported here incorporate that original estimate (except as
                                                                               minus certain offsetting receipts (primarily the premiums paid by
                                                                               enrollees). Here, those offsetting receipts (which are projected to
      2. See Congressional Budget Office, letter to the Honorable Nancy        total about 1 percent of GDP in 2035) have been excluded from
         Pelosi about the budgetary effects of H.R. 4872, the Reconcilia-      the spending total reported last year for purposes of comparing
         tion Act of 2010 (March 20, 2010).                                    the two projections.


CBO
CHAPTER TWO                                                                                          THE LONG-TERM BUDGET OUTLOOK        27


Figure 2-1.                                                     have private health insurance. CBO estimates that
                                                                about 150 million nonelderly people currently have an
Distribution of Spending for                                    employment-based health plan as their primary source
Health Services and Supplies, 2008                              of coverage, and about 13 million people have primary
                                                                insurance coverage purchased directly from an insurer.
                                                                At any given time during this year, in CBO’s estimation,
                   Other Public                                 about 50 million people will be uninsured.
                    Spending
                      (10%)
                                                                In 2008, the most recent calendar year for which data are
                                                                available, total spending for health care services and sup-
                                                                plies amounted to about $2.2 trillion, or 15.1 percent of
     Medicaid and CHIP                                          the nation’s GDP.6 In that year, 52 percent of spending
           (16%)                     Private Health Insurance
                                              (36%)             was financed privately; the rest of the spending came
                                                                from public sources (see Figure 2-1):

                                                                B   Payments by private health insurers were the largest
                                                                    component of private spending, making up 36 percent
              Medicare
               (22%)                                                of total expenditures on health care. Consumers’ out-
                                      Consumers'
                                    Out-of-Pocket
                                                                    of-pocket expenses, which include payments made to
                                     Expenditures                   satisfy deductibles and copayments for services cov-
                                        (13%)                       ered by insurance, as well as payments for services not
                                                                    covered by insurance, accounted for 13 percent of
                                                                    those expenditures.7 Other sources of private funds,
                         Other Private                              such as philanthropy, accounted for 4 percent of total
                           Spending
                             (4%)
                                                                    health care spending.
Source: Congressional Budget Office based on data from the      B   Federal spending for Medicare made up 22 percent of
        Centers for Medicare and Medicaid Services.
                                                                    total expenditures on health care in 2008, and federal
Note: CHIP = Children’s Health Insurance Program.
                                                                    and state spending for Medicaid and CHIP accounted
                                                                    for 16 percent. Another 10 percent was accounted for
                                                                    by various other public programs, including those run
Overview of Current Financing for                                   by state and local governments’ health departments,
Health Care                                                         the Department of Veterans Affairs, the Department
Although the recent health care legislation made a num-             of Defense, and workers’ compensation programs.
ber of significant changes to Medicare, Medicaid, and the
financing of private health insurance—and is projected to       5. Some people have coverage from more than one source at a time.
substantially reduce the number of people who are                  Currently, about 7.5 million people with Medicaid coverage are
uninsured—reviewing the current status of the health               also covered by Medicare, which is their primary source of
insurance system is useful because it provides a starting          coverage. All of the estimates reflect average monthly enrollments
                                                                   during the year.
point for CBO’s projections.
                                                                6. This report defines “total health care spending” as spending for
Today, a combination of private and public sources                 health care services and supplies as defined in the national health
finances the provision of health care in the United States.        expenditure accounts maintained by the Centers for Medicare and
                                                                   Medicaid Services. That concept excludes spending on medical
About 46 million people are covered by Medicare, and               research, structures, and equipment. Under a broader definition
58 million are covered by Medicaid, the two main sources           that includes those categories, total national health expenditures
of public financing.5 Medicare provides near-universal             in 2008 were 16.2 percent of GDP.
coverage for the elderly and also covers several million        7. In this analysis, out-of-pocket payments do not include the premi-
nonelderly people; Medicaid covers a variety of low-               ums that people pay for health insurance (because premiums fund
income individuals, most of whom are nonelderly. The               the payments that insurers provide, which are already included in
majority of Americans under the age of 65, however,                the measure of private spending).


                                                                                                                                         CBO
28   THE LONG-TERM BUDGET OUTLOOK


      Medicare                                                                  health care costs for which beneficiaries are responsible.
      In 2010, Medicare will provide federal health insurance                   However, the vast majority of beneficiaries who receive
      for 46 million people who are elderly or disabled (the                    care in the fee-for-service portion of Medicare have
      elderly make up nearly 85 percent of enrollees) or who                    supplemental insurance that covers many or all of the
      have end-stage renal disease or amyotrophic lateral sclero-               program’s cost-sharing requirements. According to one
      sis (also known as Lou Gehrig’s disease). People become                   recent study, the most common sources of supplemental
      eligible for Medicare on the basis of age when they reach                 coverage in 2006 were plans for retirees offered by former
      65; disabled individuals become eligible for the program                  employers (held by 39 percent of beneficiaries in the
      24 months after they qualify for benefits under Social                    fee-for-service part of Medicare), individually purchased
      Security’s Disability Insurance program.                                  medigap policies (32 percent of beneficiaries), and
                                                                                Medicaid (16 percent).9
      Part A of Medicare, or Hospital Insurance, primarily
      covers inpatient services provided by hospitals as well as
                                                                                Medicaid and CHIP
      skilled nursing and hospice care. Part B, or Supplemen-
                                                                                Medicaid is a joint federal/state program that pays for
      tary Medical Insurance, mainly covers services provided
                                                                                health care services for a variety of low-income individu-
      by physicians and other practitioners and by hospitals’
      outpatient departments. Most enrollees in Medicare are                    als. In 2009, federal spending for Medicaid was $251 bil-
      in the traditional fee-for-service program, in which the                  lion, of which $228 billion covered benefits for enrollees.
      federal government pays for covered services directly, but                (In addition to benefits, Medicaid’s spending included
      enrollees can instead obtain coverage for Medicare’s bene-                payments to hospitals that treat a “disproportionate
      fits through a private health insurance plan under Part C                 share” of low-income patients, costs for the Vaccines for
      of Medicare (called Medicare Advantage). A voluntary                      Children program, and administrative expenses.) The
      prescription drug benefit became available in 2006 as                     federal government’s share of Medicaid’s spending for
      Part D of Medicare. In 2009, gross spending for Medi-                     benefits varies among the states. That share usually aver-
      care was $499 billion.                                                    ages 57 percent, but legislation temporarily boosted it in
                                                                                response to the economic downturn; in 2009, the federal
      The various parts of the program are financed in different                share averaged two-thirds. According to the Centers for
      ways. Part A benefits are financed primarily by a payroll                 Medicare and Medicaid Services, states spent $130 bil-
      tax (currently 2.9 percent of taxable earnings), the reve-                lion on Medicaid in 2009.
      nues from which are credited to the Hospital Insurance
      (HI) Trust Fund. For Part B, premiums paid by beneficia-                  States administer their Medicaid programs under federal
      ries cover about one-quarter of outlays, and the govern-                  guidelines that specify a minimum set of services that
      ment’s general funds cover the rest. (Payments to private                 must be provided to certain categories of low-income
      insurance plans under Part C are financed by a blend of                   individuals. Required services include inpatient and out-
      funds from Parts A and B.) Enrollees’ premiums under                      patient hospital services, services provided by physicians
      Part D are set to cover about one-quarter of the cost of
                                                                                and laboratories, and nursing home and home health
      the basic prescription drug benefit, although many low-
                                                                                care. To be eligible for Medicaid, a person must have a
      income enrollees receive larger subsidies; general funds
                                                                                low income and (in certain cases) only a few assets—
      cover most of the remaining cost. Taking all of the parts
                                                                                although the minimum financial thresholds vary, depend-
      of Medicare together, in calendar year 2008, about
      42 percent of gross federal spending was financed by                      ing on the basis for an enrollee’s eligibility. Groups that
      the payroll tax, about 12 percent by beneficiaries’ premi-                must be eligible include low-income children and families
      ums, and about 40 percent by general funds of the                         who would have qualified for the former Aid to Families
      government.8                                                              with Dependent Children program, certain other low-
                                                                                income children and pregnant women, and most elderly
      Cost-sharing requirements in Medicare vary widely, and                    and disabled individuals who qualify for the Supplemen-
      the program does not set an annual cap on the amount of                   tal Security Income program.

      8. Various other sources, including a portion of the federal income       9. Estimates are based on information in Medicare Payment
         taxes that people pay on their Social Security benefits, provide the      Advisory Commission, A Data Book: Healthcare Spending and
         remainder of the funding for Medicare.                                    the Medicare Program (June 2009), p. 61.


CBO
CHAPTER TWO                                                                                                 THE LONG-TERM BUDGET OUTLOOK       29


Within those requirements and other statutory limits,                  grant program with a fixed nationwide cap on federal
states have flexibility in administering the Medicaid pro-             spending. In 2009, federal spending on CHIP was
gram and determining its scope. Partly as a result, the                $7.5 billion, and about 8 million people (mostly chil-
program’s rules are complex, and it is difficult to general-           dren) were enrolled in the program at some point during
ize about the types of enrollees covered, the benefits                 the year. The federal share of CHIP spending varies
offered, and the cost sharing required. States may choose              among the states but usually averages 70 percent.
to make additional groups of people eligible (such as
individuals with income above the mandatory eligibility
thresholds and those who have high medical expenses                    The Historical Growth of Health
relative to their income) or to provide additional benefits            Care Spending
(such as coverage for prescription drugs and dental ser-               Total spending for health care in the United States—that
vices), and they have exercised those options to varying               is, private and public spending combined—has risen sig-
degrees. Moreover, many states seek and receive federal                nificantly as a share of GDP over the past several decades.
waivers that allow them to provide benefits and cover                  Such spending has grown relative to GDP in most years,
groups that would otherwise be excluded. By one esti-                  with the notable exception of the period from 1993 to
mate, federal and state expenditures on optional popula-               2000, when spending for health care remained relatively
tions and benefits accounted for about 60 percent of the               stable as a share of the economy. Many analysts have
Medicaid program’s total spending in 2001.10                           attributed that lull in growth to a substantial rise in the
                                                                       number of people enrolled in managed care plans as well
About 71 million people will be enrolled in Medicaid                   as to excess capacity among some types of providers,
at some point during 2010, CBO estimates; the average                  which increased the leverage that health plans had in
enrollment over the course of the year will be about                   negotiating payments. Economic growth was also
58 million. Those two ways of measuring enrollment                     relatively rapid in that period.
yield such divergent estimates because many people are
eligible for Medicaid for only part of the year. About half            Spending for Medicare and Medicaid has also grown
of Medicaid’s enrollees are low-income children, and                   quickly in recent decades, in part because of rising enroll-
another one-quarter are either the parents of those chil-              ment and in part because of rising costs per enrollee.
dren or low-income pregnant women. The elderly and                     Between 1975 and 2009, gross federal spending for
disabled constitute the remaining one-quarter of Medic-                Medicare rose from 0.9 percent of GDP to 3.5 percent,
aid’s enrollees. Expenses tend to be higher for elderly and            and federal spending for Medicaid increased from 0.4
disabled beneficiaries, many of whom require long-term                 percent of GDP to 1.8 percent. Over that same period,
care, than for other beneficiaries. About one-third of                 total spending for Medicaid (including spending by the
Medicaid’s spending is for long-term care, which includes              states) increased from 0.8 percent of GDP to 2.7 percent.
nursing home services, home health care, and other
medical and social services for people whose disabilities              Underlying Factors
prevent them from living independently. Overall, the                   A crucial factor underlying the rise in per capita spending
elderly and disabled account for about two-thirds of the               for health care in recent decades has been the emergence,
program’s spending.                                                    adoption, and widespread diffusion of new medical tech-
                                                                       nologies and services.12 Major advances in medical sci-
CHIP is a joint federal/state program that provides health             ence allow providers to diagnose and treat illnesses in
insurance coverage for uninsured children living in fami-              ways that previously were impossible. Many of those
lies with income that is relatively low but too high for               innovations rely on costly new drugs, equipment, and
them to qualify for Medicaid.11 Like Medicaid, CHIP is                 skills. Other innovations are relatively inexpensive,
administered by the states within broad federal guide-                 but their costs add up quickly as growing numbers of
lines. Unlike Medicaid, however, CHIP is a matching
                                                                       11. Under certain conditions, parents of enrolled children are also
                                                                           eligible for CHIP, but they constitute a very small percentage of
10. See Kaiser Commission on Medicaid and the Uninsured,
                                                                           the program’s enrollment.
    Medicaid Enrollment and Spending by “Mandatory” and
    “Optional” Eligibility and Benefit Categories (Washington, D.C.:   12. See Congressional Budget Office, Technological Change and the
    Henry J. Kaiser Family Foundation, June 2005), p. 11.                  Growth of Health Care Spending (January 2008).


                                                                                                                                               CBO
30   THE LONG-TERM BUDGET OUTLOOK


      providers and patients make use of them. Although tech-               Studies that have analyzed the sources of past spending
      nological advances can sometimes reduce costs, in medi-               growth have consistently found that the aging of the pop-
      cine such advances and the resulting changes in clinical              ulation has had only a small effect. Although older adults
      practice have generally increased spending.                           generally have higher average medical expenses than
                                                                            younger adults, the age composition of the population
      Other factors that have contributed to the growth of per              has not changed sufficiently to account for much of the
      capita health care spending include increases in personal             increase in per capita spending. Aging has had a larger
      income and the expanded scope of health insurance                     effect on federal spending for health care, however,
      coverage. Demand for medical care tends to rise as real               because nearly all U.S. residents become eligible for
      (inflation-adjusted) family income increases. Moreover,               Medicare when they turn 65. Over the past four decades,
      the expanding scope of insurance coverage in recent                   the share of the population that was age 65 or older grew
      decades, as evidenced by the substantial reduction in the             by about one-quarter—from 10 percent to 13 percent.
      percentage of health care costs that people pay out of
      pocket, has also increased demand, because insurance                  Excess Cost Growth
      coverage reduces the cost of medical care for consumers.              When analyzing historical trends in the growth of health
      (The share of the population with health insurance has                care spending and developing projections for future
      declined slightly in recent decades.) Spending on health              growth of that spending, it is useful to distinguish
      care would also be expected to grow if people were devel-             between various components of that growth. As part of
      oping more health problems or were becoming more                      that analysis, it is common to calculate the increase in
      likely to contract diseases, but the evidence on whether              health care spending per person relative to the growth of
      those factors have substantially increased the use of health          GDP per person after removing the effects of demo-
      care in the past few decades is mixed.13                              graphic changes on health care spending—in particular,
                                                                            changes in the population’s age distribution. The remain-
      Disentangling the effects of technology, income, and                  ing difference in growth rates is generally referred to as
      insurance on the growth of health care spending is diffi-             “excess cost growth.” The phrase is not intended to imply
      cult because the growth of income and insurance cover-                that growth in per capita spending for health care is nec-
      age has increased the demand for new technologies. A                  essarily excessive or undesirable; it simply measures the
      recent study estimated that new medical technologies and              extent to which the growth in such spending (adjusting
      rising income were the most important factors explaining              for changes in the age composition of the population)
      the growth in health care spending since 1960, with the               exceeds the growth in per capita GDP.16
      two accounting for similar shares of that growth.14 But
      the study also noted that the effect of the expansion in              15. Amy Finkelstein, “The Aggregate Effects of Health Insurance:
      insurance coverage on spending growth is highly uncer-                    Evidence from the Introduction of Medicare,” Quarterly Journal
      tain. Another recent study concluded that the expansion                   of Economics, vol. 122, no. 1 (February 2007), pp. 1–37. One
      of insurance coverage resulting from the introduction of                  factor that may have contributed to that study’s findings was
      Medicare had a substantial impact on national health care                 the relatively generous payment system that Medicare adopted.
                                                                                Following the common practice of private insurers at the time,
      spending—raising costs not just for the elderly patients
                                                                                Medicare initially paid hospitals on the basis of their incurred
      who gained coverage but for nonelderly patients as well.                  costs—an approach that gave hospitals little incentive to control
      It attributed part of the impact to more rapid and wide-                  those costs. The increase in hospital spending that resulted from
      spread adoption of existing treatment methods (such as                    Medicare’s creation might have been smaller under a less generous
      those provided by cardiac intensive care units), but ques-                payment system.
      tions remain about the magnitude of those effects.15                  16. For Medicare, CBO also adjusts for changes in the projected life
                                                                                expectancy (time until death) of beneficiaries. For Medicaid, CBO
                                                                                adjusts for changes in the program’s case mix—that is, the por-
      13. For additional discussion, see Congressional Budget Office, Key
                                                                                tions of beneficiaries who are children, disabled people, elderly
          Issues in Analyzing Major Health Insurance Proposals (December
                                                                                people, and other adults—rather than for changes in age composi-
          2008), p. 23.
                                                                                tion. The introduction of Medicare’s Part D drug benefit in 2006
      14. Sheila Smith, Joseph P. Newhouse, and Mark S. Freeland,               resulted in a one-time shift in some spending from Medicaid to
          “Income, Insurance, and Technology: Why Does Health                   Medicare; to adjust for that shift, CBO assumed that excess cost
          Spending Outpace Economic Growth?” Health Affairs, vol. 28,           growth in 2006 for both Medicare and Medicaid was equal to the
          no. 5 (September/October 2009), pp. 1276–1284.                        average of excess cost growth in the two programs for that year.


CBO
CHAPTER TWO                                                                                            THE LONG-TERM BUDGET OUTLOOK    31


Table 2-1.                                                          from its most recent baseline budget projections, which
                                                                    reflect a detailed analysis of each program and its compo-
Excess Cost Growth in Spending for                                  nents. (Throughout this analysis, spending on CHIP,
Health Care                                                         which accounts for less than 0.1 percent of GDP, is com-
(Percentage points)                                                 bined with spending on Medicaid.) For the years beyond
                                                                    that 10-year span, CBO uses the projected amounts of
                  Medicare      Medicaid     All Other     Total
                                                                    spending in the last year of the baseline (2020) and
1975 to 2008          2.5          2.0           1.8        1.9     applies growth rates that reflect CBO’s projections of
                                                                    income growth, general inflation, and demographic
1980 to 2008          2.2          1.7           1.9        1.9
                                                                    changes, as well as rates of excess cost growth that initially
                                                                    reflect historical growth rates but that are assumed to
1985 to 2008          1.5          1.2           1.8        1.7
                                                                    slow over time.17 Thus, two of the key parameters that
                                                                    affect the projections of mandatory federal spending on
1990 to 2008          1.8          1.0           1.4        1.4
                                                                    health care are the initial rates of excess cost growth and
Source: Congressional Budget Office.                                the path by which those rates diminish.
Note: Excess cost growth refers to the extent to which the growth
      rate of Medicare or Medicaid spending per beneficiary—or      Initial Rates of Excess Cost Growth
      all other health care spending per capita—exceeded the        Given the uncertainty surrounding future trends in cost
      growth rate of nominal gross domestic product per capita      growth for health care, a reasonable starting point is the
      per year, on average.                                         historical rate of excess cost growth. Use of that starting
                                                                    point is consistent with the assumption that the future
The resulting calculations indicate that rates of excess cost
                                                                    will look like the past, at least initially. Selecting which
growth have ranged between 1.0 and 2.5 percentage
                                                                    historical period to use, however, presents a trade-off:
points across programs and during various time periods
                                                                    Using a longer period avoids giving transient or cyclical
between 1975 and 2008 (see Table 2-1). For all categories
                                                                    developments undue weight, but it also gives too little
of health care spending, excess cost growth was greater,
                                                                    emphasis to more-recent trends that turn out to be
on average, during the 1975–2008 period than during
                                                                    persistent.
the 1990–2008 period. Average annual rates of excess
cost growth for total health care spending during those             The long-term projections in this report are based on the
two periods were 1.9 percentage points and 1.4 percent-             average rate of excess cost growth observed between 1985
age points, respectively.                                           and 2008. Excess cost growth was lower, on average, dur-
                                                                    ing that period than during the longer 1975–2008
CBO’s Projection Methodology                                        period. That slowing probably stems, at least in part,
This section reviews the approach that CBO follows in               from two important shifts: Private health insurance
projecting mandatory federal spending on health care                moved away from indemnity policies—which generally
over the long term and discusses some technical changes             reimburse enrollees for their incurred medical costs, and
in the application of that approach that have been made             which predominated before the 1990s—and toward
since last year’s report. The ways in which the effects of          greater management of care; and Medicare shifted from
the recently enacted health care legislation have been              cost-based payment methods to fee schedules that seem
incorporated into the projections are examined in a sub-            less conducive to spending growth because price increases
sequent section, after the key provisions of that legislation       are constrained. Excess cost growth was even lower, on
have been described more fully. In effect, the current sec-         average, during the shorter 1990–2008 period, but that
tion describes how CBO would have projected spending                average gives a good deal of weight to the years in the
for health care in the absence of that legislation—which            1990s when managed care was spreading most rapidly—
serves as the starting point for incorporating the impact           some of which probably represented a one-time down-
of the legislation.                                                 ward shift in health care costs rather than a change in the

For the first 10 years of the projection period, CBO uses           17. After 2020, spending on CHIP was held constant as a share of
the estimates of spending for Medicare and Medicaid                     GDP.


                                                                                                                                       CBO
32   THE LONG-TERM BUDGET OUTLOOK


      underlying growth rate. In CBO’s judgment, the average         spending growth outside of Medicare will affect Medi-
      rate of excess cost growth since 1985 best reflects features   care, which is integrated to a significant degree with the
      of the health care and health insurance systems that are       rest of the health care system. In particular, Medicare will
      likely to endure.                                              probably experience some reduction in cost growth to the
                                                                     extent that actions by individuals, businesses, and states
      CBO used the average rate of excess cost growth since          result in lower-cost “patterns of practice” by physicians,
      1985 for total health care spending—1.7 percentage             slower development and diffusion of new technologies,
      points—as the initial rate for Medicare, Medicaid, and         and cost-limiting changes to the structure of the overall
      all other national health care spending, rather than start-    health care system. Moreover, the federal government will
      ing from those sectors’ differing historical rates. That       probably make regulatory changes aimed at slowing the
      approach recognizes that past changes in federal law have      growth of spending for Medicare (and Medicaid), and the
      affected the growth rates observed in Medicare and Med-        demand for health care services by Medicare beneficiaries
      icaid to an extent that is difficult to disentangle from       will be constrained as the program’s premiums and cost-
      other factors affecting those growth rates. It also reflects   sharing amounts consume a growing share of beneficia-
      the considerable uncertainty about whether and how             ries’ income.
      future growth rates will differ across the sectors.
                                                                     In the absence of changes in federal law, state govern-
      This approach to developing initial growth rates differs       ments and the private sector have more flexibility to
      from that adopted in CBO’s June 2009 Long-Term Budget          respond to the pressures of rising health care spending
      Outlook in two ways: The projections for last year’s report    than does the federal government. Consequently, CBO
      were based on trends since 1975, and they used the dif-        projects that excess cost growth in Medicaid’s spending
      fering historical growth rates for each of the three sectors   and in other (non-Medicaid, non-Medicare) spending
      as those sectors’ starting points.                             would slow to a greater degree than would Medicare’s
                                                                     spending. Specifically, CBO assumed that the rate of
      Path of the Slowdown                                           excess cost growth for both Medicaid and other health
      When health care expenditures increase as a share of           care spending in 2084 (the last year of the current 75-year
      GDP, they absorb a rising share of people’s income,            projection period) would be zero, whereas the rate of
      reducing growth in the consumption of other goods and          excess cost growth for Medicare at the end of the period
      services. Thus, continued growth in health care spending       would be 1.0 percentage point. Excess cost growth is pro-
      will create mounting pressure to slow the growth of costs,     jected to decline linearly—that is, by the same fractional
      even in the absence of changes in federal law.                 number of percentage points each year—from its initial
                                                                     starting point of 1.7 percentage points. That approach
      The private sector and state governments will probably         reflects a judgment that, over time, the steps needed to
      respond to rising costs for health care by instituting vari-   keep reducing growth rates will become increasingly
      ous changes. Employers can intensify their efforts to          onerous but that the pressure to take them will also
      reduce the costs of the insurance plans they sponsor—for       intensify because of continued increases in health care
      example, by working with insurers to make the delivery         spending.
      of health care more efficient or by reducing the extent of
      the insurance coverage they offer. To avoid higher premi-      That approach to specifying the path of the slowdown in
      ums, employees can shift to plans with more tightly man-       excess cost growth differs from the approach adopted in
      aged benefits or higher cost-sharing requirements. State       last year’s report in two ways: The projected values of
      governments can respond to growing costs for Medicaid          excess cost growth in the final year of the projection
      by limiting the services they choose to cover or by tight-     period differ slightly, and last year’s report projected that
      ening eligibility to reduce the number of beneficiaries.       the reductions in growth rates would occur relatively
      Because the federal government’s spending for Medicaid         quickly in the initial years and more slowly in the later
      depends on what the states spend, actions by the states        years.18
      that reduce the growth of their Medicaid spending will
      also slow the growth of federal spending for the program.      18. In last year’s report, the rates of excess cost growth in the final year
                                                                         of the 75-year projection period were 0.1 percentage point for
      Many features of the Medicare program cannot be altered            Medicaid and all other health care spending and 0.9 percentage
      without changes in federal law. Still, a slowdown in               points for Medicare.


CBO
CHAPTER TWO                                                                                      THE LONG-TERM BUDGET OUTLOOK    33


Resulting Growth Rates                                           been reduced. Even so, health care costs are projected to
Under CBO’s approach, excess cost growth projected for           continue to rise more rapidly than income, representing
the 2021–2084 period averages about 0.8 percentage               an increasing share of total output and of federal
points for Medicaid and for other health care spending           spending.
and about 1.3 percentage points for Medicare. That is, in
the absence of changes in federal law, Medicare’s costs per      Summary of Initial Assessments
enrollee are projected to grow—on average over a 65-year         Without taking into account the impact of the recently
period—about 0.5 percentage points faster than either            enacted health care legislation, CBO’s long-term projec-
per-enrollee costs in the Medicaid program or per capita         tions of health care spending would be based on the fol-
costs for other spending on health care. (Those calcula-         lowing set of assessments:
tions do not factor in any effects of the recent health care
legislation, which are examined below.) In last year’s           B   Spending for Medicare and Medicaid from 2010
projections, that gap was larger. Specifically, the average          through 2020 would equal the projections in CBO’s
rates projected for excess cost growth over a similar period         most recent baseline (which did not include the effects
were 0.6 percentage points for Medicaid, 0.5 percentage              of the recent legislation).
points for other spending, and 1.5 percentage points for
Medicare.                                                        B   In 2021, excess cost growth in spending for Medicare,
                                                                     Medicaid, and all other health care spending would
It might be difficult to envision how excess cost growth             equal the overall average for historical growth since
in Medicare’s spending could continually outstrip spend-             1985—that is, 1.7 percentage points.
ing for Medicaid and other health care over such a long
period. One way in which that might happen is that               B   Excess cost growth in all three categories—Medicare,
actions taken to reduce spending growth in the private               Medicaid, and other health care spending—would
sector could weaken the incentives to develop and diffuse            slow beginning in 2022.
new medical technologies for nonelderly people but have
less of an effect on new technologies focused on diseases        B   Excess cost growth for Medicare would decline lin-
that principally affect the elderly. Indeed, excess cost             early from 1.7 percentage points in 2021 to 1.0 per-
growth in Medicare has exceeded that for other spending              centage point in 2084, and excess cost growth for
by as much as half a percentage point over periods of a
                                                                     Medicaid and for health care spending apart from
few decades, even though past growth rates reflect
                                                                     Medicare and Medicaid would decline linearly from
changes in law that have probably helped to slow
                                                                     1.7 percentage points in 2021 to zero in 2084.
growth in Medicare’s costs; noticeable differences in
future growth rates over such periods would not be
unprecedented.                                                   Recent Health Care Legislation
                                                                 Lawmakers enacted legislation in March 2010 that will
Relative to a projection in which excess cost growth per-
                                                                 substantially change the nation’s health insurance system
sists at historical rates, the sizable slowdown in excess cost
                                                                 and have significant implications for federal spending on
growth that CBO projects probably can be achieved only
                                                                 health care. The Patient Protection and Affordable Care
through significant changes in the nature of health care,
                                                                 Act, as amended by the Health Care and Education Rec-
access to care, or the amount that households pay directly
for care. For example, in the private sector, households         onciliation Act of 2010, will require most legal residents
will probably face increased cost sharing; new and poten-        of the United States to obtain health insurance starting in
tially useful health technologies will probably be intro-        2014; significantly expand eligibility for Medicaid; set up
duced more slowly or be used less frequently than they           insurance exchanges through which certain individuals
would without a slowdown in excess cost growth; and              and families will receive federal subsidies to greatly reduce
more treatments and interventions may simply not be              their cost of purchasing private coverage; substantially
covered by insurance. In addition, households that would         reduce the growth of Medicare’s payment rates for most
otherwise receive health insurance through Medicaid may          services (relative to the growth rates projected under prior
be ineligible because of tightened eligibility rules or may      law); impose an excise tax on insurance plans with rela-
be eligible but find that the scope of covered services has      tively high premiums; and make various other changes to


                                                                                                                                 CBO
34   THE LONG-TERM BUDGET OUTLOOK


      the federal tax code, Medicare, Medicaid, and other                     outlays because their value will often exceed what enroll-
      programs.                                                               ees’ income tax liability would otherwise be.20 In addi-
                                                                              tion, the subsidies to reduce enrollees’ cost sharing will be
      Provisions That Will Increase Federal Spending                          classified as outlays.
      The expansion of Medicaid eligibility and the provision
      of subsidies through the new insurance exchanges will                   Provisions That Will Reduce Federal Spending
      both increase federal spending for health care. Starting                The legislation contains a number of provisions that will
      in 2014, most nonelderly people with income below                       substantially reduce federal spending on Medicare relative
      138 percent of the federal poverty level (FPL) will                     to what it would have been under prior law. The major
      become eligible for Medicaid.19 The people who will gain                source of those savings is a set of provisions that perma-
      eligibility for Medicaid under the new law consist primar-              nently reduce the annual updates to Medicare’s payment
      ily of nonelderly adults with low income who are not par-               rates for many types of fee-for-service health care provid-
      ents of dependent children. (Low-income children and                    ers. Under prior law, those payment updates would have
      their parents already qualify for Medicaid under prior                  generally been equal to the estimated change in the aver-
      law, although the income thresholds vary by state.) The                 age cost of providers’ inputs (such as labor and equip-
      federal government will pay all of the costs of covering                ment). Under the new law, however, those updates will be
      newly eligible enrollees through 2016. In subsequent                    adjusted downward by the estimated rate of economy-
      years, the federal share of that spending will decline                  wide growth in productivity—a measure that seeks to
      gradually to 90 percent in 2020, where it will remain.                  capture, for the economy as a whole, how much more
                                                                              output is being produced from a given level of inputs. (In
      Insurance exchanges will be established in 2014 through                 some cases, the law also specifies additional reductions in
      which certain people with income up to 400 percent of                   the update factors.) The other key source of savings,
      the FPL will be eligible for federal subsidies to reduce                according to CBO’s projections, is a reduction in pay-
      their cost of obtaining private health insurance coverage.              ments to private health insurance plans under Part C of
      Eligible people who purchase a relatively inexpensive plan              Medicare.
      providing a specified level of benefits will receive a sub-
      sidy that limits their net premium to a certain percentage              The legislation also includes various changes in Medi-
      of their income. In 2014, the percentages of income will                care’s payment policies that many experts believe have the
      range from 2 percent for the lowest-income households                   potential to reduce federal spending on health care with-
      to 9.5 percent for households with income between                       out harming patients’ health—but that CBO expects will
      300 percent and 400 percent of the FPL (those percent-                  probably require much experimentation and refinement
      ages will be indexed in future years, as described below).              before significant savings will be achieved. Therefore,
      People with income below 250 percent of the FPL will                    CBO projected limited savings during the next two
      also be eligible to receive subsidies to reduce their cost-             decades from provisions allowing physicians to establish
      sharing requirements. People will not be eligible to                    “accountable care organizations,” establishing a national
      receive subsidies through the exchanges if they already                 pilot program to develop approaches to bundling the
      qualify for public coverage—including Medicaid—or if                    payments for an “episode” of care during and after hospi-
      they are offered coverage through their employment,                     talization, and making related changes to other payment
      unless they would have to pay more than a specified share               policies.21 The legislation further establishes a Center for
      of their income for such coverage.                                      Medicare and Medicaid Innovation and gives the Secre-

      Although the premium subsidies are structured as tax                    20. To the extent that receiving a tax credit reduces what a person
      credits, most of the funds involved will be classified as                   owes in taxes, the credit results in a reduction in revenues. Because
                                                                                  the tax credits are refundable, however, people can receive a credit
                                                                                  that exceeds their income tax liability, in which case a cash pay-
      19. PPACA expanded eligibility for Medicaid to include nonelderly
                                                                                  ment will be made for the portion beyond the liability; such
          residents with income up to 133 percent of the federal poverty
                                                                                  payments appear in the federal budget as outlays.
          level. A provision of the Health Care and Education Reconcilia-
          tion Act of 2010 effectively increased that threshold to 138 per-   21. For a further description of accountable care organizations, see
          cent of the FPL. The FPL is currently $22,050 for a family of           Congressional Budget Office, Budget Options Volume I: Health
          four.                                                                   Care (December 2008), pp. 72–74.


CBO
CHAPTER TWO                                                                                          THE LONG-TERM BUDGET OUTLOOK        35


tary of Health and Human Services broad authority to            other providers of Medicare’s services. In particular,
develop and conduct experiments to test and refine new          increases in payment rates for many providers will be held
approaches to paying providers and delivering health care       below the rate of increase in the average cost of providers’
benefits. The Secretary has the authority to implement          inputs.
such approaches on a broader scale (including nationally)
if an evaluation concludes that they have favorable effects     Taking all the provisions of the legislation together, CBO
on the quality of care and expenditures.                        expects that, adjusted for inflation, Medicare spending
                                                                per beneficiary will increase at an average annual rate of
In addition, the legislation establishes an Independent         less than 2 percent during the next two decades—com-
Payment Advisory Board (IPAB), which will be required           pared with a roughly 4 percent annual growth rate during
to submit proposals to reduce Medicare’s spending per           the past two decades (a calculation that excludes the
enrollee if the growth of such spending is projected to         effect of establishing the Medicare prescription drug ben-
exceed certain targets. Those proposals would go into           efit). It is unclear whether that lower rate of growth can
effect automatically unless blocked or replaced by subse-       be sustained and, if so, whether it will be accomplished
quent legislative action. From 2015 through 2019, the           through greater efficiencies in the delivery of health care
target growth rate is the average of general price inflation    or will instead reduce access to care or diminish the qual-
and measured price inflation for medical services. In sub-      ity of care (relative to the situation under prior law).
sequent years, the target growth rate is the percentage
increase in per capita GDP plus 1 percentage point. The         Another provision that may be difficult to sustain will
legislation places a number of limitations on the actions       slow the growth of federal subsidies for health insurance
available to the IPAB, including a prohibition against          purchased through the insurance exchanges. For enrollees
modifying Medicare’s eligibility rules or reducing              who receive subsidies, the amount they will have to pay
benefits. Nevertheless, CBO expects these provisions to         depends primarily on a formula that determines what
restrain Medicare spending somewhat.                            share of their income they have to contribute to enroll in
                                                                a relatively low-cost plan (with the subsidy covering the
The legislation also imposes an excise tax on relatively        difference between that contribution and the total pre-
expensive insurance plans offered through employers,            mium for that plan). Initially, the percentages of income
starting in 2018. The primary impact of that tax on the         that enrollees must pay are indexed so that the subsidies
federal budget is through federal revenues, as discussed in     will cover roughly the same share of the total premium
Chapter 4; whether and how it will affect federal spend-        over time. After 2018, however, an additional indexing
ing for health care (for example, through spillovers from       factor will probably apply; if so, the shares of income that
changes in private spending for health care) is difficult to    enrollees have to pay will increase more rapidly, and the
predict.                                                        shares of the premium that the subsidies cover will
                                                                decline.22
Questions About Sustainability
One challenge that arises in projecting federal outlays for     Net Budgetary Effects of the Legislation
health care over the long term is that the recent legislation   CBO and the staff of the Joint Committee on Taxation
either left in place or put into effect a number of proce-      have provided detailed estimates of the effects of the
dures that may be difficult to sustain over a long period.      recently enacted health care legislation on the federal
For example, the legislation did not alter the sustainable      budget over the period from 2010 to 2019 and have pro-
growth rate mechanism used for determining updates to           vided a less precise analysis for the subsequent decade.23
Medicare’s payment rates for physicians; under that             Those estimates show an increase in mandatory outlays
mechanism, those rates are scheduled to be reduced by           of $382 billion and an increase in federal revenues of
about 21 percent in 2010 and then decline further in            $525 billion over the 2010–2019 period, yielding a
subsequent years. Since that mechanism was enacted in
1997, its provisions have usually been modified to avoid        22. The additional indexing factor will apply in any year (after 2018)
scheduled reductions in payment rates, and legislation              in which the total costs of exchange subsidies exceed a specified
was just enacted to delay cuts in those payment rates               percentage of GDP; CBO expects that condition will probably be
until December 2010 (a development that is not reflected            met.
in the projections). At the same time, the legislation          23. See Congressional Budget Office, letter to the Honorable Nancy
includes provisions that will constrain payment rates for           Pelosi about the budgetary effects of H.R. 4872.


                                                                                                                                         CBO
36   THE LONG-TERM BUDGET OUTLOOK


      reduction in deficits of $143 billion. CBO and JCT                            sort of extrapolation may not be appropriate. Distin-
      expect that the legislation will also reduce federal budget                   guishing between a series of shifts in the level of federal
      deficits over the ensuing decade relative to those pro-                       health care spending and permanent changes in the
      jected under prior law—with a total effect during that                        growth rate of such spending is difficult. Although CBO
      decade in a broad range around 0.5 percent of GDP. The                        can provide a rough indication of the legislation’s effect
      imprecision of that calculation reflects the even greater                     on the level of spending 20 years ahead, the agency does
      degree of uncertainty that attends to it, compared with                       not believe that it has an analytic basis for evaluating
      the 10-year budget estimates. Federal outlays for health                      whether the legislation’s effect on the rate of growth of
      care are projected to remain higher than they would have                      spending over the next 20 years will continue.
      been under prior law for most of that second decade, but
      to fall slightly below the prior-law level by 2030 (under                     Therefore, to project mandatory federal spending on
      the assumption that all of the legislation’s provisions are                   health care for the longer term—incorporating the
      fully implemented).24                                                         impact of the new laws—CBO has adopted a relatively
                                                                                    simple and mechanical approach. Specifically, the projec-
      Determining the effects of the legislation beyond 2030 is                     tions incorporate the effects of the legislation on the level
      very difficult because of the considerable uncertainties                      of that spending over the next one or two decades and
      involved. A wide range of changes could occur—in peo-                         then calculate spending in subsequent years by applying
      ple’s health, in the sources and extent of their insurance                    the same growth rates that would have applied in the
      coverage, and in the delivery of medical care—that are                        absence of the legislation. In other words, the incremental
      almost impossible to predict but that could have a signifi-                   effects of the legislation are extrapolated using the same
      cant effect on federal health care spending, both under                       growth rates as are projected in the absence of the legisla-
      the legislation and under prior law. Furthermore, over a                      tion. Consequently, because the legislation is expected to
      longer time horizon, it becomes very challenging to dis-                      reduce Medicare’s spending by about 20 percent in 2030,
      entangle the effects of the legislation from the effects of                   projected Medicare spending will be about 20 percent
      other changes that would have been made even without                          lower than the prior-law projections in subsequent years.
      the legislation to slow the growth of private and public                      Likewise, because the legislation is estimated to raise
      spending on health care.                                                      Medicaid’s spending by about 20 percent in 2030, Med-
                                                                                    icaid’s spending is projected to remain about 20 percent
      Because the legislation is expected to reduce mandatory
                                                                                    above the prior-law estimates thereafter.
      federal spending on health care 20 years from now, the
      average growth rate of that spending calculated over those
      two decades will be slightly lower than it would otherwise                    Long-Term Projections of Mandatory
      have been. It might seem natural to assume that the dif-
      ference in growth rates will continue indefinitely, but that
                                                                                    Federal Spending
                                                                                    CBO calculated mandatory federal spending on health
                                                                                    care under two scenarios. The first is intended to reflect
      24. CBO also estimated the effects of the legislation on the “federal
                                                                                    the provisions of current law; the second deviates from
          budgetary commitment to health care,” a term that describes the
          sum of net federal outlays for health programs and tax preferences        current law:
          for health care (such as the tax exclusion for employment-based
          health insurance). Specifically, CBO estimated that the two laws          B   Under the extended-baseline scenario, the effects of
          will increase that commitment by about $390 billion over the                  the recent health care legislation as estimated by CBO
          2010–2019 period. In subsequent years, however, the effects of                and JCT for the next two decades are layered on top of
          the provisions of the laws that will tend to decrease the federal
          budgetary commitment to health care will exceed the effects of the
                                                                                        CBO’s March 2010 baseline projections. Medicare’s
          provisions that will increase it. As a result, CBO expects that,              payment rates for physicians are assumed to be
          relative to prior law, the legislation will generate a net reduction in       reduced as specified under current law through 2020.
          the federal budgetary commitment to health care during the                    Beyond the next 20 years, the projected growth rates
          2020–2029 period. For additional discussion of that term, see                 in spending for the government’s mandatory health
          Congressional Budget Office, letter to the Honorable Max Baucus
          about different measures for analyzing current proposals to reform
                                                                                        care programs are based on CBO’s projections of
          health care. In this report, the effects of the legislation on tax            demographic and economic trends (see Appendix B)
          preferences for health care and tax revenues more generally are               and the agency’s projections about excess cost growth
          examined in Chapter 4.                                                        for the 2030–2084 period.


CBO
CHAPTER TWO                                                                                                    THE LONG-TERM BUDGET OUTLOOK         37


B   Under the alternative fiscal scenario, the effects of the            at the same rate under both scenarios thereafter.26 The
    recent health care legislation as estimated by CBO and               resulting difference between the extended-baseline
    JCT for the next decade are layered on top of CBO’s                  scenario and the alternative fiscal scenario highlights the
    March 2010 baseline projections—except that Medi-                    significance of those policies for the federal budget.
    care’s payment rates for physicians are assumed to rise
    gradually through 2020.25 Beyond that point, the pro-                The subsidies provided through the new insurance
    jected growth rates in spending for the government’s                 exchanges are projected differently under the two scenar-
    mandatory health care programs are based on CBO’s                    ios. For the extended-baseline scenario, those outlays are
    projections of demographic and economic trends and                   extrapolated through 2029 in a way that is consistent
    the agency’s projections about excess cost growth for                with the cost estimate for the health care legislation.
    the 2021–2084 period.                                                For the alternative fiscal scenario, outlays are projected
                                                                         through 2029 in a similar manner but without applying
The two scenarios thus differ in only one respect through                the additional indexing provision that would reduce
2020: Under the extended-baseline scenario, the existing                 the government’s share of premium costs (described on
sustainable growth rate formula used to determine pay-                   page 35). For each scenario, projections for outlays
ment rates for physicians is assumed to continue to apply,               beyond 2029 are based on CBO’s projections of demo-
resulting in sharp reductions in those payment rates from                graphic and economic trends and the agency’s projections
the current amounts; under the alternative fiscal scenario,              of excess cost growth for Medicaid and all other health
Medicare’s payment rates for physicians are instead                      care spending over the 2030–2084 period.
assumed to increase gradually, pushing up total spending.
The resulting difference between the scenarios regarding                 In both scenarios, the projections of exchange subsidies
physicians’ payments by Medicare during the first                        are subject to an especially large degree of uncertainty and
10 years affects the projections of Medicare’s spending                  could err in either direction. On the one hand, income
beyond 2020 as well.                                                     growth and the indexing of the subsidies may diminish
                                                                         the value of the exchange subsidies over time; on the
Between 2020 and 2030, the difference between the two                    other hand, changes in other insurance options (includ-
scenarios is greater. Under the extended-baseline scenario,              ing employment-based insurance) could cause spending
projected federal spending is assumed to be constrained                  on exchange subsidies to grow faster than projected. In all
by a number of policies specified in the recent health care              of the projections, the outlays for exchange subsidies are
legislation—the continuing reductions in updates for                     presented in combination with outlays for Medicaid (and
Medicare’s payment rates, the constraints on Medicare                    CHIP) both for ease of exposition and to reflect the fact
imposed by the IPAB, and the additional indexing provi-                  that they all constitute federal subsidies to provide health
sion that will slow the growth of exchange subsidies after               insurance for lower- and moderate-income households.
2018. Because those policies may be difficult to maintain                (Most of the exchange subsidies are classified as outlays;
over the long term, in the alternative fiscal scenario it is             the portion that reflects reductions in revenue is included
assumed that they will not continue after 2020. Given                    in the revenue projections discussed in Chapter 4.)
CBO’s projection methodology, the upshot of those
assumptions is that federal spending would be higher in                  Projected Spending
2030 under the alternative fiscal scenario and would grow                In 2010, federal spending on Medicare, Medicaid, and
                                                                         CHIP will amount to 5.5 percent of GDP, CBO expects,
25. For the alternative fiscal scenario, CBO assumed that Medicare’s     with Medicare accounting for 3.6 percent of GDP and
    payment rates for physicians would be held constant in 2010 at       federal spending on Medicaid and CHIP adding 1.9 per-
    the 2009 amounts and then increased annually through 2020
                                                                         cent of GDP.
    using the Medicare economic index—a measure of input costs for
    physicians’ services, adjusted for productivity gains. After 2020,
    Medicare’s spending on physicians’ services is combined with all     26. CBO assumed that under both scenarios, Medicare benefits
    other Medicare spending, which is projected to grow using the            would continue to be paid in full regardless of the financial status
    assumptions described above.                                             of the Hospital Insurance Trust Fund.


                                                                                                                                                    CBO
38   THE LONG-TERM BUDGET OUTLOOK


      Figure 2-2.                                                                Under the alternative fiscal scenario, mandatory federal
                                                                                 spending on the major health care programs would be
      Mandatory Federal Spending on                                              higher because CBO assumed that several policies
      Health Care, by Category, Under                                            designed to limit that spending would not continue in
      CBO’s Extended-Baseline Scenario                                           effect; as a result, projected spending would be greater,
                                                                                 particularly for Medicare, than under the extended-
      (Percentage of gross domestic product)                                     baseline scenario. Specifically, Medicare’s spending would
      10                                                                         grow to about 7 percent of GDP by 2035, and federal
                    Actual Projected
                                                                                 spending on Medicaid, CHIP, and the exchange subsidies
                                                                                 would reach about 4 percent of GDP—so total federal
       8
                                                                                 spending on those programs would be about 11 percent
                                                                                 of GDP (see Figure 2-3). Extrapolating to 2080, federal
                                            Medicaid, CHIP, and
       6                                                                         spending on those programs would continue to rise,
                                            Exchange Subsidies
                                                                                 reaching about 19 percent of GDP. Medicare’s spending
       4                                                                         would be between 13 percent and 14 percent of GDP, or
                                                                                 about 2 percentage points higher than under the
                                                    Medicare
                                                                                 extended-baseline scenario. Federal spending for Medic-
       2
                                                                                 aid, CHIP, and the exchange subsidies in 2080 would be
                                                                                 between 5 percent and 6 percent of GDP—close to the
       0                                                                         amount estimated under the extended-baseline scenario,
        2000      2005    2010      2015     2020     2025     2030      2035    because the policies governing Medicaid and CHIP are
      Source: Congressional Budget Office.
                                                                                 the same in both cases and because exchange subsidies
                                                                                 represent a relatively small share of GDP. (For CBO’s pro-
      Notes: The extended-baseline scenario adheres closely to current
                                                                                 jections of national spending on health care, see Box 2-1
             law, following CBO’s 10-year baseline budget projections
                                                                                 on page 40.)
             through 2020 (with adjustments for the recently enacted
             health care legislation) and then extending the baseline
             concept for the rest of the long-term projection period.
                                                                                 Comparison with CBO’s 2009 Projections
                                                                                 In last year’s report, CBO projected that mandatory fed-
             (For details, see Table 1-1 on page 3.)
                                                                                 eral spending on the major health care programs would
               CHIP = Children’s Health Insurance Program.
                                                                                 total between 10 percent and 11 percent of GDP in 2035
      Under the extended-baseline scenario, federal spending                     under the extended-baseline scenario, slightly higher than
      for those programs and for the exchange subsidies would                    the agency’s current projection.28 That total was projected
                                                                                 to rise to about 19 percent of GDP by 2080 in last year’s
      total about 10 percent of GDP in 2035; about 6 percent
                                                                                 report, about 2 percentage points higher than the current
      would be for Medicare, and about 4 percent would be                        projection. Under the alternative fiscal scenario, last year’s
      for Medicaid, CHIP, and the exchange subsidies (see                        projection for mandatory federal spending on health care
      Figure 2-2). Extrapolating to 2080, total federal spending                 was about 11 percent of GDP in 2035 and was between
      on those major health care programs would reach about                      19 percent and 20 percent of GDP in 2080—roughly the
      17 percent of GDP: Medicare’s share would be between                       same as the current projections.
      11 percent and 12 percent, and the share for Medicaid,
                                                                                 The differences from last year’s projections reflect both
      CHIP, and the exchange subsidies would be between
                                                                                 technical changes in CBO’s methodology and the impact
      5 percent and 6 percent.27 The figures for 2080 should                     of the recently enacted health care legislation. For the
      be viewed with much more caution because of the                            extended-baseline scenario, CBO’s technical changes
      greater uncertainty involved in making such long-range                     reduced projected federal spending on health care
      projections.                                                               through 2035, compared with last year’s projection.

      27. For an analysis of the relative impacts that aging of the population   28. The estimates from last year’s report have been adjusted to reflect
          and excess cost growth have on the projections, see Box 1-2 in             gross spending for Medicare, rather than net spending, to make
          Chapter 1.                                                                 them comparable with the estimates in this year’s report.


CBO
CHAPTER TWO                                                                                                 THE LONG-TERM BUDGET OUTLOOK         39


Figure 2-3.                                                           Under both scenarios, the relatively small net changes in
                                                                      mandatory federal spending on health care relative to last
Mandatory Federal Spending on                                         year’s projections mask larger gross differences in pro-
Health Care Under CBO’s                                               jected spending on Medicare, Medicaid, CHIP, and the
Long-Term Budget Scenarios                                            exchange subsidies. Specifically, under the extended-
                                                                      baseline scenario, gross Medicare spending in 2035 is
(Percentage of gross domestic product)
                                                                      now projected to be lower by nearly 2 percent of GDP,
12                                                                    compared with last year’s projections, and outlays for
            Actual Projected
                                                                      Medicaid, CHIP, and the new exchange subsidies are
10
                                   Alternative Fiscal                 higher by about 1 percent of GDP.29 (Again, those differ-
                                       Scenario                       ences in the component projections reflect both technical
 8
                                                                      changes and the effects of legislation.) By 2080, the
                                             Extended-Baseline        differences from last year’s projections are larger—gross
 6                                                Scenario            Medicare spending is lower in this year’s projection, by
                                                                      about 4 percent of GDP, and spending for Medicaid,
 4
                                                                      CHIP, and the exchange subsidies is higher, by about
                                                                      2 percent of GDP. Those results largely reflect CBO’s
 2
                                                                      judgment that Medicare’s spending will grow at a some-
                                                                      what faster rate than Medicaid’s after 2030; consequently,
 0
                                                                      the savings from reducing projected Medicare spending
  2000    2005     2010     2015     2020     2025      2030   2035
                                                                      in 2030 become magnified over time relative to the added
Source: Congressional Budget Office.                                  costs projected for Medicaid, CHIP, and the exchange
Note: The extended-baseline scenario adheres closely to current       subsidies.
      law, following CBO’s 10-year baseline budget projections
      through 2020 (with adjustments for the recently enacted         Projections Under Alternative Assumptions
      health care legislation) and then extending the baseline        Although all long-term economic and demographic
      concept for the rest of the long-term projection period. The    trends are uncertain and thus difficult to forecast, excess
      alternative fiscal scenario incorporates several changes to
                                                                      cost growth in health care spending during the next
      current law that are widely expected to occur or that would
      modify some provisions that might be difficult to sustain for
                                                                      75 years may be particularly so. The systems of health
      a long period. (For details, see Table 1-1 on page 3.)          care and health care financing have existed in their cur-
                                                                      rent forms for only a few decades, and medical technol-
The net impact of the recent legislation was to increase              ogy continues to evolve rapidly. The projections in this
federal spending for most of the next 20 years; but by                report will undoubtedly prove to be inaccurate in one
2035, the incremental effect of the legislation (if all of its        direction or another. And judging their accuracy will be
provisions are fully implemented) is a net reduction in               difficult even after the fact, because they assume no
projected expenditures (see Figure 2-4 on page 42). By                changes in federal law or policies, and such changes are
that point, the savings in Medicare are expected to exceed            virtually certain to occur. Even without policy changes,
the combined increase in outlays for Medicaid, CHIP,                  though, actual spending for health care could be much
and the exchange subsidies. Even so, most of the differ-              lower or much higher than the figures contained in
ence from last year’s projection for 2035 is attributable to          CBO’s and other forecasters’ projections.
CBO’s technical changes rather than the effects of the
                                                                      For comparison purposes, CBO projected federal spend-
legislation. For the alternative fiscal scenario, the net
                                                                      ing for Medicare, Medicaid, CHIP, and the exchange
effect of CBO’s technical changes was about the same as
                                                                      subsidies under varying assumptions about excess cost
for the extended-baseline scenario. However, under that
                                                                      growth. The effects of that variation are easiest to
scenario, the net impact of the recent legislation would be
to increase federal spending in 2035 because of the
                                                                      29. In last year’s report, the projections for Medicaid did not include
assumption that a number of important provisions of the                   spending for CHIP; however, spending on that program is rela-
legislation that would reduce federal spending would not                  tively small (about $7 billion in 2008), representing less than one-
continue in effect beyond 2020.                                           tenth of 1 percent of GDP.


                                                                                                                                                 CBO
40   THE LONG-TERM BUDGET OUTLOOK


         Box 2-1.
         National Spending on Health Care
          The Congressional Budget Office (CBO) has a                        GDP would be about 1 percentage point higher in
          limited ability to project national spending on health             2035 and roughly 2 percentage points higher in
          care because the agency does not track several compo-              2080.
          nents of those expenditures as closely as it analyzes
          the components that are part of the federal budget.                Methodology
          To generate projections of total expenditures on                   To estimate total spending for health care for the
          health care over the longer term, the agency has com-              2009–2019 period, CBO started with its projections
          bined its own projections with estimates and projec-               of federal spending on the government’s major man-
          tions developed by the Office of the Actuary in the                datory health care programs—Medicare, Medicaid,
          Centers for Medicare and Medicaid Services (CMS).1                 the Children’s Health Insurance Program, and the
          The projections are rough and involve substantial                  insurance subsidies that will be provided through
          uncertainty—especially those that extend far into the              exchanges established by the recently enacted health
          future—and thus should be viewed with caution.                     care legislation (the Patient Protection and Affordable
                                                                             Care Act and the Health Care and Education Recon-
          During the past 30 years, total spending on health                 ciliation Act of 2010). Other spending for health care
          care has almost doubled as a share of the economy,                 includes payments by private health insurers, out-of-
          growing from 8 percent to 15 percent of gross domes-               pocket payments by households, and other public
          tic product (GDP). To project such spending in the                 spending. CBO projected those categories of spend-
          future, CBO developed two scenarios. Under the                     ing for the 2009–2019 period using its projections of
          extended-baseline scenario, which reflects current                 payments by private health insurers and the CMS
          law, total spending for health care would increase                 actuaries’ projections of all other components of that
          to about 26 percent of GDP by 2035. (All years                     spending. CBO also relied on the CMS actuaries’
          reported here are calendar years.) By 2080, total                  estimate of the incremental effects of the recently
          spending on health care under that scenario would                  enacted health care legislation on other spending
          account for roughly 41 percent of GDP, in CBO’s                    (that is, spending other than federal spending on the
          estimation. Under the alternative fiscal scenario, in              major mandatory health care programs).2 Through
          which several policies designed to restrain federal                2019, those projections show higher levels of other
          spending on health care are assumed not to continue                spending and total spending on health care as a result
          in effect, total spending on health care as a share of             of the legislation.

          1. As used here, the term “total expenditures” means spending      2. See Centers for Medicare and Medicaid Services, Office of
             on health care services and supplies; it excludes spending on      the Actuary, memorandum on the effects of the Patient
             medical research, structures, and equipment.                       Protection and Affordable Care Act (April 22, 2010).


                                                                                                                                   Continued

      illustrate by changing the rate of excess cost growth that             If, instead, excess cost growth for those programs contin-
      applies after 2020 under the alternative fiscal scenario. A            ued to equal 2 percentage points indefinitely—or roughly
      projection in which such growth is held constant at zero,              the average rate observed since 1975—mandatory federal
      although implausible, is useful because it isolates the                spending for health care would grow to between 11 per-
      effect that the aging of the population has on spending                cent and 12 percent of GDP by 2035. (Under the alter-
      (see Figure 2-5 on page 43). In that case, mandatory                   native fiscal scenario used in this report, that figure is
      federal spending on health care would increase from                    11 percent in 2035.) By 2080, the differences between
      5.5 percent of GDP in 2010 to nearly 9 percent by 2035.                the two projections would be much greater; mandatory


CBO
CHAPTER TWO                                                                                            THE LONG-TERM BUDGET OUTLOOK         41


   Box 2-1.                                                                                                        Continued
   National Spending on Health Care
    CBO derived the path of other spending on health              the recently enacted health care legislation is pro-
    care after 2019 by combining its projections of               jected to have much smaller effects on total spending
    demographic and economic changes with assump-                 for health care.
    tions about excess cost growth for such spending
    (that is, growth in spending per person that exceeds          Specifically, the projections in last year’s report used
    the growth of GDP per person, after adjusting for             data from 2006 as the starting point and then applied
    changes in the population’s age distribution). Specifi-       the historical rate of excess cost growth for other
    cally, CBO used the average rate of excess cost growth        spending on health care to determine the total
    since 1985 for total health care spending—1.7 per-            amount of other spending through 2019 (after which
    centage points—as the initial rate of excess cost             cost growth was projected to slow). This year’s report
    growth for the longer-term projections. CBO also              updated that starting point to 2008 and then used a
    assumed that the rate of excess cost growth for other         combination of projections from CBO and the CMS
    health care spending in 2084 would be zero. In                actuaries to generate estimates for other spending
    between, excess cost growth is assumed to decline lin-        between 2009 and 2019. Those changes resulted in a
    early—that is, by the same number of fractional per-          projected amount of other spending on health care in
    centage points each year. The resulting calculations of       2019 that is lower than the figure in last year’s
    other spending were then combined with the projec-            report—a difference of about 3 percent of GDP. After
    tions of federal spending for the government’s major          accounting for the increase in other spending
    mandatory health care programs to yield a rough pro-          expected to result from the recent legislation, CBO
    jection of total spending on health care.                     used that lower amount as the starting point for the
                                                                  projection of other spending beyond 2019. The pro-
    Comparison with CBO’s 2009 Projections                        jection for those years was also affected by technical
    In the Long-Term Budget Outlook that CBO released             changes in CBO’s approach for projecting other
    in June 2009, total spending on health care was               spending on health care over the longer term.
    projected to reach about 31 percent of GDP in 2035
    and about 46 percent in 2080 under the extended-
    baseline scenario.3 The corresponding figures for this
    year are about 5 percentage points lower than last            3. Last year’s report focused on net Medicare spending, so
    year’s projected levels. Essentially all of that difference      premiums paid by enrollees and other offsetting receipts for
                                                                     Medicare were included in other health care spending. The
    in 2035 and the vast majority of the difference in               comparisons of Medicare and other health care spending
    2080 is attributable to the use of updated data and to           between this report and last year’s report adjust for that
    the technical changes CBO made in its methodology;               difference.


federal spending on health care in that year is projected to      status of Part A of Medicare. A commonly used measure
be between 9 percent and 10 percent of GDP under the              is the actuarial balance—that is, the present value of reve-
assumption that excess cost growth is zero, compared              nues plus the current trust fund balance minus the pres-
with projected spending of between 30 percent and                 ent value of outlays and the desired trust fund balance
31 percent of GDP under the assumption that excess                (one year of outlays) at the end of a specified period.30
cost growth is equal to 2 percentage points indefinitely.
                                                                  30. A present value is a single number that expresses a flow of current
Trust Fund Measures                                                   and future income or payments in terms of an equivalent lump
Projections of the balances in the Hospital Insurance                 sum received or paid today. Here, it is calculated over 75 years
Trust Fund offer another way to look at the financial                 using a 3 percent real discount rate.


                                                                                                                                            CBO
42   THE LONG-TERM BUDGET OUTLOOK


      Figure 2-4.
      Comparison of CBO’s 2009 and 2010 Projections of Mandatory Federal Spending
      on Health Care Under the Extended-Baseline Scenario
      (Percentage of gross domestic product)
      12


                                                                                                             2009 Projection
      10


       8                                                                                                                 2010 Projection
                                            2010 Projection
                                                                                                                       Excluding Effects of
                                                                                                                       Recent Health Care
                                                                                                                           Legislation
       6


       4

       0
        2010                       2015                       2020                      2025                       2030                       2035

      Source: Congressional Budget Office.
      Note: The extended-baseline scenario adheres closely to current law, following CBO’s 10-year baseline budget projections through 2020
            (with adjustments for the recently enacted health care legislation) and then extending the baseline concept for the rest of the long-
            term projection period. (For details, see Table 1-1 on page 3.)

      That difference is usually shown as a percentage of the                  ples with income over $250,000 (those income thresh-
      present value of taxable payroll over the same period.                   olds are not indexed for inflation); the resulting revenues
      A negative actuarial balance means that outlays plus the                 will be credited to the trust fund. (The legislation also
      desired trust fund balance will exceed revenues plus the                 imposes a 3.8 percent tax on investment income for the
      current balance; its value represents the amount by which                same households, but the revenues from that provision
      revenues as a percentage of taxable payroll (the income                  will not be directed to the HI trust fund.)
      rate) would have to be increased immediately and in
      every year of the projection period to cover all projected               Using CBO’s current projections for the extended-
      costs and provide the desired balance in the trust fund at               baseline scenario, the actuarial imbalance for the HI trust
      the end of the period. Alternatively, outlays as a percent-              fund over 75 years is 2.4 percentage points, which is the
      age of taxable payroll (the cost rate) could be reduced by               difference between projected income equal to 4.2 percent
      an equivalent amount—or a combination of the two                         of taxable payroll and projected costs totaling 6.5 percent
      approaches yielding the same total effect could be used to               of taxable payroll (see Table 2-2 on page 44). Eliminating
      address the imbalance.                                                   a gap of that size would require, as an example, either an
                                                                               immediate increase in the basic rate of HI payroll taxes,
      The recent health care legislation contains numerous                     from its current 2.9 percent to 5.3 percent, or an imme-
      provisions that will affect the actuarial balance in the HI              diate cut of about one-third in spending on Part A. Given
      trust fund. Many provisions will reduce outlays for Part A               the tremendous uncertainty surrounding long-term pro-
      of Medicare. In addition, the legislation increased the HI               jections of spending for health care, however, a more use-
      payroll tax rate by 0.9 percentage points (to 3.8 percent)               ful metric may be the actuarial imbalance in the nearer
      for individuals with income over $200,000 and for cou-                   term. CBO estimates that the imbalance over 25 years is


CBO
CHAPTER TWO                                                                                                    THE LONG-TERM BUDGET OUTLOOK      43


Figure 2-5.
Mandatory Federal Spending on Health Care Under CBO’s Alternative Fiscal
Scenario and Different Assumptions About Excess Cost Growth
(Percentage of gross domestic product)
12
                                                                                                    Excess Cost Growth of
                                                                                                    2.0 Percentage Points

10
                                                                                                                        Slowing Growtha


 8                                                                                                          No Excess Cost Growth


 6


 4

 0
  2010                        2015                        2020                      2025                       2030                       2035

Source: Congressional Budget Office.
Notes: Excess cost growth refers to the extent to which the growth rate of annual health care spending per beneficiary is assumed to exceed
       the growth rate of nominal gross domestic product per capita.
         The alternative fiscal scenario incorporates several changes to current law that are widely expected to occur or that would modify
         some provisions that might be difficult to sustain for a long period. (For details, see Table 1-1 on page 3.)
a. Under the alternative fiscal scenario, the rate of excess cost growth declines each year from an initial value of 1.7 percentage points in
   2021.

0.7 percentage points under the extended-baseline sce-                    ences between the current calculations of the actuarial
nario. (The projected imbalances are larger under the                     balance and those provided last year reflect a combination
alternative fiscal scenario because Medicare spending is                  of technical revisions and changes resulting from the
higher under that scenario and tax revenues are lower.)                   recent legislation. (Changes in the economic forecast also
                                                                          affected the projections of payroll tax revenue.)
In last year’s report, the projected imbalances under the
extended-baseline scenario were substantially larger for                  The reductions in projected Part A outlays and increases
comparable periods—6.1 percent of taxable payroll over                    in projected HI revenues resulting from the legislation
75 years, and 1.3 percent over 25 years.31 As with the pro-               will significantly raise balances in the HI trust fund and
jections of overall federal health care spending, differ-                 may suggest that substantial additional resources have
                                                                          been set aside to pay for future Medicare benefits. How-
31. The imbalances that CBO projected last year were also larger than     ever, only the additional savings by the government as a
    those projected by the Medicare program’s trustees. In 2009, the      whole—from reductions in unified budget deficits—
    trustees projected an actuarial imbalance equal to 3.9 percent of     truly increase the government’s ability to pay for future
    taxable payroll over 75 years. One reason for the difference from
    CBO’s previous projection is that the trustees assumed a lower rate
                                                                          spending, whether for Medicare benefits or other pro-
    of excess cost growth in Medicare—averaging about 1 percentage        grams. At least initially, those savings will be much
    point per year over the projection period. The trustees have not      smaller than the increase in balances in the trust fund.
    yet released their 2010 estimate of the actuarial imbalance.          In particular, unified budget accounting shows that the


                                                                                                                                                 CBO
44   THE LONG-TERM BUDGET OUTLOOK


      majority of the HI trust fund savings achieved under the             Table 2-2.
      legislation through 2019 will be used to pay for other
      spending and therefore will not enhance the government’s             Financial Measures for Medicare’s
      underlying ability to pay for future Medicare benefits.              Hospital Insurance Trust Fund Under
      Although the HI trust fund has important legal meaning,              CBO’s Extended-Baseline Scenario
      in that its balances are a measure of the amounts that gov-
      ernment has the legal authority to spend under current               (Percentage of taxable payroll)
      law, it has little economic significance.32                          Projection Period              Income         Cost       Actuarial
                                                                           (Calendar Years)                 Rate         Rate       Balance
                                                                           25 Years (2010 to 2034)          3.8           4.5         -0.7
      Slowing the Growth of Health
      Care Costs                                                           50 Years (2010 to 2059)          4.0           5.5         -1.5
      In order for policymakers to put the nation on a sustain-
      able budgetary path, they will need to let revenues rise to          75 Years (2010 to 2084)          4.2           6.5         -2.4
      much higher levels (as a share of GDP) than have been
      collected historically, decrease spending significantly from         Source: Congressional Budget Office.
      projected levels, or adopt some combination of those two             Note: Over the relevant periods, the income rate is the present
      approaches. Because health care costs will account for a                   value of annual revenues (including the initial trust fund
      significant share of the federal budget under current law,                 balance) and the cost rate is the present value of annual
      and the growth of those costs is a major contributor to                    outlays (including the target trust fund balance at the end of
                                                                                 the period), each divided by the present value of taxable
      the long-term fiscal pressures facing the country, policy
                                                                                 payroll or gross domestic product. The actuarial balance is
      options to restrain the growth of federal spending on                      the difference between the income and cost rates.
      health care will continue to attract considerable interest.
                                                                           successful policies to restrain spending growth. In many
      The recently enacted health care legislation included                cases, the current health care system does not provide
      many provisions designed to reduce health care spending              incentives for doctors, hospitals, and other providers of
      (relative to prior projections), and it will be important to         health care—or their patients—to control costs.
      monitor the effects of those provisions carefully as they            Although the recent legislation took some initial steps
      are implemented. Information learned from the pilot                  toward modifying those incentives, more substantial
      programs and demonstrations mandated by the legisla-                 changes will probably be needed to significantly lower the
      tion will be particularly useful in developing and refining
                                                                           future trajectory of health care spending. For example,
      future policies.
                                                                           given the key role of medical technology in contributing
      More generally, making appropriate changes in financial              to spending growth, slowing the growth of spending over
      incentives will probably be critical in developing                   the long term will probably require decreasing the pace of
                                                                           adopting new treatments and procedures or limiting the
                                                                           breadth of their application. Such changes need not
      32. See Congressional Budget Office, letter to the Honorable Jeff
          Sessions providing additional information on the effect of the   involve explicit rationing but could occur as a result of
          Patient Protection and Affordable Care Act on the Hospital       market mechanisms or policy changes that affect the
          Insurance Trust Fund (January 22, 2010).                         incentives to develop and use more costly treatments.


CBO
CHAPTER


                                                         3
                              The Long-Term Outlook for
                                    Social Security


T      he federal government spends more on Social
Security than it does on any other single program.
                                                              dren of those retired workers. In general, workers qualify
                                                              for retirement benefits if they are age 62 or older and
Created in 1935, the program now consists of two parts:       have paid sufficient Social Security taxes for at least 10
Old-Age and Survivors Insurance (OASI), which pays            years. However, Social Security also provides other types
benefits to retired workers and to their dependents and       of benefits. The program pays benefits to survivors of
survivors; and Disability Insurance (DI), which makes         deceased workers, who make up 12 percent of beneficia-
payments to disabled workers who have not reached full        ries. In addition, workers under the full retirement age
retirement age (the age of eligibility for full retirement    who have had to limit their employment because of a
benefits) and to their dependents. In all, about 53 million   physical or mental disability can qualify for DI benefits,
people currently receive Social Security benefits. The        in many cases with a shorter employment history. Dis-
Congressional Budget Office estimates that outlays for        abled workers and their spouses and children account for
that program in fiscal year 2010 will total about $700 bil-   19 percent of beneficiaries.1 (Retired workers and their
lion, accounting for one-fifth of all federal spending.       dependents receive 73 percent of Social Security benefits,
                                                              survivors of deceased workers receive 11 percent, and
During the program’s first four decades, spending for         disabled workers and their spouses and children receive
Social Security increased relative to the size of the econ-   16 percent of benefits.)
omy, reaching about 4 percent of gross domestic product
in the mid-1970s. That increase was caused largely by         The benefits that retired or disabled workers initially
repeated expansions of the program. Costs rose to             receive are based on their individual earnings histories.
4.9 percent of GDP in 1983, the year that the last major      Both those earnings and the formula used to compute
piece of legislation affecting Social Security was enacted.   initial benefits are indexed to changes in average annual
Between 1984 and 2008, spending for Social Security           earnings for the workforce as a whole. In subsequent
fluctuated between 4.2 percent and 4.6 percent of GDP.        years, a cost-of-living adjustment is applied to the initial
During the recent recession, GDP contracted and Social        benefit to reflect annual growth in consumer prices.
Security outlays increased more rapidly than they would
have with stable economic growth because the number of        For workers born before 1938, the full retirement age is
OASI and DI claimants increased as the job market dete-       65. Under current law, that age is gradually increasing
riorated. As a result, outlays rose to 4.8 percent of GDP     and will be 67 for people born in 1960 or later. The age
in 2009 (see Figure 3-1). CBO anticipates that, if the full   at which workers may start receiving reduced benefits,
benefits specified under current law are paid, spending       62, remains the same.
for Social Security will reach 6.2 percent of GDP in 2035
and remain close to that figure in ensuing decades.           The Social Security Administration estimates that work-
                                                              ers who retire at age 65 in 2010 and who had average
                                                              annual earnings—earnings equal to the average earnings
How Social Security Works
Social Security is often characterized as a retirement        1. See Congressional Budget Office, Social Security Disability Insur-
program because a majority of its beneficiaries—about            ance: Participation Trends and Their Fiscal Implications, Issue Brief
69 percent—are retired workers or the spouses and chil-          (forthcoming).


                                                                                                                                         CBO
46   THE LONG-TERM BUDGET OUTLOOK


      Figure 3-1.
      Spending for Social Security Under CBO’s Long-Term Budget Scenarios
      (Percentage of gross domestic product)
      7
                                    Actual    Projected
      6

      5

      4

      3

      2

      1

      0
       2000               2005                2010               2015               2020               2025                2030               2035

      Source: Congressional Budget Office.
      Note: Projected spending for Social Security is identical under CBO’s two long-term budget scenarios, the extended-baseline scenario and
            the alternative fiscal scenario. The extended-baseline scenario adheres closely to current law, following CBO’s 10-year baseline budget
            projections through 2020 (with adjustments for the recently enacted health care legislation) and then extending the baseline concept
            for the rest of the long-term projection period. The alternative fiscal scenario incorporates several changes to current law that are
            widely expected to occur or that would modify some provisions that might be difficult to sustain for a long period. (For details, see
            Table 1-1 on page 3.)

      of all workers in the country—throughout their career                    rity benefits. Revenues from both sources are credited to
      will qualify for an annual benefit of about $16,500. That                the two Social Security trust funds (the Old-Age and Sur-
      amount will replace approximately 40 percent of their                    vivors Insurance Trust Fund and the Disability Insurance
      preretirement earnings. In coming decades, the replace-                  Trust Fund). Social Security benefits and the program’s
      ment rate will be lower for workers with average earnings                administrative costs are paid from those funds; benefit
      who retire at age 65, mainly as a result of the scheduled                payments represent roughly 99 percent of total outlays
      increase in the full retirement age. Because initial benefits            for the program. The balances currently credited to those
      are based on beneficiaries’ previous earnings, indexed to                funds have accumulated over many years, during which
      overall average wages, and because wages grow over time,                 revenues received by the trust funds exceeded the benefit
      the real (inflation-adjusted) value of those benefits will               payments from those trust funds. Interest on those bal-
      continue to rise.                                                        ances is credited to the trust funds, but because those
                                                                               interest transactions represent payments from one part
      The Social Security program is funded by two sources of                  of the government (the general fund of the Treasury) to
      dedicated tax revenues. Roughly 97 percent of those reve-                another (the Social Security trust funds), they do not
      nues derive from a payroll tax—currently, 12.4 percent of                affect federal budget deficits or surpluses.
      earnings—that is split evenly between workers and their
      employers. Only earnings up to a maximum annual
      amount ($106,800 in 2010) are subject to the payroll tax.                The Outlook for Social Security
      That amount, referred to as the taxable maximum, gener-                  Spending and Revenues
      ally increases each year at the same rate as average earn-               The cost of the Social Security program will rise signifi-
      ings in the United States. The remaining share of tax rev-               cantly in coming decades—a development that analysts
      enues—3 percent—is collected from the income taxes                       have long foreseen. Average benefits per beneficiary typi-
      that higher-income beneficiaries pay on their Social Secu-               cally grow when the economy does because the earnings


CBO
CHAPTER THREE                                                                                                THE LONG-TERM BUDGET OUTLOOK       47


Figure 3-2.
The Population Age 65 or Older as a Percentage of the Population Ages 20 to 64
(Percent)
40
                                 Actual Projected
35

30

25

20

15

10

 5

 0
  2000                2005               2010                2015             2020               2025                2030               2035

Source: Congressional Budget Office.

on which those benefits are based also increase.2 In addi-               relative to the size of the economy. As a result, by the
tion, as members of the baby-boom generation reach                       latter part of this decade, outlays will regularly exceed
retirement age, and as longer life spans lead to longer                  revenues, excluding interest, if the benefits specified
retirements, a significantly larger share of the population              under current law are paid.
will draw Social Security benefits.3 As a result, the total
dollar amount of benefits scheduled to be paid under                     According to CBO’s projections, the number of people
current law will grow faster than the economy.                           age 65 or older will increase by 90 percent between now
                                                                         and 2035, compared with an increase of just 12 percent
In 2010, for the first time since the enactment of the                   over that period in the number of people ages 20 to 64.
Social Security Amendments of 1983, annual outlays for                   Today, that older population is one-fifth the size of the
the program will exceed annual revenues, excluding inter-                younger population; at those rates of growth, it will be
est credited to the trust funds, CBO projects. Although                  more than one-third the size of the younger group by
Social Security’s revenues are likely to be greater than out-            2035 (see Figure 3-2). About 92 million people will be
lays again for the next few years, that relationship is not
                                                                         collecting Social Security benefits in 2035, CBO projects,
expected to persist. As an increasing number of baby
                                                                         compared with 53 million who receive benefits today.
boomers reach retirement age, outlays will increase
                                                                         Furthermore, the average benefit will have grown nearly
                                                                         as fast as GDP per person. CBO therefore estimates that,
2. CBO projects that the continuing rapid growth of health care
   costs will reduce the portion of compensation that workers receive
                                                                         unless changes are made to Social Security, spending for
   in wages subject to the Social Security payroll tax. That reduction   the program will rise from 4.8 percent of GDP today to
   will lower the growth of both Social Security revenues and benefits   6.2 percent by 2035. Spending for Social Security will
   relative to what would occur if health care costs grew more slowly.   then dip slightly to 5.9 percent as members of the large
3. The outlook for the baby boomers’ financial situation in retire-      baby-boom generation die, but it will later turn upward
   ment is summarized in Congressional Budget Office, The Retire-        again—reaching 6.3 percent of GDP in 2080—as a result
   ment Prospects of the Baby Boomers, Issue Brief (March 18, 2004);
                                                                         of beneficiaries’ increasing life spans.4
   for details, see Congressional Budget Office, Baby Boomers’
   Retirement Prospects: An Overview (November 2003). See also
   Congressional Budget Office, Will the Demand for Assets Fall          4. For details on CBO’s methodology for projecting Social Security’s
   When the Baby Boomers Retire?, Background Paper (September               revenues and outlays, see CBO’s Long-Term Projections for Social
   2009).                                                                   Security: 2009 Update (August 2009).


                                                                                                                                                CBO
48   THE LONG-TERM BUDGET OUTLOOK


      CBO’s projections of outlays for Social Security are the                 estimates that over the next 75 years, dedicated reve-
      same under both of the scenarios discussed in this                       nues—payroll taxes and taxes on benefits—will fall short
      report—the extended-baseline scenario and the alterna-                   of scheduled benefits in Social Security by 1.6 percent of
      tive fiscal scenario—but projections of Social Security                  taxable payroll under the extended-baseline scenario (see
      revenues depend upon which of those scenarios is used.                   Table 3-1). That shortfall equals 0.6 percent of GDP. In
      The revenues generated by payroll taxes are identical                    other words, to bring the program into actuarial balance
      under the two scenarios; however, projections of revenues                over the next 75 years, payroll taxes could be immediately
      derived from the taxation of Social Security benefits are                increased by 1.6 percent of taxable payroll and kept at
      higher under the extended-baseline scenario.5 Under that                 that higher rate, or scheduled benefits could be reduced
      scenario, which is based on the assumption that provi-                   by an equivalent amount. Under the alternative fiscal
      sions of current law remain unchanged, both the number
                                                                               scenario, the shortfall would be 2.1 percent of taxable
      of Social Security beneficiaries subject to taxes on benefits
                                                                               payroll, or 0.8 percent of GDP.
      and average income tax rates would increase.6 As a result,
      income taxes on Social Security benefits would grow to                   Another commonly used measure of the program’s sus-
      4 percent of benefits in 2016, 6 percent in 2035, and                    tainability is the trust funds’ exhaustion date, which CBO
      9 percent by 2080. Under the alternative fiscal scenario,
                                                                               projects will be 2039 under the extended-baseline sce-
      which is based on CBO’s assumption that tax rates would
                                                                               nario and 2037 under the alternative fiscal scenario.8
      be lower, the income taxes on Social Security benefits that
                                                                               Once the trust funds are depleted, the Social Security
      are credited to the Social Security trust funds would equal
                                                                               Administration would no longer have legal authority to
      4 percent of benefits in 2020 and later, CBO projects.
      Consequently, the projections of Social Security’s finances              pay benefits. In the years following the exhaustion of the
      are somewhat less favorable under the alternative fiscal                 trust funds, annual outlays would therefore be limited to
      scenario than they are under the extended-baseline                       annual revenues. As a result, the benefits that can be paid
      scenario.                                                                under current law are substantially lower than the bene-
                                                                               fits that are scheduled to be paid. Thus, benefits can be
      A commonly used measure of the sustainability of a pro-                  projected in two ways: as “payable benefits,” which reflect
      gram that has a trust fund and a dedicated revenue source                the limits imposed by the availability of balances in the
      is its actuarial balance—that is, the sum of the present                 trust funds; or as “scheduled benefits,” which reflect the
      value of revenues and the current trust fund balance                     benefit formulas specified in law, regardless of the trust
      minus the sum of the present value of outlays and a                      funds’ balances. This report uses the latter approach,
      target balance at the end of the period—over a specified                 which is consistent with a long-standing statutory
      period.7 For Social Security, that difference is traditionally           requirement that CBO, in its baseline projections,
      presented as a percentage of the present value of taxable                assume that laws are implemented as specified and that
      payroll over the period under consideration. CBO                         funding for entitlement programs is adequate to make all
                                                                               payments.9
      5. Those projections do not incorporate the economic effects of the
         two scenarios.
                                                                               8. CBO anticipates that the Disability Insurance trust fund will be
      6. For information about CBO’s projections of total income taxes            exhausted in 2018 (under both scenarios) and that the Old-Age
         under the two scenarios, see Chapter 4. For details on the impact        and Survivors Insurance trust fund will be exhausted in 2042
         of differing assumptions about income taxes on Social Security           under the extended-baseline scenario and 2040 under the alterna-
         benefits, see Congressional Budget Office, The Outlook for Social        tive fiscal scenario. However, this study focuses on the combined
         Security (June 2004), Box 3-1, pp. 24–25.                                trust funds. In 1994, the Social Security Trustees’ Report pro-
                                                                                  jected that the DI trust fund would be exhausted in 1995. That
      7. To account for the difference between the trust fund’s current bal-
                                                                                  outcome was prevented by legislation that redirected revenue from
         ance and the desired balance at the end of the period, the balance
                                                                                  the OASI trust fund to the DI trust fund. In part because of that
         at the beginning of the time frame is added to the projected reve-
                                                                                  experience, it is a common analytical convention to consider the
         nues and an additional year of costs at the end of the period is
                                                                                  DI and OASI trust funds as combined.
         added to projected outlays. The present value is a single number
         that expresses a flow of current and future income or payments in     9. See section 257 of the Balanced Budget and Emergency Deficit
         terms of an equivalent lump sum received or paid today.                  Control Act of 1985, P.L. 99-177, as amended; 2 U.S.C. 907.


CBO
CHAPTER THREE                                                                                                 THE LONG-TERM BUDGET OUTLOOK        49


Table 3-1.
Financial Measures for Social Security Under CBO’s Long-Term
Budget Scenarios
Projection Period                                                                                                                Actuarial
(Calendar years)                                       Income Rate                          Cost Rate                            Balance

                                                                               As a Percentage of Taxable Payroll
                                                                                   Extended-Baseline Scenario
25 Years (2010 to 2034)                                   15.2                                 15.1                                  0.2
50 Years (2010 to 2059)                                   14.6                                 15.7                                 -1.2
75 Years (2010 to 2084)                                   14.4                                 16.0                                 -1.6

                                                                                    Alternative Fiscal Scenario
25 Years (2010 to 2034)                                   15.1                                 15.1                                    *
50 Years (2010 to 2059)                                   14.2                                 15.7                                 -1.5
75 Years (2010 to 2084)                                   14.0                                 16.0                                 -2.1

                                                                         As a Percentage of Gross Domestic Product
                                                                                   Extended-Baseline Scenario
25 Years (2010 to 2034)                                     5.7                                 5.6                                  0.1
50 Years (2010 to 2059)                                     5.3                                 5.8                                 -0.4
75 Years (2010 to 2084)                                     5.2                                 5.8                                 -0.6

                                                                                    Alternative Fiscal Scenario
25 Years (2010 to 2034)                                     5.6                                 5.6                                    *
50 Years (2010 to 2059)                                     5.2                                 5.8                                 -0.5
75 Years (2010 to 2084)                                     5.1                                 5.9                                 -0.8

Source: Congressional Budget Office.
Notes: Over the relevant periods, the income rate is the present value of annual revenues (including the initial trust fund balance) and the
       cost rate is the present value of annual outlays (including the target trust fund balance at the end of the period), each divided by the
       present value of taxable payroll or gross domestic product. The actuarial balance is the difference between the income and cost rates.
       The extended-baseline scenario adheres closely to current law, following CBO’s 10-year baseline budget projections through 2020
       (with adjustments for the recently enacted health care legislation) and then extending the baseline concept for the rest of the long-
       term projection period. The alternative fiscal scenario incorporates several changes to current law that are widely expected to occur or
       that would modify some provisions that might be difficult to sustain for a long period. (For details, see Table 1-1 on page 3.)
       * = between -0.05 percent and 0.05 percent.


                                                                                                                                                  CBO
50   THE LONG-TERM BUDGET OUTLOOK


      Changes in CBO’s Long-Term                                     Three broad approaches for constraining the rise in
                                                                     spending for Social Security have received considerable
      Social Security Projections                                    attention. Those approaches, which could be imple-
      Since June 2009                                                mented separately or in combination, are as follows:
      The shortfalls for Social Security that CBO is currently
      projecting are larger than the ones projected in last year’s   B   Reduce the size of the initial payments that new Social
      Long-Term Budget Outlook. The 75-year imbalance has                Security beneficiaries are scheduled to receive;
      increased from 1.3 percent of taxable payroll under the
      extended-baseline scenario to 1.6 percent and from             B   Raise the age specified in law—currently 67 for people
      1.5 percent of taxable payroll under the alternative fiscal        born in 1960 or later—at which workers become eligi-
      scenario to 2.1 percent. Those differences are the result of       ble for full retirement benefits (thereby reducing the
      changes in both projected outlays and projected revenues.          amount of the initial benefit received at any specific
      The projected 75-year cost rate—a measure of outlays—              age at which a claimant chooses to start receiving
      is about 2 percent higher under both scenarios, owing to           benefits); or
      near-term economic weakness, slightly lower projections
      of real wage growth, and technical modeling changes.           B   Reduce the annual cost-of-living adjustment that
      The projected 75-year income rate—a measure of Social              beneficiaries receive once they become eligible for
                                                                         benefits.
      Security revenues—is about 1 percent lower than in 2009
      under the alternative fiscal scenario because taxes on
                                                                     Alternatively, or in addition, Social Security’s finances
      benefits are projected to be lower as a share of benefits.     could be improved by increasing the revenues flowing
      However, the projected income rate is slightly higher than     into the trust funds—for example, by raising the payroll
      in 2009 under the extended-baseline scenario because           tax rate or subjecting more earnings to the payroll tax.
      taxes on benefits are projected to be higher as a share        Policymakers could also restore the system to long-term
      of benefits.                                                   actuarial balance by dedicating more general fund reve-
                                                                     nues to Social Security, but that action would have no
                                                                     effect on the overall federal budget.
      Slowing the Growth of Social
      Security Spending                                              People generally consider the size of their expected Social
      CBO has recently evaluated a number of different policy        Security benefits when deciding how much to save for
      options for changing Social Security and will present the      retirement and how long to work. Those benefits are a
      results of that analysis in a separate report. That report     major source of income for many people, and enacting
      focuses on how the options, if implemented, would affect       any reductions in benefits well in advance of implementa-
      Social Security’s finances and alter the distribution of       tion would give people time to respond by adjusting their
      benefits paid to and taxes paid by people in various           plans for saving and retirement.
      groups distinguished by household income and year of
      birth.10 Among the options considered are a variety of         10. See Congressional Budget Office, Social Security Policy Options
      ways of reducing benefits and raising payroll taxes.               (forthcoming).


CBO
CHAPTER


                                                                 4
                                  The Long-Term Outlook for
                                          Revenues


F     ederal revenues come from a variety of sources,
including individual and corporate income taxes, payroll
                                                                      legislation—the Patient Protection and Affordable Care
                                                                      Act (P.L. 111-148), as amended by the Health Care and
taxes, excise taxes, estate and gift taxes, customs duties,           Education Reconciliation Act of 2010 (P.L. 111-152)—
and other taxes and fees. Currently, proceeds from indi-              that was enacted after CBO’s March projections were
vidual income taxes and payroll taxes account for about               completed.
85 percent of the federal government’s revenues.
                                                                      Under the extended-baseline scenario, revenues would
Predicting the amount of revenues that will be collected              rise considerably over time as a share of gross domestic
in the future is difficult because such receipts are sensitive        product because of the various tax reductions that are
to economic developments and because policymakers                     scheduled to expire and the tax increases enacted in the
frequently make changes to tax law. This analysis focuses             health care legislation that are scheduled to go into effect.
on two sets of assumptions about future policy—the                    In addition, the economic recovery and the interaction of
extended-baseline scenario and the alternative fiscal                 the tax system with cumulative inflation and real (infla-
scenario.                                                             tion-adjusted) growth in income would produce higher
                                                                      average tax rates—that is, taxes as a share of income. As a
The extended-baseline scenario is based on the assump-                result, revenues would rise from 15 percent of GDP in
tion that the provisions of current law remain in effect.             2010 to 21 percent in 2020 and to 23 percent in 2035,
Thus, under this scenario, the tax cuts enacted in the                for a total increase of roughly 8 percentage points over
Economic Growth and Tax Relief Reconciliation Act of                  the next 25 years (see Figure 4-1). By 2035, the tax sys-
2001 (EGTRRA) and the Jobs and Growth Tax Relief                      tem would be quite different from what it is today.
Reconciliation Act of 2003 (JGTRRA) would expire as                   Households at all points in the income scale would pay a
scheduled in 2011; the tax relief provisions in the Ameri-            higher share of their income in taxes than similar house-
can Recovery and Reinvestment Act of 2009 (ARRA,                      holds pay today and a much larger share of households—
Public Law 111-5) would expire as scheduled in 2010 or                nearly half—would be subject to the AMT.2
2011; and the exemption amounts for the individual
alternative minimum tax would remain as they were at                  The alternative fiscal scenario, by contrast, embodies sev-
the beginning of 2010.1 The same assumptions were                     eral possible changes to current law that would continue
incorporated in the Congressional Budget Office’s March               certain tax policies that people have grown accustomed
2010 baseline projections. However, the estimates in this             to—because those policies are in place now or were in
report differ from those projections because they also                place until recently. In particular, most tax cuts enacted
reflect the tax increases included in recent health care              under EGTRRA and JGTRRA, which are currently

1. In recent years, the Congress has enacted temporary increases in   2. The long-term revenue projections reflect the assumption that
   the AMT exemption amounts, but the last increase expired at the       economic conditions are stable after 2020 and thus exclude the
   end of 2009.                                                          effects of rising taxes on people’s behavior.


                                                                                                                                          CBO
52   THE LONG-TERM BUDGET OUTLOOK


      Figure 4-1.
      Total Revenues Under CBO’s Long-Term Budget Scenarios
      (Percentage of gross domestic product)
      25
                                      Actual   Projected
                                                         Extended-Baseline Scenario
      20
                                                                                                           Alternative Fiscal Scenario

      15


      10


        5


        0
         2000               2005               2010               2015               2020                2025               2030               2035

      Source: Congressional Budget Office.
      Note: The extended-baseline scenario adheres closely to current law, following CBO’s 10-year baseline budget projections through 2020
            (with adjustments for the recently enacted health care legislation) and then extending the baseline concept for the rest of the long-
            term projection period. The alternative fiscal scenario incorporates several changes to current law that are widely expected to occur or
            that would modify some provisions that might be difficult to sustain for a long period. (For details, see Table 4-1.)

      scheduled to expire in 2011, are assumed to remain in                    so as to maintain total revenues at a constant share of
      place. Those extensions would apply primarily to middle-                 GDP.
      and low-income taxpayers; certain provisions applying to
      high-income taxpayers (married couples with adjusted                     As a result, revenues as a share of GDP after 2020 are
      gross income above $250,000 and singles with income                      roughly 1 percentage point higher under the alternative
      above $200,000) would not be extended. Also under this                   fiscal scenario than the average share observed over the
      scenario, the tax rates and effective exemption amounts                  past 40 years. Revenues as a share of GDP have moved
      for the estate and gift tax that were in effect during 2009              above or below that average between 1970 and 2010 but
      (and expired at the end of that year) are assumed to be                  typically return to somewhere near the average, suggest-
      reinstated, and tax relief from the AMT is assumed to be                 ing that changes in policy have offset other aspects of the
      extended. Versions of some of these changes, such as                     tax system that otherwise would have tended to increase
      those related to the alternative minimum tax, have regu-
                                                                               the revenue share over time. In the alternative fiscal
      larly been enacted in the past. Those and certain other
                                                                               scenario, CBO assumed that those sorts of policy changes
      changes assumed in the scenario—such as changes related
                                                                               would continue.
      to the 2001 and 2003 tax cuts—are widely expected to be
      made in some form over the next few years. If they are,
                                                                               Revenues as a share of GDP would increase from 15 per-
      they will receive special treatment under the new Statu-
                                                                               cent of GDP in 2010 to just over 19 percent in 2020 and
      tory Pay-As-You-Go Act of 2010 (Public Law 111-139).
                                                                               would remain constant at about 19 percent of GDP
      (See Box 1-1 on page 4 for details.)
                                                                               thereafter. Revenues projected under the alternative fiscal
      In constructing the alternative fiscal scenario, CBO pro-                scenario are considerably lower than those estimated
      jected revenues through 2020 on the basis of those spe-                  under the extended-baseline scenario—by about
      cific policy assumptions; after 2020, the scenario is based              2 percent of GDP in 2020 and by about 4 percent of
      on the assumption that tax policy would evolve over time                 GDP in 2035.


CBO
CHAPTER FOUR                                                                                       THE LONG-TERM BUDGET OUTLOOK       53


Figure 4-2.
Revenues, by Source, 1970 to 2009
(Percentage of gross domestic product)
25


20
                                                                   Total


15


10                                                    Individual Income Taxes


 5                                                                              Social Insurance (Payroll) Taxes
                                                 Corporate Income Taxes

 0
  1970     1973      1976     1979     1982    1985     1988     1991      1994      1997      2000       2003      2006      2009

Source: Congressional Budget Office.


Revenues Over the Past 40 Years                                 excise taxes have diminished in magnitude relative to
Over the past 40 years, total federal revenues have ranged      GDP as the general level of prices has risen. In contrast,
from 14.8 percent to 20.6 percent of GDP, averaging             in the absence of legislative reductions to individual
18.1 percent, with no evident trend over time (see              income taxes, receipts from individual income taxes have
Figure 4-2). During that period, however, the various           tended to grow relative to GDP. That increase has
sources of revenue have changed in importance. Individ-         occurred because rising income tends to push people into
ual income taxes, which account for about half of all reve-     higher tax brackets. Before 1984, when none of the
nues now, have varied between about 6 percent and               parameters of the individual income tax were indexed for
10 percent of GDP. Social insurance taxes, which gener-         inflation, inflation by itself caused an increase in revenues
ate about one-third of total revenues now, have grown           as a greater share of income was taxed at higher rates.3
from 4 percent to over 6 percent of GDP. (Those taxes           Even after 1984, when many of the parameters of the tax
consist primarily of payroll taxes credited to the Social       system were first indexed for inflation, growth in real
Security and Medicare Hospital Insurance Trust Funds.)          income has caused a greater share of income to be taxed
Corporate income taxes contribute less now than they did        at higher rates (and not all of the parameters of the tax
in earlier years: In 2009, they represented about 1 percent     system are indexed for inflation, so rising prices have con-
of GDP, down from 3 percent in 1970. Revenues from              tinued to have some effect).
other sources have varied between roughly 1 percent and
3 percent of GDP over the past 40 years.                        Tax revenues as a share of GDP have also varied over time
                                                                as a result of legislative changes. In the past 40 years, law-
Some of the variation in the composition of total tax           makers have enacted at least a dozen pieces of legislation
revenues has stemmed from the interaction between the           that have raised or lowered revenues by at least 0.5 per-
tax code and changes in the economy. For example, many          cent of GDP per year.
excise taxes are levied on the quantity of a good pur-
chased (for instance, cents per gallon of gasoline) as          3. The parameters of the tax system are the amounts that define the
opposed to a percentage of the price paid. Because those           various tax brackets, the personal exemption and standard deduc-
levies are not indexed for inflation, revenues derived from        tion amounts, and tax rates.


                                                                                                                                      CBO
54   THE LONG-TERM BUDGET OUTLOOK


      Table 4-1.
      Assumptions About Revenues Underlying CBO’s Long-Term Budget Scenarios
                                  Extended-Baseline Scenario                               Alternative Fiscal Scenario
      Individual Income Taxes     As scheduled under current law                           Through 2020, tax cuts from EGTRRA and JGTRRA are extended
                                                                                           (except for rate reductions that apply to high-income taxpayers)
                                                                                           and AMT relief is extended; thereafter, individual income taxes
                                                                                           are adjusted to keep total revenues constant as a share of GDPa

      Payroll Taxes               As scheduled under current law                           As scheduled under current law

      Corporate Income Taxes      As scheduled under current law through 2020; remaining   As scheduled under current law through 2020; remaining
                                  constant as a share of GDP thereafter                    constant as a share of GDP thereafter

      Excise Taxes                As scheduled under current law                           As scheduled under current law through 2020; remaining
                                                                                           constant as a share of GDP thereafter

      Estate and Gift Taxes       As scheduled under current law                           2009 tax rates and exemption amount (adjusted for inflation)
                                                                                           continue through 2020; revenues are constant as a share of
                                                                                           GDP thereaftera

      Other Sources of Revenue    As scheduled under current law through 2020; remaining   As scheduled under current law through 2020; remaining
                                  constant as a share of GDP thereafter                    constant as a share of GDP thereafter

      Source: Congressional Budget Office.
      Notes: The extended-baseline scenario adheres closely to current law, following CBO’s 10-year baseline budget projections through 2020
             (with adjustments for the recently enacted health care legislation) and then extending the baseline concept for the rest of the long-
             term projection period. The alternative fiscal scenario incorporates several changes to current law that are widely expected to occur or
             that would modify some provisions that might be difficult to sustain for a long period. For details, see Table 1-1.
              EGTRRA = Economic Growth and Tax Relief Reconciliation Act of 2001; JGTRRA = Jobs and Growth Tax Relief Reconciliation Act of
              2003; AMT = alternative minimum tax; GDP = gross domestic product.
      a. These assumptions are consistent with extending through 2020 provisions that are the basis for “current-policy” adjustments specified in
         the Statutory Pay-As-You-Go Act of 2010—with the exception that the alternative fiscal scenario assumes that all of the policies would
         continue through 2020, whereas the act’s “current-policy” adjustments for the estate tax parameters and the AMT end after 2011 (see
         Box 1-1 on page 4).

      Revenue Projections Under CBO’s                                             baseline, the scenario is based on the assumption that
                                                                                  certain tax provisions will expire as scheduled and new
      Long-Term Budget Scenarios
      The extended-baseline scenario and the alternative fiscal                   provisions of law will go into effect as scheduled. The
      scenario embody two possible paths for revenues over                        specific assumptions are the following:
      future decades. CBO’s assumptions about particular
      revenue sources under the two scenarios are summarized                      B   The tax provisions of the Economic Growth and Tax
      in Table 4-1.                                                                   Relief Reconciliation Act of 2001, the Jobs and
                                                                                      Growth Tax Relief Reconciliation Act of 2003, and
      The Extended-Baseline Scenario                                                  the American Recovery and Reinvestment Act of 2009
      The extended-baseline scenario follows current law. That                        will expire as scheduled;
      scenario uses the 10-year baseline projections for revenues
      that CBO published in March 2010, after incorporating                       B   The AMT exemption amounts in effect at the begin-
      the estimated effects of the recently enacted health care                       ning of 2010 will remain at those levels, and the
      legislation (which are unchanged from the estimates                             parameters of the AMT will not be indexed for
      CBO released in March). As was the case with the March                          inflation; and


CBO
CHAPTER FOUR                                                                                                   THE LONG-TERM BUDGET OUTLOOK       55


Table 4-2.
Sources of Growth in Total Revenues as a Share of GDP Between 2010 and 2035
Under CBO’s Extended-Baseline Scenario
                                                                                                                            Percentage
Source of Growth                                                                                                             of GDP
Impact of Economic Recovery on Individual Income Taxes                                                                          0.6
Expiring Individual Income Tax Provisions and the AMT                                                                            2.7
Other Structural Features of the Tax System (Including real bracket creep)                                                      2.6
Demographic Trends                                                                                                              0.5
Health Care Legislation                                                                                                         1.2
Other Factors (Including corporate, excise, and estate and gift taxes)                                                          0.8
                                                                                                                                ___
    Total Growth in Revenues as a Share of GDP                                                                                  8.4

Source: Congressional Budget Office.
Notes: The extended-baseline scenario adheres closely to current law, following CBO’s 10-year baseline budget projections through 2020
       (with adjustments for the recently enacted health care legislation) and then extending the baseline concept for the rest of the long-
       term projection period. The alternative fiscal scenario incorporates several changes to current law that are widely expected to occur or
       that would modify some provisions that might be difficult to sustain for a long period. (For details, see Table 4-1.)
        “Real bracket creep” refers to the phenomenon in which rising real (inflation-adjusted) income causes an ever-larger proportion of
        income to be subject to higher tax brackets.
        GDP = gross domestic product; AMT = alternative minimum tax.

B   Tax increases scheduled to go into effect in future                   EGTRRA and JGTRRA; the growing impact of the
    years as a result of recently enacted health care legisla-            AMT; other structural features of the income tax system;
    tion will be implemented as specified in current law.                 and demographic trends. Total revenues will also increase
    Such increases include the new taxes on earnings and                  relative to GDP because of additional revenues from
    investment income (beginning in 2013) and the new                     other tax sources as a result of the recent health care legis-
    tax on employment-based health insurance plans with                   lation, the reinstatement of the estate tax after 2010, and
    high premiums (beginning in 2018).                                    certain other factors.

Under the extended-baseline scenario, current law would                   Economic Recovery. CBO projects that revenues will
remain in place indefinitely after 2020, extending those                  grow faster than GDP in 2011 and 2012 as the economy
baseline assumptions for the rest of the long-term projec-                continues to recover, with most of that growth coming
tion period.                                                              from individual income taxes. Certain sources of income
                                                                          that had been unusually low during the downturn (for
Under those assumptions, tax revenues would sharply                       instance, capital gains realizations) are expected to recover
increase in the next few years and then steadily rise there-              and return to levels consistent with an economy slowly
after relative to GDP. The individual income tax system                   moving closer to its long-term growth path. The effects of
will be responsible for much of the increase in the ratio of              the recovery will increase revenues from individual
total revenues to GDP because of the various ways in                      income taxes as a share of GDP by 0.6 percentage points,
which its structure interacts with the economy. Under the                 CBO estimates (see Table 4-2).
extended-baseline scenario, individual income tax
receipts would rise by about 6.5 percentage points of                     Expiring Tax Provisions and the AMT. Certain aspects of
GDP between 2010 and 2035 and by a smaller amount                         current tax law will also cause an increase in individual
over the remainder of the long-term forecast horizon.                     income tax revenues relative to GDP. Most of the provi-
That increase in individual income tax revenues reflects a                sions in EGTRRA and JGTRRA are scheduled to expire
number of factors, including the anticipated economic                     after December 31, 2010, as are most of the tax provi-
recovery; the expiration of tax-relief provisions in                      sions in ARRA. When that happens, certain features of


                                                                                                                                                  CBO
56   THE LONG-TERM BUDGET OUTLOOK


      Figure 4-3.
      Individual Income Tax Revenues Under CBO’s Extended-Baseline Scenario and
      Two Variants
      (Percentage of gross domestic product)
      14

      13

      12                                                         Extended-Baseline Scenario

      11
                                                                                                    Variant 1: EGTRRA and JGTRRA Extended
      10

       9
                                                   Variant 2: EGTRRA, JGTRRA, and AMT Relief Extended
       8

       7

       6
       0
        2010                       2015                       2020                       2025                       2030                       2035

      Source: Congressional Budget Office.
      Notes: The extended-baseline scenario adheres closely to current law, following CBO’s 10-year baseline budget projections through 2020
             (with adjustments for the recently enacted health care legislation) and then extending the baseline concept for the rest of the long-
             term projection period. (For details, see Table 4-1.)
               EGTRRA = Economic Growth and Tax Relief Reconciliation Act of 2001; JGTRRA = Jobs and Growth Tax Relief Reconciliation Act of
               2003; AMT = alternative minimum tax.

      the tax code will revert to prior law: Tax rates will rise, the          time, more taxpayers will be subject to the AMT and that
      value of some tax credits will decrease, other credits will              tax will claim a larger share of GDP.
      expire, and thresholds for certain tax rates will change.
      Those changes will increase receipts as a share of GDP in                The effects of the expiration of EGTRRA and JGTRRA
      2011 and beyond.                                                         and of the growing reach of the AMT can be identified
                                                                               by comparing CBO’s projection of individual income tax
      Another factor that will increase revenues relative to GDP               revenues under the extended-baseline scenario, which fol-
      is the growing impact of the AMT. The alternative mini-                  lows current law, with two alternatives. The first is based
      mum tax is a parallel individual income tax system that                  on the assumption that policymakers would deviate from
      provides fewer exemptions, deductions, and rates than                    current law by permanently extending the tax provisions
      the regular income tax. Households must calculate the                    of EGTRRA and JGTRRA but would not index the
      amount they owe under both the AMT and the                               AMT for inflation; the second reflects the assumption
      regular income tax and then pay the higher of the two                    that policymakers would extend those tax provisions and
      amounts.4 The parameters that determine the amount                       also index the AMT.
      owed under the AMT are not indexed for inflation.
                                                                               Relative to the extended-baseline scenario, extending
      Therefore, as inflation increases people’s income over
                                                                               EGTRRA and JGTRRA alone would lower individual
                                                                               income tax revenues—and thus total revenues—by
      4. Technically, a taxpayer owes the regular income tax plus any
                                                                               0.9 percent of GDP in 2012 and by 0.7 percent in 2035
         amount that, under the AMT, exceeds the regular tax. For more
         information on the AMT, see Congressional Budget Office,              (see Figure 4-3). That decline in revenues as a share of
         The Individual Alternative Minimum Tax, Issue Brief (January 15,      GDP would lessen over time because of the growth of
         2010).                                                                the AMT. As a greater share of individual income taxes


CBO
CHAPTER FOUR                                                                                           THE LONG-TERM BUDGET OUTLOOK         57


was paid through the AMT, the effect of extending                 benefit plans is not taxed when it is earned. As baby
EGTRRA and JGTRRA would decline because many of                   boomers withdraw money from retirement accounts and
the provisions of those laws do not benefit taxpayers who         receive pension benefits, those sums will make up a rising
are subject to the AMT.                                           portion of taxable income. Thus, the Treasury will receive
                                                                  significant tax revenues that have essentially been deferred
Relative to the extended-baseline scenario, extending the         for years, which will tend to boost tax receipts relative to
provisions of EGTRRA and JGTRRA and indexing the                  GDP. As a result, under the extended-baseline scenario,
AMT for inflation would lower revenues from individual            projected revenues as a share of GDP would climb by
income taxes (and total revenues) by 1.4 percent of GDP           about 0.5 percentage points between 2010 and 2035.
in 2012 and by 2.7 percent in 2035. That effect would             That upward trend would end in the mid-2030s, so
increase over time as cumulative inflation caused more            beyond that point, revenues from taxable withdrawals
taxpayers to be subject to the AMT.                               would no longer grow faster than GDP.

Other Structural Features of the Income Tax System.               Effects of Recent Health Care Legislation. One key
Even if the AMT was indexed for inflation and the tax             provision of the legislation is an excise tax on high-
provisions of EGTRRA and JGTRRA were made perma-                  premium health insurance plans. Under that provision,
nent, individual income tax revenues would continue to            employment-based plans with premiums exceeding a
rise as a percentage of GDP. Most of the parameters of            specified threshold will generally be subject to an excise
the individual income tax apart from the AMT are                  tax of 40 percent. That tax, which will be levied on insur-
indexed for inflation, which prevents average tax rates           ers but most likely passed on to their customers, will
from rising when incomes are increasing only with infla-          increase revenues in two ways. First, in those cases in
tion. Rising real incomes, however, cause an ever-larger          which the tax applies, it will generate additional excise tax
proportion of income to be subject to higher tax rates, a         revenues. Second, many individuals and employers will
phenomenon known as “real bracket creep.” Rising real             probably respond to the presence of the excise tax by
incomes also increase taxes by reducing taxpayers’ eligibil-      shifting to lower-cost insurance plans—plans with premi-
ity for various credits, such as the earned income tax            ums below the tax threshold—to avoid paying the excise
credit and the child tax credit. In addition, some provi-         tax. As a result, total payments of health insurance premi-
sions of the tax code are not indexed for inflation, so           ums for those individuals will be less than they would
cumulative inflation would generate some increase in              have been in the absence of the tax. Because, over the
receipts relative to GDP. All told, even if the AMT was           long term, total compensation paid by employers would
indexed and the expiring tax provisions were extended,            not be affected, lower expenditures for health insurance
growth in people’s nominal income would increase                  would mean higher taxable wages for employees and, as a
income tax revenues relative to GDP by 2.6 percentage             result, higher payments for income and payroll taxes.
points between 2010 and 2035, CBO estimates.
                                                                  Although the threshold for the tax on high-premium
Demographic Trends. Over the next few decades, another            health insurance plans is indexed for changes in overall
factor will cause income tax revenues to increase as a share      consumer prices, health care costs will grow faster than
of GDP: the retirement of members of the baby-boom                prices over the long term, CBO projects and, conse-
generation. Although certain contributions to retirement          quently, a greater share of premiums will be subject to the
plans—such as 401(k) plans and individual retirement              excise tax.6 Thus, in CBO’s estimation, whether policy-
accounts—are tax-exempt when they are made, and the               holders pay the excise tax through higher premiums or
income earned on assets in those accounts is also exempt          avoid it by switching to lower-cost plans, total taxes will
from taxes, withdrawals from plans with deductible con-           ultimately rise in comparison with what would have hap-
tributions are subject to taxation.5 Likewise, compensa-          pened in the absence of the new excise tax. Accordingly,
tion that is deferred under employer-sponsored defined-           CBO projects that the excise tax will increase revenues

5. Contributions to some 401(k) plans and individual retirement   6. The thresholds are initially set in statute for 2018 and are indexed
   accounts are not tax-deductible, but withdrawals from those       to general inflation plus 1 percent for 2019 and to general infla-
   accounts are untaxed.                                             tion for 2020 and subsequent years.


                                                                                                                                            CBO
58   THE LONG-TERM BUDGET OUTLOOK


      by just over 0.5 percent of GDP in 2035 and eventually                    exempt from taxation will remain fixed at $1 million
      by over 3 percent of GDP in 2080. Because health care                     starting in 2011 and not be indexed for inflation there-
      spending so far into the future is highly uncertain, projec-              after; as a result, a greater share of wealth would become
      tions at that horizon of the revenue loss from rising                     subject to the tax over time. Excluding the new excise tax
      health care costs and the revenue gain from the excise tax                on high-premium health insurance plans, excise taxes are
      are particularly uncertain.7                                              projected to decline slightly as a share of GDP over time
                                                                                because many excise taxes are assessed as a fixed dollar
      Other provisions of the new health care legislation that                  amount per quantity of a good that is purchased and not
      will boost revenues as a share of GDP are additional taxes                as a percentage of the price paid for that good. Therefore,
      on earnings and on investment income, which will be                       as the general price level rises over time, excise taxes tend
      assessed on individuals with income in excess of                          to fall as a share of GDP. On balance, CBO projects that
      $200,000 and on families with income in excess of                         in the absence of the excise tax on high-premium health
      $250,000. Those thresholds are not indexed for inflation.                 insurance plans, revenue derived from corporate income
      Because an increasing share of earnings and investment                    taxes, estate and gift taxes, federal excise taxes, and other
      income will become subject to the new surtaxes over                       miscellaneous receipts will rise by 0.8 percent of GDP
      time, CBO projects that the new levies will increase reve-                between 2010 and 2035 and by a small amount after
      nues by a small but growing share of GDP over time.                       2035.
      Other provisions of the health care legislation will also
      raise revenues by small amounts as a share of GDP.                        The Alternative Fiscal Scenario
                                                                                The alternative fiscal scenario is based on the assumption
      Under the extended-baseline scenario, CBO estimates,                      that certain tax policies that have recently expired, or that
      the recent health care legislation would raise revenues as a              are scheduled to expire, will be extended through 2020,
      share of GDP by 0.5 percent in 2020, by 1.2 percent in                    and that tax policies will adjust so that revenues remain at
      2035, and by increasing amounts thereafter. Increases in                  a constant share of GDP thereafter. Specifically:
      revenues from the recent legislation would offset a decline
      in revenues from rising health care costs. In CBO’s                       B   Certain provisions of EGTRRA and JGTRRA are
      estimation, those costs would cause a growing portion                         assumed to be extended, including the $1,000 child
      of workers’ compensation to be paid as nontaxable health                      tax credit, marriage penalty relief, and lower tax rates
      insurance benefits, holding down both income and pay-                         for taxpayers with incomes under $250,000;
      roll tax revenues.
                                                                                B   AMT relief, which expired at the end of 2009, is
      Other Factors Affecting Revenue Projections. In addition                      assumed to be extended; and
      to the factors already discussed, other factors would also
                                                                                B   The estate tax, which expired completely in 2010 and
      affect the growth of federal revenues as a share of GDP
                                                                                    is scheduled to be reinstated in 2011—at the rates and
      under the extended-baseline scenario. According to
                                                                                    exemption amounts scheduled to apply in 2011 before
      CBO’s projections, corporate income tax revenues are
                                                                                    the law was changed in 2001—is assumed instead to
      expected to rise as a share of GDP over the next 10 years,
                                                                                    be extended at the rates in effect in 2009 and with the
      reflecting an anticipated rebound from a historically low
                                                                                    exemption amounts (adjusted for inflation) that
      share of GDP in 2010 as the economy recovers from the
                                                                                    applied in that year.
      recession. Estate and gift taxes are projected to increase as
      a share of GDP following the reinstatement of the estate                  Those changes are widely expected to be made in some
      tax after 2010. The dollar amount of an estate that is                    form over the next few years. If they are, they will receive
                                                                                special treatment under the new Statutory Pay-As-You-
      7. While the incremental effect of the excise tax is uncertain, the       Go Act of 2010. Under those assumptions, the growth in
         excise tax reduces uncertainty in the overall revenue forecast by      revenues between 2010 and 2020 would amount to
         limiting the impact of untaxed health insurance benefits. Prior to
         the introduction of the excise tax, the size of the untaxed benefits
                                                                                about 4 percentage points, from 15 percent of GDP to
         depended upon the future path of health care spending. By limit-       just over 19 percent of GDP—as compared with the
         ing the impact of the untaxed health benefits on the revenue base,     6 percentage-point increase projected under the
         the excise tax reduces that source of uncertainty.                     extended-baseline scenario. That projected growth in


CBO
CHAPTER FOUR                                                                                         THE LONG-TERM BUDGET OUTLOOK        59


receipts is largely attributable to several factors that also   legislation).8 Under the extended-baseline scenario, the
matter in the extended-baseline scenario: the anticipated       impact of the legislation on the revenue share of GDP
economic recovery over the next few years; the increase in      would rise over time, CBO estimates, boosting revenues
tax rates that would affect people in the highest income        by about 1.2 percent of GDP in 2035 and by a larger
brackets beginning in 2011; and the rise in estate, gift,       amount after 2035; most of the increase that is projected
and corporate taxes.                                            to occur after 2035 is attributable to the excise tax on
                                                                high-premium health insurance plans.
In the alternative fiscal scenario, CBO assumed that after
2020 a series of changes in the tax code would be enacted       Excluding the effects of health care legislation, CBO’s
to offset certain factors that under the baseline scenario      current long-term projection of revenues as a share of
would increase revenues over time; as a result, revenues        GDP under the extended-baseline scenario is close to its
as a share of GDP would remain constant. The chief              2009 projection. On net, excluding the impact of that
features of the current tax system that would cause reve-       legislation, projected federal revenues under the scenario
nues to rise are real bracket creep, unindexed tax parame-      are 0.2 percentage points lower in 2020 and 0.4 percent-
                                                                age points higher in 2035; after 2035, the difference
ters, an increase in taxable withdrawals from retirement
                                                                diminishes. The impact of changes in the long-term eco-
accounts, and the long-run interaction of rising health
                                                                nomic forecast on projected individual income taxes
care expenditures and health care legislation. During the
                                                                accounts for most of the change in 2035. Cumulative
past 40 years, legislative changes have kept total revenues
                                                                inflation is slightly higher by 2035 than was projected last
between 15 percent and 21 percent of GDP, averaging             year, which has the effect of increasing income tax reve-
18.1 percent of GDP over the period. Under this sce-            nues relative to GDP. After 2035, cumulative inflation
nario, revenues would remain at about 19 percent of             remains slightly higher than was projected last year, but
GDP in 2035, about 4 percentage points less than is pro-        cumulative real income growth is projected to be slightly
jected under the extended-baseline scenario. Revenues           lower; the effects of those revisions on revenues are essen-
would remain at about 19 percent of GDP through 2080            tially offset after 2035.
under the alternative fiscal scenario, in contrast with their
continued rise after 2035 under the extended-baseline           In projecting the alternative fiscal scenario for this report,
scenario.                                                       CBO departed somewhat from the method used for its
                                                                June 2009 report. First, rather than basing the scenario
                                                                on the assumption that individual income tax law in
Changes in CBO’s Long-Term Revenue                              effect in 2009 would be extended permanently, CBO
Projections Since June 2009                                     assumed that a narrower set of policies would be contin-
Compared with last year’s estimates, the major change in        ued in 2010 and beyond. Those policies are consistent
CBO’s projection of revenues this year under the                with the extension through 2020 of provisions that are
extended-baseline scenario results from enactment of the        the basis for “current-policy” adjustments specified in the
health care legislation. The Patient Protection and             Statutory Pay-As-You-Go Act.9 Second, and more signifi-
Affordable Care Act, enacted in March 2010 and modi-            cant over the longer term, CBO assumed in last year’s
fied by the Health Care and Education Reconciliation            report that policies in effect in 2009 would remain per-
Act, includes a number of provisions that affect revenues.      manently in place after 2020, whereas the assumption
Most notable among those are additional taxes on earn-          this year is that revenues (including those resulting from
ings and investment income that will be imposed starting        the recently enacted health care legislation) would remain
in 2013 and the excise tax on high-premium health insur-
ance plans that will go into effect in 2018. Those laws         8. See Congressional Budget Office, letter to the Honorable Nancy
                                                                   Pelosi about the budgetary effects of H.R. 4872, the Reconcilia-
also impose new annual fees on health insurance provid-
                                                                   tion Act of 2010 (March 20, 2010).
ers and on certain manufacturers and importers of certain
drugs. Altogether, CBO and the staff of the Joint Com-          9. Although the Statutory Pay-As-You-Go Act of 2010 provides only
                                                                   for the temporary extension of the 2009 estate tax parameters and
mittee on Taxation estimated that the legislation would            alternative minimum tax relief through 2011, the alternative fiscal
raise revenues by 0.5 percent of GDP in 2020 (as com-              scenario assumes that both of those policies would continue
pared with what would be the case in the absence of that           through 2020.


                                                                                                                                         CBO
60   THE LONG-TERM BUDGET OUTLOOK


      Figure 4-4.
      The Impact of the Alternative Minimum Tax on Individual Income Tax Liability
      Under CBO’s Extended-Baseline Scenario, 2009 to 2035
      (By calendar year, in percent)
      50
      45
      40
      35
      30
                                                   Share of Households
      25                                           Affected by the AMT
      20                                                                                                     Additional Liability
                                                                                                         Generated by the AMT as a
      15
                                                                                                      Share of Total Individual Revenues
      10
       5
       0
        2009                        2014                      2019                       2024                      2029                       2034

      Source: Congressional Budget Office.
      Notes: The shares of households and revenues rise in 2010 after the temporary increase in the AMT exemption expires. After 2010, the shares
             initially fall because taxes and the regular income tax rise with the expiration of certain provisions of the Economic Growth and Tax
             Relief Reconciliation Act of 2001 and the Jobs and Growth Tax Relief Reconciliation Act of 2003.
               The extended-baseline scenario adheres closely to current law, following CBO’s 10-year baseline budget projections through 2020
               (with adjustments for the recently enacted health care legislation) and then extending the baseline concept for the rest of the long-
               term projection period. (For details, see Table 4-1.)
               AMT = alternative minimum tax.

      constant as a share of GDP after 2020. CBO did not                         sharply relative to income. Changes to the tax system
      specify the changes in law that would achieve a constant                   stemming from the expiration of EGTRRA and
      share of GDP after 2020. Excluding the effects of the                      JGTRRA would also boost tax rates. As a result of all of
      recently enacted health care legislation, the current pro-                 those changes, people at various points in the income
      jections of revenues as a share of GDP under the alterna-                  scale would pay a very different percentage of their
      tive fiscal scenario are 0.2 percentage points higher in                   income in taxes than people at the same points pay today.
      2020 and 0.4 percentage points lower in 2035 than last
      year. The difference increases considerably after 2035                     Under the alternative fiscal scenario, CBO assumed that
      because of the assumption in this year’s report that reve-                 unspecified policy adjustments would be made after 2020
      nues remain constant as a share of GDP after 2020.                         to keep revenues constant as a share of GDP. A wide
                                                                                 range of policy alternatives could result in that outcome,
                                                                                 and the specific choices that might be made would have
      Implications of the Long-Term                                              very different implications for the economy and for the
      Revenue Scenarios                                                          share of income paid in taxes by people at various income
      The tax systems that would be in place under the two sce-                  levels.
      narios would differ, in a variety of ways, from the current
      system. Under the extended-baseline scenario, inflation                    Impact of the AMT
      and income growth over many years would significantly                      If the parameters of the AMT remain unchanged, as
      change the characteristics of the tax system: Many more                    CBO assumed in the extended-baseline scenario, the
      taxpayers would pay the AMT, marginal and average tax                      alternative minimum tax would ultimately affect a signif-
      rates would rise, and the dollar value of some tax parame-                 icant share of taxpayers. Just 3 percent of households were
      ters would fall sharply in real terms and even more                        affected by the AMT in 2009—the most recent year in


CBO
CHAPTER FOUR                                                                                                   THE LONG-TERM BUDGET OUTLOOK        61


Table 4-3.                                                               AMT rate by then). Therefore, the amount of additional
                                                                         tax liability under the AMT would decline as the amount
Estimates of Effective Marginal                                          of tax calculated under the regular tax rose. The AMT
Tax Rates Under CBO’s Extended-                                          would continue to apply to many taxpayers, but the addi-
Baseline Scenario                                                        tional revenue attributable to it would diminish relative
                                                                         to GDP.
(Percent)
                                              2010     2025     2035
                                                                         Marginal Tax Rates on Income from
Marginal Tax Rate on Labor Income                29       35       38
                                                                         Labor and Capital
Marginal Tax Rate on Capital Income              13       16       16    Marginal tax rates on income from labor and capital
                                                                         would rise considerably under the extended-baseline
Source: Congressional Budget Office.                                     scenario. The increase in the marginal tax rate on labor
Notes: The effective federal marginal tax rate on income from labor      would reduce people’s incentive to work, and the increase
       is the share of the last dollar of earnings in the economy that   in the marginal tax rate on capital would reduce their
       is taken by federal individual income and payroll taxes. The      incentive to save. However, the reduction in earnings and
       effective federal marginal tax rate on income from capital is
       the share of the last dollar of such income that is taken by
                                                                         savings from higher taxes would create an incentive to
       federal individual and corporate income taxes.                    work and save more, if people wished to maintain the
       The extended-baseline scenario adheres closely to current
                                                                         same amount of after-tax income and savings. On net,
       law, following CBO’s 10-year baseline budget projections          evidence suggests that the former effects typically prevail
       through 2020 (with adjustments for the recently enacted           and thus that higher marginal tax rates would tend to
       health care legislation) and then extending the baseline          discourage some economic activity. The effect of taxes on
       concept for the rest of the long-term projection period.          the future path of economic output would depend not
       (For details, see Table 4-1.)
                                                                         only on those marginal tax rates but also on future budget
which temporary higher exemption amounts were in                         deficits and the amount of debt the government holds
effect. However, by 2011—with the expiration of AMT                      relative to the size of the economy.
relief at the end of 2009 and the expiration at the end of
                                                                         CBO estimates that under the extended-baseline sce-
2010 of the income tax cuts enacted in EGTRRA and
                                                                         nario, the marginal tax rate on labor income would
JGTRRA—the AMT would affect 9 percent of house-
                                                                         increase by about 6 percentage points between now and
holds, CBO projects. By 2035, nearly half of the nation’s
                                                                         2025, and by an additional 3 percentage points between
households would be subject to the AMT. The AMT
                                                                         2025 and 2035 (see Table 4-3). The increase between
would also account for an increasing share of individual
                                                                         2010 and 2025 includes the effects of the expiration of
income tax liability over time. By 2035, roughly
                                                                         EGTRRA and JGTRRA after 2010, the introduction of
12 percent of individual income tax liability would be
                                                                         the additional tax on earnings over $250,000 that begins
attributable to the AMT, compared with less than
                                                                         in 2013, and the impact of the excise tax on certain high-
4 percent in both 2009 and 2011 (see Figure 4-4).
                                                                         premium health insurance plans that takes effect in 2018.
Because taxpayers’ liability under the AMT is calculated
                                                                         Marginal rates on labor would also rise between 2010 and
as the excess amount over the regular tax owed, the
                                                                         2025 and continue to rise between 2025 and 2035
AMT’s contribution to receipts is smaller than its contri-
                                                                         because of real bracket creep under the regular tax, the
bution to the share of people affected by the tax.
                                                                         effects of the AMT on a rising number of taxpayers, and
Under the extended-baseline scenario, both the share of                  the growing impact of both the additional tax on earnings
households subject to the AMT and the share of total rev-                and the excise tax on certain high-premium health insur-
                                                                         ance plans.10
enues attributable to it would continue to rise after 2035.
Sometime around 2060, revenues generated by the AMT
would level off as a share of GDP as real bracket creep                  10. The additional tax on earnings applies to a greater share of labor
                                                                             income over time because the $250,000 threshold will not be
caused a greater share of income to be subject to the top                    indexed for inflation. The excise tax on certain high-premium
marginal rate under the regular income tax (whereas less                     plans affects a larger share of compensation over time because the
bracket creep would occur under the AMT because most                         threshold for the tax rises with general prices, while health costs
of the income under the AMT will be taxed at the top                         are rising at a faster rate.


                                                                                                                                                   CBO
62   THE LONG-TERM BUDGET OUTLOOK


      Because of the expiration of certain provisions of            Without legislative changes, the proportion of taxpayers
      EGTRRA and JGTRRA, as well as the introduction of             claiming the earned income tax credit would fall from
      the additional tax on investment income in excess of          15 percent this year to 10 percent in 2035 as growth in
      $250,000, the marginal tax rate on capital under the          real income moved more taxpayers out of the eligibility
      extended-baseline scenario would rise by 3 percentage         range for the credit.
      points between 2010 and 2025. Marginal rates on capital
      would remain roughly the same between 2025 and 2035           The fact that most tax parameters are not indexed for real
      because the impact of real bracket creep and the expand-      income growth and that some are not even indexed for
      ing effects of the AMT would have little effect on the tax    inflation has significant implications over the long term.
      rate on capital income. (The reason is that after 2025, a     Under current rules for indexing tax parameters, individ-
      large share of capital income would already be taxed at       ual income taxes as a share of income would grow by
      the top rate.)                                                varying amounts for households at different points in the
                                                                    income scale. For example, a couple with two children,
      In constructing the alternative fiscal scenario, CBO did      earning the median income of $94,900 in 2010 and fil-
      not make assumptions about any specific revenue policies      ing a joint tax return, would pay about 3 percent of their
      after 2020. The marginal tax rates on capital and labor       income in individual income taxes under the extended-
      would depend on the specific policies chosen to maintain      baseline scenario (see Table 4-4).11 By 2035, under exist-
      revenues at a constant share of GDP. Therefore, CBO           ing tax law, a similar couple with median income would
      could not analyze marginal tax rates under the alternative    pay 13 percent of their income in individual income
      fiscal scenario.                                              taxes, an increase of 10 percentage points. By compari-
                                                                    son, if the same couple earned four times the median
      Average Tax Rates on Typical Households                       income, the share of income that they would pay in indi-
      Over the coming decades, the cumulative effect of rising      vidual income taxes would rise from 21 percent in 2010
      prices will sharply reduce the value of some parameters of    to 24 percent by 2035, an increase of 3 percentage points.
      the tax system that are not indexed for inflation. Under      After 2035, income taxes as a share of income would con-
      the extended-baseline scenario, the estate tax exemption,     tinue rising at both income levels—but again, by a greater
      which will be $1 million in 2011 under current law,           proportion for the couple earning the median income.
      would be worth about $600,000 (in 2010 dollars) by            Taxes as a share of income for households at various other
      2035; the same is true for the amount of mortgage debt        points in the income distribution would also be very dif-
      eligible for the mortgage interest deduction, which is also   ferent than they are today.
      limited to $1 million in 2011 under current law. The
      portion of Social Security benefits subject to taxation       Despite rising average tax rates, households in the future
      would increase from about 30 percent now to about             would have higher after-tax income than similar house-
      50 percent by 2035, because the thresholds for taxing         holds at the same point in the income distribution have
      benefits are fixed in nominal terms.                          today because of growth in real income. For example, by
                                                                    2035 under the extended-baseline scenario, real after-tax
      Even tax parameters that are indexed for inflation would      income for the couple earning the median income would
      lose value relative to income over the long term. The cur-    have grown by 35 percent since 2010, despite the increase
      rent $3,650 personal exemption would rise by almost           in taxes as a share of income. The growth in pretax
      70 percent by 2035 because it is indexed for inflation,       income would more than offset the increase in taxes.
      but income per household is projected to more than
      double during that period, so the value of the exemption      11. The examples assume all income received by taxpayers is compen-
      relative to income would decline by about 30 percent.             sation. For details about the calculations, see Table 4-4.


CBO
CHAPTER FOUR                                                                                                 THE LONG-TERM BUDGET OUTLOOK      63


Table 4-4.
Individual Income and Payroll Taxes as a Share of Income Under CBO’s
Extended-Baseline Scenario
                                                                                       Taxes as a Share of Income Under the
                                                                                       Extended-Baseline Scenario (Percent)
                                                 Income                                Income                      Income and
                                              (2010 dollars)                            Taxes                      Payroll Taxes
                                                                        Taxpayer Filing a Single Return
Half the Median Income
  2010                                            16,700                                  -2                                   8
  2035                                            25,500                                   4                                  13
Median Income
 2010                                             33,400                                   5                                  18
 2035                                             51,000                                   8                                  20
Twice the Median Income
  2010                                            66,800                                   9                                  22
  2035                                           102,100                                  14                                  27
Four Times the Median Income
  2010                                           133,600                                  14                                  27
  2035                                           204,300                                  21                                  33

                                                           Married Couple with Two Children Filing a Joint Return a
Half the Median Income
  2010                                            47,400                                 -11                                  -1
  2035                                            72,600                                   4                                  14
Median Income
 2010                                             94,900                                   3                                  15
 2035                                            145,200                                  13                                  25
Twice the Median Income
  2010                                           189,700                                  13                                  23
  2035                                           290,300                                  20                                  30
Four Times the Median Income
  2010                                           379,400                                  21                                  27
  2035                                           580,700                                  24                                  30

Source: Congressional Budget Office based on data from the March 2009 Current Population Survey.
Notes: All income is assumed to be from compensation, which includes employment-based health insurance and the employer’s share of
       payroll taxes. For 2035, the premium on employment-based health insurance is assumed to not exceed the excise tax threshold
       set forth in the Patient Protection and Affordable Care Act (Public Law 111-148), as amended by the Health Care and Education
       Reconciliation Act of 2010 (P 111-152).
                                     .L.
       Taxpayers are assumed to itemize if implied itemized deductions are greater than the standard deduction. State and local taxes are
       assumed to be 8 percent of wages; other deductions are assumed to be 14 percent of wages.
       The extended-baseline scenario adheres closely to current law, following CBO’s 10-year baseline budget projections through 2020
       (with adjustments for the recently enacted health care legislation) and then extending the baseline concept for the rest of the long-
       term projection period. (For details, see Table 4-1.)
a. The examples for the married couple assume that only one spouse earns income.


                                                                                                                                               CBO
APPENDIX


                                                         A
                  Long-Term Projections Through 2080


T      his appendix presents longer-term versions of
several figures that appear in Chapters 1, 3, and 4 of this
                                                              (noninterest) spending, total revenues, and debt held by
                                                              the public through 2080 under the extended-baseline and
report. The longer-term figures show the Congressional        alternative fiscal scenarios.
Budget Office’s projections of categories of primary


                                                                                                                         CBO
66   THE LONG-TERM BUDGET OUTLOOK


      Figure A-1.
      Revenues and Primary Spending, by Category, Under CBO’s Long-Term
      Budget Scenarios Through 2080
      (Percentage of gross domestic product)
                                                                  Extended-Baseline Scenario
      35
                                                     Actual   Projected
      30             Total Primary
                       Spending             Revenues
      25
                                                                                                 Other Noninterest
      20                                                                                             Spending

      15
                                                                                              Medicare, Medicaid,
      10                                                                                  CHIP, and Exchange Subsidies

       5
                                                                                                  Social Security
       0
        1970          1980        1990        2000         2010        2020        2030         2040        2050        2060         2070        2080


                                                                  Alternative Fiscal Scenario
      35
                                                     Actual Projected
      30            Total Primary
                      Spending              Revenues
      25                                                                                         Other Noninterest
                                                                                                     Spending
      20

      15
                                                                                              Medicare, Medicaid,
      10                                                                                  CHIP, and Exchange Subsidies


       5
                                                                                                  Social Security
       0
        1970         1980         1990        2000         2010        2020        2030         2040        2050        2060         2070        2080


      Source: Congressional Budget Office.
      Notes: Primary spending refers to all spending other than interest payments on federal debt.
               The extended-baseline scenario adheres closely to current law, following CBO’s 10-year baseline budget projections through 2020
               (with adjustments for the recently enacted health care legislation) and then extending the baseline concept for the rest of the long-
               term projection period. The alternative fiscal scenario incorporates several changes to current law that are widely expected to occur or
               that would modify some provisions that might be difficult to sustain for a long period. (For details, see Table 1-1 on page 3.)
               CHIP = Children’s Health Insurance Program.


CBO
APPENDIX A                                                                                                       THE LONG-TERM BUDGET OUTLOOK    67


Figure A-2.
Federal Debt Held by the Public Under CBO’s Long-Term Budget Scenarios
Through 2080
(Percentage of gross domestic product)
200
                                               Actual   Projected
175

150                                                                                Alternative Fiscal Scenario

125

100

 75                                                                                                  Extended-Baseline Scenario

 50

 25

   0
    1970        1980        1990        2000        2010        2020        2030        2040        2050           2060      2070        2080

Source: Congressional Budget Office.
Note: The extended-baseline scenario adheres closely to current law, following CBO’s 10-year baseline budget projections through 2020
      (with adjustments for the recently enacted health care legislation) and then extending the baseline concept for the rest of the long-
      term projection period. The alternative fiscal scenario incorporates several changes to current law that are widely expected to occur or
      that would modify some provisions that might be difficult to sustain for a long period. (For details, see Table 1-1 on page 3.)


                                                                                                                                                 CBO
68   THE LONG-TERM BUDGET OUTLOOK


      Figure A-3.
      Comparison of CBO’s 2009 and 2010 Budget Projections Under the
      Extended-Baseline Scenario Through 2080
      (Percentage of gross domestic product)
                                                              Revenues and Primary Spending
      35


      30


      25


      20                                                                                 Spending                        Revenues
                                                                                               2009 Projection                  2009 Projection
                                                                                               2010 Projection                  2010 Projection
      15


      10
       0
        2010                2020               2030               2040                2050                2060                2070                2080


                                                              Federal Debt Held by the Public
      200

      175

      150                                                                     2009 Projection

      125

      100                                                                                                   2010 Projection

       75

       50

       25

        0
           2010              2020               2030               2040               2050                2060                2070                2080

      Source: Congressional Budget Office.
      Notes: Primary spending refers to all spending other than interest payments on federal debt.
              The extended-baseline scenario adheres closely to current law, following CBO’s 10-year baseline budget projections through 2020
              (with adjustments for the recently enacted health care legislation) and then extending the baseline concept for the rest of the long-
              term projection period. (For details, see Table 1-1 on page 3.)


CBO
APPENDIX A                                                                                                    THE LONG-TERM BUDGET OUTLOOK       69


Figure A-4.
Comparison of CBO’s 2009 and 2010 Budget Projections Under the
Alternative Fiscal Scenario Through 2080
(Percentage of gross domestic product)
                                                         Revenues and Primary Spending
35


30


25


20


15                                                                                Spending                         Revenues
                                                                                        2009 Projection                 2009 Projection
                                                                                        2010 Projection                 2010 Projection
10
 0
  2010                2020               2030               2040               2050                2060              2070                 2080


                                                         Federal Debt Held by the Public
200
                              2010 Projection
175

150

125
                                       2009 Projection
100

 75

 50

 25

  0
     2010              2020               2030               2040               2050               2060               2070                2080

Source: Congressional Budget Office.
Notes: Primary spending refers to all spending other than interest payments on federal debt.
        The alternative fiscal scenario incorporates several changes to current law that are widely expected to occur or that would modify
        some provisions that might be difficult to sustain for a long period. (For details, see Table 1-1 on page 3.)


                                                                                                                                                 CBO
70   THE LONG-TERM BUDGET OUTLOOK


      Figure A-5.
      Spending for Social Security Under CBO’s Long-Term Budget Scenarios
      Through 2080
      (Percentage of gross domestic product)
      7
                                                  Actual   Projected
      6

      5

      4

      3

      2

      1

      0
       1970        1980        1990        2000        2010        2020        2030        2040        2050   2060   2070   2080

      Source: Congressional Budget Office.
      Note: Projected spending for Social Security is identical under CBO’s two long-term budget scenarios.


CBO
APPENDIX A                                                                                                    THE LONG-TERM BUDGET OUTLOOK       71


Figure A-6.
Total Revenues Under CBO’s Long-Term Budget Scenarios Through 2080
(Percentage of gross domestic product)
35
                                              Actual     Projected
                                                                                                        Extended-Baseline Scenario
30

25

20
                                                                                                        Alternative Fiscal Scenario
15

10

 5

 0
  1970         1980        1990        2000            2010      2020       2030        2040        2050        2060        2070         2080

Source: Congressional Budget Office.
Note: The extended-baseline scenario adheres closely to current law, following CBO’s 10-year baseline budget projections through 2020
      (with adjustments for the recently enacted health care legislation) and then extending the baseline concept for the rest of the long-
      term projection period. The alternative fiscal scenario incorporates several changes to current law that are widely expected to occur or
      that would modify some provisions that might be difficult to sustain for a long period. (For details, see Table 1-1 on page 3.)


                                                                                                                                                 CBO
APPENDIX


                                                                    B
                     Demographic and Economic Variables
                         Underlying CBO’s Analysis


T      he Congressional Budget Office’s (CBO’s) long-
term budget projections are based on projections for a
                                                                          constant real (inflation-adjusted) interest rate on federal
                                                                          debt and steady growth rates for real wages and gross
host of variables that relate to demographic trends and                   domestic product (GDP).
the performance of the U.S. economy. The values for
demographic variables used in this analysis come from                     CBO projected values for rates of interest, inflation, and
the most recent annual report of the Social Security                      unemployment directly. For growth rates of GDP and
trustees.1 The values for long-term economic variables                    earnings, in contrast, CBO did not make direct projec-
are based on CBO’s 10-year baseline projections as well as                tions but instead derived values for those variables by
on historical economic trends. Those demographic and                      using other economic and demographic assumptions.
economic variables are discussed below. (The projections                  (Annual values for selected economic variables through
for variables related to the growth in health care costs are              2084 can be found in the supplementary data for this
discussed in Chapter 2.)                                                  report on CBO’s Web site, www.cbo.gov.)

                                                                          Projections of Interest Rates, Inflation, and
Demographic Variables                                                     Unemployment After 2020
Future tax revenues, program spending, and economic                       CBO projected that after a 10-year phase-in from the
performance will all be affected by the size and structure                2020 rate, the real interest rate on 10-year Treasury
of the U.S. population. For its long-term budget projec-                  notes would be 3.0 percent through 2084. Because the
tions, CBO adopted the intermediate (midrange) values                     average maturity of federal debt is expected to be less than
in the 2009 report of the Social Security trustees for such               10 years, CBO projected that the effective interest rate on
demographic variables as the total fertility rate, the rate of            federal debt held by the public would be slightly lower,
decline in mortality, levels of immigration and emigra-                   averaging 2.7 percent a year. CBO used the same 2.7 per-
tion, and disability rates (specifically, the rates at which              cent value as a discount rate for calculating the present
people enter and leave Social Security’s Disability Insur-                value of future streams of total revenues and outlays. The
ance program).
                                                                          Social Security and Medicare trust funds hold longer-
                                                                          term debt, so the interest rates on those funds were
Economic Variables                                                        assumed to be 3.0 percent a year. CBO used that value to
The economic projections in this report for 2010                          discount future streams of revenues and outlays for the
through 2020 are consistent with those in CBO’s January                   Social Security and Medicare trust funds.
2010 economic forecast, which underlies the agency’s
current 10-year baseline.2 For later years, CBO projected                 CBO also projected that annual inflation—as measured
stable economic conditions after 2020—in particular, a                    by growth in both the consumer price index for urban
                                                                          wage earners and clerical workers (CPI-W) and the con-
                                                                          sumer price index for all urban consumers (CPI-U)—
1. Social Security Administration, The 2009 Annual Report of the
   Board of Trustees of the Federal Old-Age and Survivors Insurance and
   Federal Disability Insurance Trust Funds (May 12, 2009). The           2. See Congressional Budget Office, The Budget and Economic
   trustees have not yet released their 2010 report.                         Outlook: Fiscal Years 2010 to 2020 (January 2010), Chapter 2.


                                                                                                                                             CBO
74   THE LONG-TERM BUDGET OUTLOOK


      would be 2.5 percent. The unemployment rate was pro-               share to decrease. In the near term, however, that
      jected to decline to 5.0 percent and remain at that level          effect is likely to be offset by people’s responses to the
      over the long run.                                                 new excise tax on employment-based health insurance
                                                                         plans with relatively high premiums, which is sched-
      Variables Underlying Projections of                                uled to take effect in 2018. At least initially, employers
      GDP and Earnings                                                   who would otherwise be subject to the tax are apt to
      CBO projected that from 2021 through 2084, real                    shift to less expensive health plans to avoid the tax,
      GDP would grow at an average rate of 2.0 percent a                 which will tend to increase the taxable share of com-
      year, and real earnings would grow at an average rate of           pensation. (For more about the effects of the excise
      1.3 percent. Those estimates were based on CBO’s demo-             tax, see Chapter 4; for a discussion of trends in costs
      graphic assumptions and on four underlying economic                for health care, see Chapter 2.)
      projections:
                                                                     B   Average Hours Worked—CBO projected that the
      B   Growth in Productivity—CBO projected that in the               average number of hours worked by people in each
          long term, total factor productivity (average real out-        demographic group would remain constant. However,
          put per unit of combined labor and capital services)           different segments of the population work different
          would grow at an average annual rate of 1.3 percent.           numbers of hours, on average. For example, men tend
          CBO incorporated that projection into an economic              to work more hours than women, and people in their
          model that also uses projections of growth in the              30s tend to work more hours than people in their 50s.
          supply of labor and capital to compute the resulting           As a result, CBO’s projection of total average hours
          growth in labor productivity (measured as growth in            worked declines by 2 percent by 2080 because of pro-
          output per hour worked). The resulting projection for          jected changes in the composition of the labor force.
          growth in labor productivity averages 1.6 percent a
          year. That figure differs from the average growth rate     B   Difference Between Inflation as Measured by the GDP
          for real earnings because labor productivity does not          Deflator and by the CPI—The GDP deflator and the
          translate directly into earnings growth; the other fac-        consumer price index are both used to gauge inflation.
          tors listed below also play a role.                            The GDP deflator measures the level of prices of all
                                                                         final goods and services produced. The CPI measures
      B   Changes in the Ratio of Taxable Earnings to Total              the level of consumer prices based on a typical market
          Compensation—The average growth rate of taxable                basket of goods and services. Because of the difference
          earnings is affected by the share of compensation that         in how the two measures are constructed, there is a
          workers receive as nontaxable benefits. That share in          gap between the rates at which they grow. CBO
          turn is influenced by the growth of premiums for               projected that the gap would average 0.3 percentage
          employment-based health insurance. CBO expects                 points a year over the long-term projection period.
          that private-sector costs for health care will grow more       CBO uses the CPI to deflate earnings, because the
          quickly than compensation over the long-term projec-           CPI is a measure of the change in the cost of living for
          tion period (with that difference gradually declining).        consumers. Thus, the larger the gap between the
          That trend, by itself, would cause the nontaxable share        growth rates of the GDP deflator and the CPI, the
          of compensation to increase over time and the taxable          more that real earnings growth is reduced.


CBO
Long-Term Budget Outlook

Long-Term Budget Outlook

  • 1.
    CONGRESS OF THEUNITED STATES CONGRESSIONAL BUDGET OFFICE CBO The Long-Term Budget Outlook Percentage of Gross Domestic Product 200 Actual Projected 150 100 50 0 1970 1975 1980 1985 1990 1995 2000 2005 2010 2015 2020 2025 2030 2035 Federal Debt Held by the Public Under Two Budget Scenarios JUNE 2010
  • 2.
  • 3.
    A CBO R E P O R T The Long-Term Budget Outlook June 2010 The Congress of the United States O Congressional Budget Office
  • 4.
    Notes Unless otherwise indicated, the years referred to in this report are federal fiscal years (which run from October 1 to September 30). Numbers in the text and tables may not add up to totals because of rounding. In this report, “recently enacted health care legislation” refers to the Patient Protection and Affordable Care Act (Public Law 111-148) and the Health Care and Education Reconciliation Act of 2010 (P.L. 111-152). The figure on the cover shows federal debt held by the public under the Congressional Budget Office’s extended-baseline scenario (lower line) and alternative fiscal scenario (upper line). The extended-baseline scenario adheres closely to current law, following CBO’s 10-year base- line budget projections through 2020 (with adjustments for the aforementioned health care legislation) and then extending the baseline concept for the rest of the long-term projection period. The alternative fiscal scenario incorporates several changes to current law that are widely expected to occur or that would modify some provisions of law that might be difficult to sustain for a long period. Supplementary data underlying the long-term budget scenarios are posted along with this report on CBO’s Web site (www.cbo.gov). CBO
  • 5.
    Preface T his Congressional Budget Office (CBO) report examines the pressures on the federal budget by presenting the agency’s projections of federal spending and revenues over the com- ing decades. Under current laws and policies, an aging population and rapidly rising health care costs will sharply increase federal spending for health care programs and Social Security. Unless revenues increase at a similar pace, such spending will cause federal debt to grow to unsustainable levels. If policymakers are to put the nation on a sustainable budgetary path, they will need to let revenues increase substantially as a percentage of gross domestic product, decrease spending significantly from projected levels, or adopt some combination of those two approaches. This report was prepared under the supervision of Joyce Manchester, with assistance and help- ful comments from many others at CBO. Noah Meyerson wrote Chapter 1, with contribu- tions from Jonathan Huntley, Benjamin Page, and Sam Papenfuss. Philip Ellis, Lyle Nelson, and Julie Topoleski were the authors of Chapter 2. Noah Meyerson wrote Chapter 3, and Joshua Shakin wrote Chapter 4. Michael Simpson wrote the appendixes. Charles Pineles- Mark, Jonathan Schwabish, Michael Simpson, and Julie Topoleski developed the long-term simulations, and Marika Santoro and Michael Simpson prepared the macroeconomic simula- tions. David Weiner coordinated the revenue simulations, which were prepared by Paul Burn- ham, Grant Driessen, Ed Harris, Larry Ozanne, Kurt Seibert, and Joshua Shakin. Sarah Axeen and David Munroe provided research assistance. Christine Bogusz, Christian Howlett, and Loretta Lettner edited and proofread the report, with assistance from Leah Mazade and Sherry Snyder. Maureen Costantino and Jeanine Rees prepared the report for publication, and Maureen Costantino designed the cover. Monte Ruffin printed the initial copies, Linda Schimmel handled the print distribution, and Simone Thomas prepared the electronic version for CBO’s Web site (www.cbo.gov). Douglas W. Elmendorf Director June 2010 CBO
  • 7.
    Contents Summary ix 1 The Long-Term Outlook for the Federal Budget 1 Alternative Scenarios for the Long-Term Budget Outlook 2 The Long-Term Outlook for Spending 6 The Long-Term Outlook for Revenues 12 The Size of the Fiscal Imbalance 13 Uncertainty of Long-Term Budget Projections 16 The Economic Impact of Rising Federal Debt 17 Changes in CBO’s Long-Term Projections Since June 2009 22 2 The Long-Term Outlook for Mandatory Spending on Health Care 25 Overview of Current Financing for Health Care 27 The Historical Growth of Health Care Spending 29 CBO’s Projection Methodology 31 Recent Health Care Legislation 33 Long-Term Projections of Mandatory Federal Spending 36 Slowing the Growth of Health Care Costs 44 3 The Long-Term Outlook for Social Security 45 How Social Security Works 45 The Outlook for Social Security Spending and Revenues 46 Changes in CBO’s Long-Term Social Security Projections Since June 2009 50 Slowing the Growth of Social Security Spending 50 4 The Long-Term Outlook for Revenues 51 Revenues Over the Past 40 Years 53 Revenue Projections Under CBO’s Long-Term Budget Scenarios 54 Changes in CBO’s Long-Term Revenue Projections Since June 2009 59 Implications of the Long-Term Revenue Scenarios 60 CBO
  • 8.
    VI THE LONG-TERM BUDGET OUTLOOK A Long-Term Projections Through 2080 65 B Demographic and Economic Variables Underlying CBO’s Analysis 73 CBO
  • 9.
    CONTENTS THE LONG-TERM BUDGET OUTLOOK VII Tables 1 1. Assumptions About Spending and Revenues Underlying CBO’s Long Term Budget Scenarios 3 1 2. Projected Spending and Revenues Under CBO’s Long Term Budget Scenarios 7 1 3. The Federal Fiscal Gap Under CBO’s Long Term Budget Scenarios 15 2 1. Excess Cost Growth in Spending for Health Care 31 2 2. Financial Measures for Medicare’s Hospital Insurance Trust Fund Under CBO’s Extended Baseline Scenario 44 3 1. Financial Measures for Social Security Under CBO’s Long Term Budget Scenarios 49 4 1. Assumptions About Revenues Underlying CBO’s Long Term Budget Scenarios 54 4 2. Sources of Growth in Total Revenues as a Share of GDP Between 2010 and 2035 Under CBO’s Extended Baseline Scenario 55 4 3. Estimates of Effective Marginal Tax Rates Under CBO’s Extended Baseline Scenario 61 4 4. Individual Income and Payroll Taxes as a Share of Income Under CBO’s Extended Baseline Scenario 63 Figures 1 1. Revenues and Primary Spending, by Category, Under CBO’s Long Term Budget Scenarios 5 1 2. Federal Debt Held by the Public Under CBO’s Long Term Budget Scenarios 14 1 3. Reductions in Primary Spending or Increases in Revenues in Various Years Needed to Close the 25 Year Fiscal Gap Under CBO’s Alternative Fiscal Scenario 16 1 4. Various Paths for Primary Spending That Would Close the 25 Year Fiscal Gap Under CBO’s Alternative Fiscal Scenario 17 1 5. Real GDP per Capita Under Stable Economic Conditions or with Crowding Out Effects 20 1 6. Federal Debt Held by the Public With and Without Crowding Out Effects 21 1 7. Comparison of CBO’s 2009 and 2010 Budget Projections Under the Extended Baseline Scenario 23 1 8. Comparison of CBO’s 2009 and 2010 Budget Projections Under the Alternative Fiscal Scenario 24 2 1. Distribution of Spending for Health Services and Supplies, 2008 27 CBO
  • 10.
    VIII THE LONG-TERM BUDGET OUTLOOK Figures (Continued) 2 2. Mandatory Federal Spending on Health Care, by Category, Under CBO’s Extended Baseline Scenario 38 2 3. Mandatory Federal Spending on Health Care Under CBO’s Long Term Budget Scenarios 39 2 4. Comparison of CBO’s 2009 and 2010 Projections of Mandatory Federal Spending on Health Care Under the Extended Baseline Scenario 42 2 5. Mandatory Federal Spending on Health Care Under CBO’s Alternative Fiscal Scenario and Different Assumptions About Excess Cost Growth 43 3 1. Spending for Social Security Under CBO’s Long Term Budget Scenarios 46 3 2. The Population Age 65 or Older as a Percentage of the Population Ages 20 to 64 47 4 1. Total Revenues Under CBO’s Long Term Budget Scenarios 52 4 2. Revenues, by Source, 1970 to 2009 53 4 3. Individual Income Tax Revenues Under CBO’s Extended Baseline Scenario and Two Variants 56 4 4. The Impact of the Alternative Minimum Tax on Individual Income Tax Liability Under CBO’s Extended Baseline Scenario, 2009 to 2035 60 A 1. Revenues and Primary Spending, by Category, Under CBO’s Long Term Budget Scenarios Through 2080 66 A 2. Federal Debt Held by the Public Under CBO’s Long Term Budget Scenarios Through 2080 67 A 3. Comparison of CBO’s 2009 and 2010 Budget Projections Under the Extended Baseline Scenario Through 2080 68 A 4. Comparison of CBO’s 2009 and 2010 Budget Projections Under the Alternative Fiscal Scenario Through 2080 69 A 5. Spending for Social Security Under CBO’s Long Term Budget Scenarios Through 2080 70 A 6. Total Revenues Under CBO’s Long Term Budget Scenarios Through 2080 71 Boxes 1 1. The Statutory Pay As You Go Act of 2010 4 1 2. How the Aging of the Population and Rising Costs for Health Care Affect Federal Spending on Major Mandatory Programs 10 2 1. National Spending on Health Care 40 CBO
  • 11.
    Summary R ecently, the federal government has been record- ing the largest budget deficits, as a share of the economy, The Outlook for Major Health Care Programs and Social Security since the end of World War II. As a result of those defi- CBO projects that if current laws do not change, federal cits, the amount of federal debt held by the public has spending on major mandatory health care programs will surged. At the end of 2008, that debt equaled 40 percent grow from roughly 5 percent of GDP today to about of the nation’s annual economic output (as measured 10 percent in 2035 and will continue to increase there- by gross domestic product, or GDP), a little above the after.1 Those projections include all of the effects of the 40-year average of 36 percent. Since then, large budget recently enacted health care legislation, which is expected deficits have caused debt held by the public to shoot to increase federal spending in the next 10 years and for upward; the Congressional Budget Office (CBO) projects most of the following decade.2 By 2030, however, that that federal debt will reach 62 percent of GDP by the end legislation will slightly reduce federal spending for health of this year—the highest percentage since shortly after care if all of its provisions are fully implemented, CBO World War II. The sharp rise in debt stems partly from projects. That reduction in the level of spending in 2030 lower tax revenues and higher federal spending related to yields lower projections of health care spending in the the recent severe recession and turmoil in financial mar- longer term—even though, owing to the great uncertain- kets. However, the growing debt also reflects an imbal- ties involved in projecting such spending many decades ance between spending and revenues that predated those in the future, enactment of the legislation did not cause economic developments. CBO to change its estimates of longer-term growth rates for spending on the government’s health care programs. As the economy recovers and the policies adopted to counteract the recession and the financial turmoil phase Under current law, spending on Social Security is also out, budget deficits will probably decline markedly in the projected to rise over time as a share of GDP, albeit much next few years. But over the long term, the budget out- look is daunting. The retirement of the baby-boom gen- 1. Mandatory programs are ones that do not require annual appro- eration portends a significant and sustained increase in priations by the Congress; the major mandatory health programs the share of the population receiving benefits from Social consist of Medicare, Medicaid, the Children’s Health Insurance Security, Medicare, and Medicaid. Moreover, per capita Program, and health insurance subsidies that will be provided spending for health care is likely to continue rising faster through the exchanges established by the recently enacted health than spending per person on other goods and services for care legislation. many years (although the magnitude of that gap is very 2. For details, see Congressional Budget Office, letter to the Honor- uncertain). Without significant changes in government able Nancy Pelosi about the budgetary effects of H.R. 4872, the Reconciliation Act of 2010 (March 20, 2010), and Chapter 2 of policy, those factors will boost federal outlays sharply this report. If all of its provisions are carried out, the legislation relative to GDP in coming decades under any plausible will also increase federal revenues and reduce budget deficits over assumptions about future trends in the economy, demo- the 2010–2019 period and in subsequent years, according to esti- graphics, and health care costs. mates by CBO and the staff of the Joint Committee on Taxation. CBO
  • 12.
    X THE LONG-TERM BUDGET OUTLOOK less dramatically. CBO projects that Social Security percentages thereafter. At the same time, government spending will increase from less than 5 percent of GDP spending on everything other than the major mandatory today to about 6 percent in 2030 and then stabilize at health care programs, Social Security, and interest on fed- roughly that level. eral debt—activities such as national defense and a wide variety of domestic programs—would decline to the low- All told, CBO projects, the aging of the population and est percentage of GDP since before World War II. the rising cost of health care will cause spending on the major mandatory health care programs and Social Secu- That significant increase in revenues and decrease in rity to grow from roughly 10 percent of GDP today to the relative importance of other spending would offset about 16 percent of GDP 25 years from now if current much—though not all—of the rise in spending on health laws are not changed. (By comparison, spending on all of care programs and Social Security. As a result, debt would the federal government’s programs and activities, exclud- increase from its already high levels relative to GDP, as ing interest payments on debt, has averaged 18.5 percent would the required interest payments on that debt. of GDP over the past 40 years.) To put U.S. fiscal policy Federal debt held by the public would grow from an on a sustainable path, lawmakers would have to substan- estimated 62 percent of GDP this year to about 80 per- tially reduce the growth in outlays for those programs cent by 2035. Interest payments, which absorb federal relative to the amounts that CBO is projecting—or else resources that could otherwise be used to pay for govern- match that growth with equivalent declines in other ment services, currently amount to more than 1 percent federal spending, corresponding increases in federal of GDP; under this scenario, they would rise to 4 percent revenues, or some combination of the two. of GDP (or one-sixth of federal revenues) by 2035. The budget outlook is much bleaker under the alternative Alternative Long-Term Scenarios fiscal scenario, which incorporates several changes to cur- In this report, CBO presents the long-term budget pic- rent law that are widely expected to occur or that would ture under two scenarios that embody different assump- modify some provisions of law that might be difficult to tions about future policies governing federal revenues and sustain for a long period. In this scenario, CBO assumed spending. Budget projections grow increasingly uncertain that Medicare’s payment rates for physicians would grad- as they extend farther into the future, so this report ually increase (which would not happen under current focuses largely on the next 25 years. However, because law) and that several policies enacted in the recent health considerable interest exists in the longer-term outlook, care legislation that would restrain growth in health care figures showing projections through 2080 are presented spending would not continue in effect after 2020. In in Appendix A, and associated data are available on addition, under the alternative scenario, spending on CBO’s Web site. activities other than the major mandatory health care programs, Social Security, and interest would fall below The first long-term budget scenario used in this analysis, the average level of the past 40 years relative to GDP, the extended-baseline scenario, adheres closely to current though not as low as under the extended-baseline sce- law. It incorporates CBO’s current estimate of the impact nario. More important, CBO assumed for this scenario of the recently enacted health care legislation on revenues that most of the provisions of the 2001 and 2003 tax cuts and mandatory spending. (That estimate is unchanged would be extended, that the reach of the alternative mini- from the one that CBO and the staff of the Joint Com- mum tax would be kept close to its historical extent, and mittee on Taxation published in March, when the legisla- that over the longer run, tax law would evolve further so tion was being considered.) Under this scenario, the expi- that revenues would remain at about 19 percent of GDP, ration of most of the tax cuts enacted in 2001 and 2003, near their historical average. the growing reach of the alternative minimum tax, and the way in which the tax system interacts with economic Under that combination of policy assumptions, federal growth would result in steadily higher average tax rates. debt would grow much more rapidly than under the Those rising rates, combined with the tax provisions of extended-baseline scenario. With significantly lower reve- the recent health care legislation, would push total reve- nues and higher outlays, debt would reach 87 percent of nues to 23 percent of GDP by 2035—much higher than GDP by 2020, CBO projects. After that, the growing has typically been seen in recent decades—and to larger imbalance between revenues and noninterest spending, CBO
  • 13.
    SUMMARY THE LONG-TERM BUDGET OUTLOOK XI combined with spiraling interest payments, would swiftly abroad, and less domestic investment—which in turn push debt to unsustainable levels. Debt as a share of GDP would lower income growth in the United States. would exceed its historical peak of 109 percent by 2025 and would reach 185 percent in 2035. B Growing debt would also reduce lawmakers’ ability to respond to economic downturns and other challenges. Neither of those scenarios represents a prediction by CBO of what policies will be in effect during the next B Over time, higher debt would increase the probability several decades. The policies adopted in coming years will of a fiscal crisis in which investors would lose confi- surely differ from those assumed for the scenarios. (And dence in the government’s ability to manage its even if the assumed policies were adopted, their economic budget, and the government would be forced to pay and budgetary consequences would certainly differ from much more to borrow money. those projected in this report.) Nevertheless, these projec- tions, encompassing two very different sets of policy Keeping deficits and debt from growing to unsustainable assumptions, provide a clear indication of the serious levels would require raising revenues as a percentage of nature of the fiscal challenge facing the nation. GDP significantly above past levels, reducing outlays sharply relative to CBO’s projections, or some combina- tion of those approaches. Making such changes while The Impact of Growing economic activity and employment remain well below Deficits and Debt their potential levels would probably slow the economic In fact, CBO’s projections understate the severity of the recovery. However, the sooner that long-term changes to long-term budget problem because they do not incorpo- spending and revenues are agreed on, and the sooner they rate the significant negative effects that accumulating are carried out once the economic weakness ends, the substantial amounts of additional federal debt would smaller will be the damage to the economy from growing have on the economy: federal debt. Earlier action would require more sacrifices by earlier generations to benefit future generations, but it B Large budget deficits would reduce national saving, would also permit smaller or more gradual changes and leading to higher interest rates, more borrowing from would give people more time to adjust to them. CBO
  • 15.
    CHAPTER 1 The Long-Term Outlook for the Federal Budget T he federal government has recently been recording the largest budget deficits, relative to the size of the econ- Looking beyond the next decade, the fiscal outlook wors- ens further. Although long-term budget projections are omy, since 1945. As a result, the amount of federal debt highly uncertain, if current laws were followed, the aging held by the public has surged. Debt is expected to equal of the population and rising costs for health care would 62 percent of the economy’s annual output, or gross almost certainly cause federal spending to rise sharply domestic product (GDP), at the end of this fiscal year, up relative to GDP. Federal revenues would increase to sig- from 40 percent at the end of 2008. That sharp deteriora- nificantly higher levels under current law than have ever tion in the fiscal situation reflects several factors: an been seen in the United States, but they would still fall imbalance between spending and revenues that predated short of spending, according to CBO’s long-term projec- the recent recession and the turmoil in financial markets; tions. Consequently, federal debt would grow relative to a decline in tax revenues and an increase in spending on the size of the economy after the next decade. By 2035, it benefit programs caused by those economic problems; would equal 79 percent of GDP—the highest percentage and the costs of federal policies enacted in response to the in U.S. history except for the period between 1944 and problems. 1950. If current laws were to remain unchanged, the budget An alternative scenario presented in this report incor- deficit would drop markedly as a percentage of GDP porates several changes to current law that are widely in the next few years, the Congressional Budget Office expected to occur or that would modify some provisions (CBO) projects, and federal debt held by the public of law that might be difficult to sustain for a long period. would stabilize at about 67 percent of GDP for the next If such changes occurred—maintaining what some ana- decade.1 Those baseline projections, however, understate lysts might consider “current policy” as opposed to cur- the budget deficits that would arise if policies that are in rent law—revenues would increase much more slowly effect now or have been in effect recently were extended, than spending, and federal debt would balloon to 185 instead of implementing what current laws specify for percent of GDP by 2035. As debt grows, so does the bur- future years. Specifically, if most provisions of the tax cuts den of paying interest on it; thus, under that alternative enacted in 2001 and 2003 were extended rather than scenario, interest outlays would rise from about 1 percent allowed to expire as scheduled, if provisions designed to of GDP today to 9 percent by 2035. With still larger limit the reach of the alternative minimum tax (AMT) amounts of debt projected for later years under that sce- were also extended, and if annual appropriations kept nario, such a path for federal borrowing would clearly be pace with the growth of GDP, by 2020 the budget unsustainable. deficit would be growing steadily. In that case, debt held by the public would reach almost 90 percent of Moreover, the projected outcomes under both scenarios GDP in 2020. do not include the harmful effects that rising debt would have on economic growth and interest rates. If those 1. See Congressional Budget Office, An Analysis of the President’s effects were taken into account, projected debt would Budgetary Proposals for Fiscal Year 2011 (March 2010). increase even faster. CBO
  • 16.
    2 THE LONG-TERM BUDGET OUTLOOK If policymakers are to put the nation on a sustainable rent tax law, federal revenues would grow significantly budgetary path, they will need to let revenues increase faster than GDP over the long run under this scenario. substantially as a percentage of GDP, decrease spending significantly from projected levels, or adopt some combi- B The alternative fiscal scenario embodies several possible nation of those two approaches. With economic activity changes to current law that would continue certain tax and employment currently well below the levels that and spending policies that people have grown accus- could be achieved by fully utilizing the nation’s labor tomed to (because the policies are in place now or force and capital stock, raising revenues or curbing have been in place recently). Versions of some of the spending immediately would probably slow the economic changes assumed in the scenario—such as those recovery. However, the sooner that long-term changes to related to the AMT and Medicare’s payments to spending and revenues are agreed on, and the sooner they physicians—have regularly been enacted in the past. are implemented after the period of economic weakness, Those and certain other changes included in the sce- the smaller will be the damage to the economy from nario—such as changes related to the tax cuts enacted rising federal debt. in 2001 and 2003—are widely expected to be made in some form over the next few years. If they are, they Alternative Scenarios for the will receive special treatment under the Statutory Pay- Long-Term Budget Outlook As-You-Go Act of 2010 (Public Law 111-139), which In this report, CBO presents two sets of long-term bud- excludes some of the costs of such changes from the get projections that are based on differing assumptions law’s budget enforcement rules. (For details, see about future policy (see Table 1-1): Box 1-1.) B The extended-baseline scenario adheres most closely to After 2020, the alternative fiscal scenario also incor- current law. It follows CBO’s March 2010 baseline porates potential modifications to several provisions of budget projections (adjusted for the effects of recently current law that might be difficult to sustain for a long enacted health care legislation) for the next decade and period. Those provisions include certain restraints on then extends the baseline concept beyond that 10-year the growth of spending for Medicare and indexing window.2 This scenario incorporates CBO’s current provisions that will slow the growth of subsidies for estimate of the impact of the recent health care legisla- health insurance coverage. Other provisions of current tion on revenues and mandatory spending; that esti- law, if continued, would cause tax revenues as a per- mate is unchanged from March. The current-law centage of GDP to ultimately rise well above the levels assumption of the extended-baseline scenario implies that U.S. taxpayers have seen in the past. Therefore, that many adjustments that lawmakers have routinely the alternative fiscal scenario also incorporates unspec- made in the past—such as changes to the AMT and to ified changes in tax law that would keep revenues the Medicare program’s payments to physicians—will constant as a share of GDP after 2020. Together, the not be made again.3 Because of the structure of cur- changes in the alternative fiscal scenario represent one interpretation of what it would mean to continue 2. CBO’s baseline is a benchmark for measuring the budgetary effects of proposed changes to federal revenues or spending. It today’s underlying fiscal policy. However, different consists of projections of budget authority, outlays, revenues, and analysts might perceive the underlying intention of the deficit or surplus over 10 years calculated according to rules set current policy differently. forth in the Balanced Budget and Emergency Deficit Control Act of 1985. Those projections are not intended to be predictions of The projections in this report understate the size of the future budgetary outcomes; rather, they represent CBO’s best budgetary shortfalls that would be likely to result from judgment of how economic and other factors would affect federal such fiscal policies. For the purposes of the projections, revenues and spending if current laws did not change. CBO assumed stable economic conditions after 2020— 3. The alternative minimum tax is a parallel income tax system with in particular, a constant real (inflation-adjusted) interest fewer exemptions, deductions, and rates than the regular income tax. Households must calculate the amount they owe under both rate on federal debt and steady growth rates for real wages the AMT and the regular income tax and pay the larger of the two and output. That approach omits the pressures that a amounts. rise in debt as a percentage of GDP would have on real CBO
  • 17.
    CHAPTER ONE THE LONG-TERM BUDGET OUTLOOK 3 Table 1-1. Assumptions About Spending and Revenues Underlying CBO’s Long-Term Budget Scenarios Extended-Baseline Scenario Alternative Fiscal Scenario Assumptions About Spending Medicare As scheduled under current law As scheduled under current law, except that payment rates for physicians grow with the Medicare economic index (rather than at the lower rates of the sustainable growth rate mechanism) and that after 2020, several policies that would restrain spending growth are assumed not to be in effect Medicaid and Exchange As scheduled under current law As scheduled under current law, except that after 2020, Subsidies a policy that would slow the growth of subsidies for health insurance coverage is assumed not to be in effect CHIP As projected in CBO's baseline through 2020; adjusted As projected in CBO's baseline through 2020; adjusted for growth in per capita GDP and the size of the for growth in per capita GDP and the size of the under-18 population thereafter under-18 population thereafter Social Security As scheduled under current law As scheduled under current law Other Noninterest As projected in CBO's baseline through 2020; remaining As projected in CBO's baseline through 2013; remaining at Spending at the 2020 level as a share of GDP thereafter, except the 2010 level as a share of GDP (minus stimulus and related that some refundable tax credits, Medicare premiums, spending) thereafter, except that some refundable tax credits, and certain payments by states to Medicare are as Medicare premiums, and certain payments by states to Medicare scheduled under current law are as scheduled under current law Assumptions About Revenues Individual Income Taxes As scheduled under current law Through 2020, tax cuts from EGTRRA and JGTRRA are extended (except for rate reductions that apply to high-income taxpayers) and AMT relief is extended; thereafter, individual income taxes are adjusted to keep total revenues constant as a share of GDP Payroll Taxes As scheduled under current law As scheduled under current law Corporate Income Taxes As scheduled under current law through 2020; remaining As scheduled under current law through 2020; remaining constant as a share of GDP thereafter constant as a share of GDP thereafter Excise Taxes As scheduled under current law As scheduled under current law though 2020; remaining constant as a share of GDP thereafter Estate and Gift Taxes As scheduled under current law 2009 tax rates and exemption amount (adjusted for inflation) continue through 2020; revenues are constant as a share of GDP thereafter Other Sources of Revenue As scheduled under current law through 2020; remaining As scheduled under current law through 2020; remaining constant as a share of GDP thereafter constant as a share of GDP thereafter Source: Congressional Budget Office. Notes: The extended-baseline scenario adheres closely to current law, following CBO’s 10-year baseline budget projections through 2020 (with adjustments for the recently enacted health care legislation) and then extending the baseline concept for the rest of the long- term projection period. The alternative fiscal scenario incorporates several changes to current law that are widely expected to occur or that would modify some provisions that might be difficult to sustain for a long period. CHIP = Children’s Health Insurance Program; GDP = gross domestic product; EGTRRA = Economic Growth and Tax Relief Recon- ciliation Act of 2001; JGTRRA = Jobs and Growth Tax Relief Reconciliation Act of 2003; AMT = alternative minimum tax. CBO
  • 18.
    4 THE LONG-TERM BUDGET OUTLOOK Box 1-1. The Statutory Pay-As-You-Go Act of 2010 In February 2010, lawmakers enacted a new version Act provides special treatment for legislation that of some of the budget enforcement procedures that does the following: were in effect in the 1990s. The Statutory Pay-As- You-Go Act of 2010 (Public Law 111-139) aims to B Amends or supersedes the system for updating make sure that most new legislation affecting reve- Medicare’s payments to physicians; nues or mandatory spending does not increase federal budget deficits. The law requires the Congressional B Continues the parameters of the estate and gift Budget Office (CBO) to estimate the potential bud- taxes at their 2009 levels, adjusted for inflation; getary effects of proposed legislation that is subject to the new procedures; it also requires the Office of B Adjusts the exemption amounts under the alterna- Management and Budget to keep a running tally of tive minimum tax to keep the number of people the average annual budgetary impact of any such leg- affected by that tax at the same level as in 2008; or islation that is enacted.1 If, at the end of a Congres- sional session, the tally shows a net cost for the bud- B Extends certain expiring provisions of the Eco- get year from such legislation, the Administration nomic Growth and Tax Relief Reconciliation must order a sequestration—canceling certain already Act of 2001 and the Jobs and Growth Tax Relief enacted mandatory funding—to cover that cost. Reconciliation Act of 2003 for taxpayers who cur- rently make less than $250,000 (in the case of Under current law, some payment rates and tax rates couples filing joint returns) or $200,000 (in the will change significantly if they are not extended at case of single filers). their present levels. The Statutory Pay-As-You-Go Such legislation is subject to the new law’s pay-as- you-go rules. But the tally of the budgetary effects of 1. The Statutory Pay-As-You-Go Act does not apply to discre- the legislation must reflect specific “current-policy tionary funding provided in appropriation acts or to any leg- adjustments” that reduce the recorded cost of those islative provision that the Congress designates as an changes. The authority to allow for such adjustments emergency requirement. expires on January 1, 2012. interest rates and economic growth. It also omits the last year, the highest level since World War II. Those fac- impact that higher effective marginal tax rates and the tors will keep spending at roughly the same level in 2010 increasing value of government benefits would have on and 2011, CBO projects. However, as the economy incentives to work and save.4 recovers and the budgetary effects of those policies dimin- ish, primary spending is projected to decline to 20 per- The Extended-Baseline Scenario cent of GDP and remain near that level through 2020. In Under CBO’s current-law scenario, primary spending— subsequent years, primary spending would follow a long all spending except interest payments on federal debt— upward trajectory under the extended-baseline scenario, would drop relative to GDP in the next few years, level reaching 24 percent of GDP in 2035 (see the top panel of out for the rest of the decade, and grow significantly in later decades. The severe recession and financial turmoil, Figure 1-1) and 30 percent in 2080.5 (This report focuses as well as federal policies implemented in response to on primary spending because growth in debt as a share of them, pushed primary spending to 23 percent of GDP GDP is determined mainly by the relationship between revenues and primary outlays.) 4. Effective marginal tax rates on labor or capital income represent the percentage of the last dollar of such income that is taken by 5. Longer-term versions of some of the figures in this chapter are federal taxes. presented in Appendix A. CBO
  • 19.
    CHAPTER ONE THE LONG-TERM BUDGET OUTLOOK 5 Figure 1-1. Revenues and Primary Spending, by Category, Under CBO’s Long-Term Budget Scenarios (Percentage of gross domestic product) Extended-Baseline Scenario 30 Actual Projected 25 Total Primary Spending Revenues 20 Other Noninterest Spending 15 10 Medicare, Medicaid, CHIP, and Exchange Subsidies 5 Social Security 0 2000 2005 2010 2015 2020 2025 2030 2035 Alternative Fiscal Scenario 30 Actual Projected Revenues Total Primary Spending 25 20 Other Noninterest Spending 15 10 Medicare, Medicaid, CHIP, and Exchange Subsidies 5 Social Security 0 2000 2005 2010 2015 2020 2025 2030 2035 Source: Congressional Budget Office. Notes: Primary spending refers to all spending other than interest payments on federal debt. The extended-baseline scenario adheres closely to current law, following CBO’s 10-year baseline budget projections through 2020 (with adjustments for the recently enacted health care legislation) and then extending the baseline concept for the rest of the long- term projection period. The alternative fiscal scenario incorporates several changes to current law that are widely expected to occur or that would modify some provisions that might be difficult to sustain for a long period. (For details, see Table 1-1 on page 3.) CHIP = Children’s Health Insurance Program. CBO
  • 20.
    6 THE LONG-TERM BUDGET OUTLOOK Revenues would also rise considerably under current law; On the revenue side, the alternative fiscal scenario by the 2020s, they would reach higher levels relative to the incorporates the assumptions that most of the cuts in size of the economy than ever recorded in the nation’s his- individual income taxes enacted in 2001 and 2003 that tory. Currently about 15 percent of GDP, revenues would are now scheduled to expire in 2011 (except the lower jump to 19 percent in 2012 as the economic recovery rates applying to high-income taxpayers) are extended increased taxable income, and thus tax receipts; as most of through 2020; that relief from the AMT, which expired the tax reductions enacted in 2001 and 2003 expired at after 2009, continues through 2020; and that the 2009 the end of 2010 as scheduled; and as the reach of the parameters of the estate tax (adjusted for inflation) apply AMT expanded greatly, because (unlike most of the tax through 2020. Thereafter, revenues are assumed to code) the dollar amounts of its parameters do not increase remain at their 2020 level of just over 19 percent of GDP, about a percentage point above the average of the past with inflation. In subsequent years, revenues would con- 40 years. That revenue path, combined with the spending tinue to rise relative to GDP, for three main reasons. First, policies described above, would produce a deficit equal to ongoing increases in real income would push taxpayers 16 percent of GDP by 2035 and would push federal debt into higher tax brackets. Second, ongoing inflation, even to levels unprecedented in the United States. Debt would if modest, would cause more people to owe tax under the exceed 100 percent of GDP by 2023 and 200 percent by AMT. And third, the recently enacted excise tax on certain 2037. high-premium health insurance plans would have a grow- ing effect on revenues. Taken together, those factors would cause federal revenues to grow faster than the econ- The Long-Term Outlook for Spending omy, reaching 23 percent of GDP in 2035 and 30 percent Excluding interest payments on debt held by the public, in 2080. federal outlays have averaged 18.5 percent of GDP over the past 40 years. Such primary spending is now unusu- However, even with revenues rising to those levels (and ally high—and is expected to remain so through next omitting the economic effects of such increases), the bud- year—because of the recent recession, tumult in financial get would still be out of balance over the long term under markets, and policies implemented in response to those the extended-baseline scenario. As a result, the deficit conditions. However, CBO projects that such outlays will decline to 20 percent of GDP by 2014. (including interest costs) would equal about 4 percent of GDP in 2035, and federal debt held by the public would Beyond that point, primary spending would rise again continue to accumulate, rising to 79 percent of GDP in under both of CBO’s long-term budget scenarios—to 2035 and larger percentages thereafter. 24 percent of GDP by 2035 under the extended-baseline scenario and to 26 percent under the alternative fiscal The Alternative Fiscal Scenario scenario (see Table 1-2). In both cases, primary outlays Under the alternative fiscal scenario, primary spending would continue to grow steadily in later years. would be 1.6 percentage points higher as a share of GDP in 2020 than under the extended-baseline scenario (see Mandatory Outlays for Health Care the bottom panel of Figure 1-1). That difference would Programs and Social Security grow in later years. The higher spending stems from sev- Federal spending for mandatory programs has grown eral assumptions of the alternative fiscal scenario: that sharply as a share of primary outlays in the past several lawmakers would act to raise Medicare’s payments to decades, reaching about 60 percent in recent years. Most physicians; that lawmakers would not allow various of that growth has been concentrated in the three largest restraints on the growth of costs for Medicare and for entitlement programs—Medicare, Medicaid, and Social health insurance subsidies to have their full effect in the decade after 2020; and that federal spending for things 6. Mandatory programs are ones that do not require annual appro- other than major mandatory programs or interest pay- priations by the Congress; the funding available for them is gener- ally not limited. Most mandatory spending is for entitlement ments would be similar to typical recent levels as a per- programs, in which the federal government is required to make centage of GDP (rather than declining through 2020, payments to any person or other entity that meets the eligibility as under the extended-baseline scenario).6 criteria set in law. CBO
  • 21.
    CHAPTER ONE THE LONG-TERM BUDGET OUTLOOK 7 Table 1-2. Projected Spending and Revenues Under CBO’s Long-Term Budget Scenarios (Percentage of gross domestic product) 2010 2020 2035 Extended-Baseline Scenario Spending Primary spending Social Security 4.8 5.2 6.2 Medicarea 3.6 4.1 5.9 Medicaid, CHIP, and exchange subsidies 1.9 2.8 3.8 Other noninterest spending 12.5 ____ 8.3 ____ 7.8 ____ Subtotal, primary spending 22.9 20.4 23.7 Interest spending 1.4 ____ 3.1 ____ 3.9 ____ Total Spending 24.3 23.5 27.6 Revenues 14.9 20.7 23.3 Deficit (-) or Surplus Primary deficit or surplus -8.0 0.3 -0.4 Total deficit -9.4 -2.7 -4.3 Debt Held by the Publicb 62 66 79 Alternative Fiscal Scenario Spending Primary spending Social Security 4.8 5.2 6.2 Medicarea 3.6 4.3 7.0 Medicaid, CHIP, and exchange subsidies 1.9 2.9 3.9 Other noninterest spending 12.5 ____ 9.7 ____ 9.3 ____ Subtotal, primary spending 22.9 22.1 26.4 Interest spending 1.4 ____ 3.8 ____ 8.7 ____ Total Spending 24.3 25.9 35.2 Revenues 14.9 19.3 19.3 Deficit Primary deficit -8.0 -2.9 -7.2 Total deficit -9.4 -6.6 -15.9 Debt Held by the Publicb 62 87 185 Source: Congressional Budget Office. Notes: Primary spending refers to all spending other than interest payments on federal debt. The primary deficit or surplus is the difference between revenues and primary spending. The extended-baseline scenario adheres closely to current law, following CBO’s 10-year baseline budget projections through 2020 (with adjustments for the recently enacted health care legislation) and then extending the baseline concept for the rest of the long- term projection period. The alternative fiscal scenario incorporates several changes to current law that are widely expected to occur or that would modify some provisions that might be difficult to sustain for a long period. (For details, see Table 1-1 on page 3.) CHIP = Children’s Health Insurance Program. a. Spending for Medicare beneficiaries includes amounts funded through beneficiaries’ premiums. b. At the end of the year. CBO
  • 22.
    8 THE LONG-TERM BUDGET OUTLOOK Security. Together, federal outlays for those three pro- ever, CBO projects that the number of workers per grams accounted for an average of 46 percent of primary beneficiary will decline significantly over the next quarter spending over the past 10 years, up from 27 percent in century (from 2.9 in 2010 to 2.0 in 2035) and then will 1975. continue to drift downward. Under CBO’s scenarios, all of the projected growth in In the case of the major mandatory health care programs, primary outlays as a share of GDP in coming years stems both aging and the rapid growth of per capita health care from increases in mandatory spending, particularly in costs are responsible for the projected rise in federal spending for the government’s major health care pro- spending as a share of GDP, because more elderly people grams: Medicare, Medicaid, the Children’s Health Insur- will use increasingly expensive health care. (For a detailed ance Program (CHIP), and insurance subsidies that will breakdown of the roles played by those two factors, see be provided through the exchanges created by the Box 1-2 on page 10.) In its long-term projections, CBO recently enacted health care legislation. Under both of anticipates that spending growth for health programs will CBO’s scenarios, total outlays for those health programs moderate from past rates even if federal laws do not would roughly double as a share of GDP over the next change (see Chapter 2). Both Medicaid and CHIP are 25 years, from 5.5 percent in 2010 to about 10 percent or financed jointly by the federal government and state gov- 11 percent in 2035.7 (For details about long-term projec- ernments, so growth in federal spending is expected to tions of health care spending, see Chapter 2.) Spending slow as states move to limit their costs. And even without on Social Security would rise much more slowly, from changes to the laws governing Medicare, growth in almost 5 percent of GDP in 2009 to about 6 percent in spending on that program is projected to slow (though the 2030s and beyond (see Chapter 3). to a lesser degree than for the other health programs) because of future regulatory changes to the program and Causes of Spending Growth. Two factors account for the changes to the health care system as a whole. projected increases in outlays for the government’s large entitlement programs: the aging of the population and Effects of Recent Legislation. The health care legislation the rapid growth of health care costs per capita. The enacted in March 2010—the Patient Protection and retirement of the large baby-boom generation born Affordable Care Act (P.L. 111-148), as modified by the between 1946 and 1964 portends a long-lasting shift in Health Care and Education Reconciliation Act (P.L. 111- the age profile of the U.S. population. That shift will sub- 152)—will cause major changes in the components of stantially alter the balance between the working-age and federal spending on health care. Both the expansion of retirement-age segments of the population. The share of eligibility for Medicaid and the provision of subsidies people age 65 or older is projected to grow from 13 per- through new insurance exchanges will increase federal cent in 2010 to 20 percent in 2035, while the share of spending. At the same time, the legislation contains vari- people ages 20 to 64 is expected to fall from 60 percent to ous provisions that will substantially reduce spending on 55 percent. In later decades, the aging of the population Medicare relative to what would have occurred under is expected to continue, but at a slower rate, because of prior law. On net, the legislation will raise federal spend- increases in life expectancy. ing on health care during most of the next two decades but lower it by the end of the second decade, according to In the case of Social Security, population aging drives the the projections of CBO and the staff of the Joint Com- projected growth of spending as a percentage of GDP. mittee on Taxation (JCT). During that period, the net Initial Social Security benefits are based on an individual’s effects in either direction represent less than 0.5 percent earnings, indexed to the overall growth of wages. Because of GDP in any year. average benefits increase at approximately the same rate as average earnings, economic growth does not significantly As discussed in Chapter 2, CBO does not believe it has change Social Security spending as a share of GDP. How- an analytic basis for evaluating the effects of the legisla- tion on the growth rate of spending over the very long 7. Those totals include gross Medicare spending (that is, they do not run. Therefore, after the next decade or two (depending net out offsetting receipts, which consist mainly of premiums paid on the scenario), the projections in this report extrapolate by Medicare beneficiaries). federal spending on health care (including the incremen- CBO
  • 23.
    CHAPTER ONE THE LONG-TERM BUDGET OUTLOOK 9 tal effects of the legislation) using the same growth rates baseline scenario—a difference that persists in later years that would be assumed in the absence of the legislation. because the growth rates of spending beyond that point Because those growth rates are applied to different levels are the same under the two scenarios. That gap highlights of spending, however, health care spending varies from the important implications of those health care policies the amounts that would be projected without that legisla- for the federal budget. tion for the rest of the long-term projection period. Under both scenarios, the trust funds for Social Security Differences Between the Long-Term Scenarios. Spending and Part A of Medicare would become insolvent during for Social Security would be identical under CBO’s the long-term projection period.10 However, to measure extended-baseline and alternative fiscal scenarios, and the imbalance between the revenues and the outlays for spending for Medicaid, CHIP, and the exchange subsidies benefits currently specified in law, CBO assumed that the would be very similar. In the case of Medicare, however, two programs would continue to pay benefits as now spending would be about 1 percentage point higher rela- scheduled. (Spending for other parts of Medicare also tive to GDP in 2035 under the alternative fiscal scenario flows through a trust fund, but automatic infusions of than under the extended-baseline scenario, and the differ- general funds effectively ensure that it cannot become ence would widen to 2 percentage points by 2080. Those insolvent. Medicaid has no underlying trust fund.) projected spending paths differ for two main reasons: B Under the current-law assumptions of the extended- Other Federal Outlays baseline scenario, Medicare’s sustainable growth rate A larger difference between the two scenarios involves mechanism would reduce payment rates for physicians projections of federal spending for everything besides the by 21 percent this year, with additional smaller reduc- major mandatory health programs and Social Security. tions for the next few years.8 Under the alternative fis- Other primary spending (net of Medicare premiums and cal scenario, by contrast, Medicare’s payment rates for other offsetting receipts) would total about 8 percent of physicians would be stable in 2010 and then increase GDP in 2020 under the extended-baseline scenario and gradually. about 10 percent under the alternative fiscal scenario, declining slowly thereafter in both cases. Under the B The extended-baseline scenario incorporates the extended-baseline scenario, interest payments by the gov- effects of the recent health care legislation, as esti- ernment would increase to almost 4 percent of GDP by mated by CBO and JCT, over the next 20 years and 2035 and then remain close to that level thereafter. Under then extrapolates those effects on spending levels in the alternative fiscal scenario, interest spending would later years.9 By contrast, the alternative fiscal scenario equal 9 percent of GDP in 2035 and would continue to incorporates the estimated effects of that legislation rise dramatically—by 2055, it would exceed that year’s for only 10 years and then extrapolates the estimated total federal revenues. changes in spending levels beyond that. In particular, several policies that would restrain the growth of Other Noninterest Spending Under the Extended- spending for Medicare are assumed in the alternative Baseline Scenario. For the extended-baseline scenario, scenario not to be in effect after 2020, yielding a CBO used its 2010–2020 baseline projections of outlays higher level of spending in the 2020s and beyond. for programs other than the major mandatory health care programs and Social Security. This year, about one- The upshot of those differences is that Medicare spending seventh of those outlays (or about 1.9 percent of GDP) in 2035 is projected to be about 17 percent higher under the alternative fiscal scenario than under the extended- are associated with the federal government’s response to 10. The balances of those trust funds represent the total amount that 8. Those projections do not include the effects of recent legislation the government is legally authorized to spend on each program. that delayed the reduction in payment rates until December 2010. For a discussion of the legal issues related to trust fund insolvency, 9. See Congressional Budget Office, letter to the Honorable Nancy see Christine Scott, Social Security: What Would Happen If the Pelosi about the budgetary effects of H.R. 4872, the Reconcilia- Trust Funds Ran Out? Report for Congress RL33514 (Congres- tion Act of 2010 (March 20, 2010). sional Research Service, August 20, 2009). CBO
  • 24.
    10 THE LONG-TERM BUDGET OUTLOOK Box 1-2. How the Aging of the Population and Rising Costs for Health Care Affect Federal Spending on Major Mandatory Programs In the Congressional Budget Office’s (CBO’s) long- health care programs and Social Security: the aging of term projections of spending, growth in noninterest the U.S. population, which increases the number of spending as a share of gross domestic product (GDP) beneficiaries in those programs, and rapid growth in is attributable entirely to increases in spending on health care costs per beneficiary. CBO calculated how several large mandatory programs: Social Security, much of the projected rise in federal spending for the Medicare, Medicaid, and (to a lesser extent) insur- health care programs and Social Security under the ance subsidies that will be provided through the extended-baseline scenario is attributable to aging exchanges established by the recently enacted health and how much is attributable to “excess cost care legislation.1 The health programs are the main growth”—the extent to which health care costs per drivers of that growth; they are responsible for enrollee (adjusted for changes in the age profile of the 80 percent of the total projected rise in spending on population) grow faster than GDP per capita. CBO those mandatory programs over the next 25 years. made that calculation by comparing the outlays pro- jected under the extended-baseline scenario with the Two factors underlie the projected increase in federal outlays that would occur under two alternative paths: spending on the government’s major mandatory one with an aging population but no excess cost growth for health care programs, and one with no aging but with excess cost growth. 1. Under the new law, certain people with income up to 400 percent of the federal poverty level will be eligible for federal subsidies to reduce their cost of obtaining private The interaction between the aging of the population health insurance coverage. Although the premium subsidies and excess cost growth accentuates their individual are structured as tax credits, most of the funds involved will effects. As aging causes the number of beneficiaries of be classified as outlays because their value will generally Medicare and Medicaid to rise, higher health care exceed what recipients’ income tax liability would otherwise spending per person has a larger impact. Conversely, be. CBO’s spending projections for major mandatory health care programs also include the Children’s Health Insurance when health care costs are growing, having more Program, but spending on that program constitutes less than beneficiaries imposes a larger budgetary cost. That 0.1 percent of GDP. interaction can be identified separately, or—as in Continued the recent recession.11 Over the coming decade, such expected to equal 1.1 percent of GDP this year)—is spending is either scheduled to expire under current law assumed to increase at the same rate as inflation through or is explicitly assumed in CBO’s projections to be tem- 2020. Because output generally grows faster than prices porary and not to recur. Much of the rest of the govern- do, that spending is projected to shrink as a share of ment’s other noninterest spending—including spending GDP: from 12.5 percent this year to 10.9 percent in on military operations in Iraq and Afghanistan (which is 2012 and 8.3 percent in 2020. 11. The total amount of 1.9 percent of GDP includes outlays from For later years, other noninterest outlays are generally the American Recovery and Reinvestment Act of 2009 (Public assumed to remain constant at their 2020 levels as a share Law 111-5) and the portion of outlays for unemployment insur- of GDP under the extended-baseline scenario. However, ance and the Supplemental Nutrition Assistance Program (for- two components of that spending were modeled merly known as Food Stamps) that CBO estimates would not occur if economic output were at its potential level. For a related explicitly. First, premiums paid by Medicare beneficiaries discussion, see Congressional Budget Office, The Effects of Auto- and certain payments by states to Medicare—which matic Stabilizers on the Federal Budget (May 2010). are classified as offsetting receipts (that is, as offsets to CBO
  • 25.
    CHAPTER ONE THE LONG-TERM BUDGET OUTLOOK 11 Box 1-2. Continued How the Aging of the Population and Rising Costs for Health Care Affect Federal Spending on Major Mandatory Programs Explaining Projected Growth in Federal effect on spending for Social Security. Given the sub- Spending on Major Mandatory Health Care stantial uncertainties that exist about long-term rates Programs and Social Security by of cost growth for health care, much more caution 2035 and 2080, by Source should be applied to those longer-term projections. (Percent) (For a discussion of the rates of excess cost growth Excess Cost that underlie those calculations, and the basis for Aging Growth them, see Chapter 2.) Major Health Care Programs Looking only at the major health care programs, and Social Security CBO found excess cost growth to be the main factor 2035 63 37 responsible for the projected increase in federal 2080 44 56 spending for those programs. Specifically, excess Major Health Care Programs cost growth accounts for 55 percent of the programs’ projected growth by 2035 and 71 percent by 2080. 2035 45 55 2080 29 71 Again, the precision of those calculations should not be taken as an indication of certainty. Future rates of Source: Congressional Budget Office. aging and especially of excess cost growth could differ substantially from CBO’s assumptions, particularly in CBO’s analysis—it can be allocated according to the the longer term. shares attributable to aging and excess cost growth. Of the two factors, aging is the more important over Sources of Growth in Federal Spending on the next 25 years. With the interaction allocated Major Mandatory Health Care Programs and between the two, aging accounts for 63 percent of the Social Security, 2010 to 2035 total projected growth in spending on Social Security (Percentage of gross domestic product) and the major mandatory health care programs by 2035, and excess cost growth accounts for 37 percent 18 Effect of Excess (see the table above and the figure at right). That 16 Cost Growth result is not surprising given that the aging of the 14 baby-boom generation will significantly expand the 12 number of people participating in many of those Effect of Aging 10 programs. 8 6 Spending in the Absence of Over the longer term, however, the situation changes. Aging and Excess Cost Growth By 2080, excess cost growth is responsible for 56 per- 4 cent of the total projected growth in federal spending 2 on the health care programs and Social Security, and 0 the share attributable to aging falls to 44 percent. The 2010 2015 2020 2025 2030 2035 impact of excess cost growth is felt only in the health care programs; rising health care costs have no direct Source: Congressional Budget Office. CBO
  • 26.
    12 THE LONG-TERM BUDGET OUTLOOK outlays) and which will equal 0.4 percent of GDP in its 10-year baseline projections, CBO projects that inter- 2010—are projected to increase at the same rate as gross est spending will increase again—to 2.0 percent of GDP Medicare outlays.12 When those offsetting receipts rise, in 2013 and 3.1 percent in 2020—as federal debt grows total spending falls. Second, the refundable portions of and interest rates rebound from their recent unusually the earned income tax credit and the child tax credit, low levels. which the budget records as outlays, were modeled along with revenues. Such refunds are projected to decrease For the long-term budget projections, CBO assumed that over time as incomes rise. Because of the projected interest rates would remain stable after 2020, meaning changes in those two components, other primary spend- that interest outlays would grow at the same pace as fed- ing is projected to decline to 7.8 percent of GDP by eral debt. Under the extended-baseline scenario, annual 2035. For comparison, over the past 40 years, such interest spending would approach 4 percent of GDP by spending has never fallen below 8.3 percent of GDP. 2035 and then grow slowly, reaching 5 percent in 2080. Under the alternative fiscal scenario, interest spending Other Noninterest Spending Under the Alternative Fiscal would grow much faster—from 4 percent of GDP in Scenario. In the alternative fiscal scenario, spending for 2020 to almost 9 percent by 2035 and much more in most programs other than the major mandatory health later years—because of widening deficits and ballooning care programs and Social Security is assumed to match debt. As discussed later in this chapter, higher federal CBO’s baseline projections for the next few years debt would in fact lead to higher interest rates, making (12.5 percent of GDP in 2010, 12.4 percent in 2011, interest outlays even larger, particularly under the alterna- and 10.9 percent in 2012). For subsequent years, CBO’s tive fiscal scenario. starting point was to assume that such spending would remain at this year’s levels relative to GDP rather than declining to the 2020 levels relative to GDP projected in The Long-Term Outlook for Revenues the baseline. However, in extrapolating this year’s levels, Federal revenues have fluctuated between 15 percent and CBO removed the budgetary effect of unusual, short- 21 percent of GDP over the past 40 years, averaging term policies related to current economic conditions. about 18 percent. Just as spending priorities have With those policies (and offsetting receipts related to changed during that period, the composition of revenues Medicare) excluded, primary spending on programs other has shifted. Receipts from payroll taxes have grown faster than the major mandatory health care programs and than GDP, producing a larger share of total revenue.13 At Social Security will equal 10.5 percent of GDP in 2010, the same time, the shares of revenue contributed by cor- CBO estimates. Under the alternative fiscal scenario, that porate income taxes and excise taxes have shrunk. percentage would continue from 2013 through the end of the long-term projection period. After totaling nearly 18 percent of GDP in 2008, federal revenues fell sharply the following year, to about 15 per- Net of offsetting receipts from Medicare and outlays on cent of GDP, because of the recession and the tax cuts refundable tax credits, other noninterest spending is pro- enacted in response to it. CBO expects revenues to jected to equal 10.2 percent of GDP in 2013. Thereafter, remain near 15 percent of GDP this year. However, because of increases in offsetting receipts and decreases in under the current-law assumptions of CBO’s baseline, tax credit refunds, the net amount is projected to decline revenues would rebound over the next decade with to 9.3 percent of GDP by 2035. improvement in the economy, the scheduled expiration of tax cuts enacted in 2001 and 2003, and sharp growth Interest Spending. For much of the past decade, federal in the number of taxpayers subject to the alternative min- debt was relatively constant as a share of GDP, but federal imum tax. As a result, revenues would equal 19 percent of interest spending declined (from 2.3 percent of GDP in GDP in 2012 and close to 21 percent in 2020. 2000 to 1.3 percent in 2009) because interest rates fell. In 13. The bulk of payroll tax revenue comes from taxes designated for 12. In Congressional Budget Office, The Long-Term Budget Outlook Social Security and Medicare; smaller amounts come from unem- (June 2009), those offsetting receipts were netted against Medi- ployment insurance taxes and contributions to federal retirement care spending rather than against other spending. programs. CBO
  • 27.
    CHAPTER ONE THE LONG-TERM BUDGET OUTLOOK 13 Under the extended-baseline scenario, revenues would shortfalls accumulate over time, whereas the “fiscal gap” continue to rise gradually thereafter, reaching 23 percent summarizes the shortfall over a given period in a single of GDP by 2035. That increase would occur largely value. Both measures show that projected revenues are because, under current law, real growth in income would insufficient to support projected spending—with a fairly push people into higher tax brackets over time and infla- modest divergence under the extended-baseline scenario tion-related increases in income would make more and a very large one under the alternative fiscal scenario. income subject to the AMT. As a result of those factors, Looking at how the fiscal gap changes over time demon- the effective marginal tax rate on labor income would rise strates the effect of delaying action to address the budget- from 29 percent today to about 38 percent in 2035. Rev- ary imbalance. enues would also increase relative to GDP throughout the projection period because the recently enacted excise tax The Accumulation of Federal Debt on certain high-premium health insurance plans would For a combination of federal spending and revenues to be affect a growing share of plans over time. All told, average sustainable over time, the resulting debt must eventually tax rates (taxes as a share of income) would rise consider- grow no faster than the economy. The most meaningful ably, and people at various points in the income scale measure of federal debt for such projections is debt held would pay a very different percentage of their income by the public, which represents the amount that the gov- in taxes than people at the same points do today. ernment is borrowing in the financial markets (by issuing Treasury securities) to pay for federal operations and For the alternative fiscal scenario, by contrast, CBO activities. That borrowing competes with other partici- assumed that current tax law would be changed over time pants in the credit markets for financial resources and can to continue certain policies to which people have grown crowd out private investment.14 accustomed and to keep revenues as a percentage of GDP more consistent with past patterns. Specifically, CBO A useful barometer of fiscal policy is the amount of gov- assumed that through 2020, most of the tax cuts enacted ernment debt held by the public relative to annual eco- in 2001 and 2003 would continue (except rate reductions nomic output. Such debt stood at 40 percent of GDP at applying to high-income taxpayers), relief from the AMT the end of 2008, a little above the 40-year average of would continue, and the estate tax would be extended 36 percent. Since then, large deficits have caused debt with the rates and exemption amounts (adjusted for infla- held by the public to increase sharply—to 53 percent of tion) in effect in 2009. (If those changes to current law GDP at the end of 2009 and, CBO projects, to 62 per- were made, they would receive special treatment under cent by the end of this year. Debt has exceeded 50 percent the Statutory Pay-As-You-Go Act of 2010, as explained in of GDP during only one other period in U.S. history: Box 1-1 on page 4.) Beyond 2020, CBO assumed that between 1942 and 1956, when it spiked (peaking at tax law would evolve to keep total revenues at the same 109 percent of GDP) because of a surge in federal share of GDP as in 2020. Under those assumptions, reve- spending during World War II. nues would increase to just over 19 percent of GDP in 2020 (rather than the almost 21 percent under the Under the assumptions of CBO’s extended-baseline sce- extended-baseline scenario) and would remain at that nario, annual budget deficits would decline to 2.3 per- level in later years. Thus, revenues projected under the cent of GDP by 2014. After that, both deficits and debt alternative fiscal scenario are lower than those estimated would remain stable relative to GDP for several years. But under the extended-baseline scenario by more than 1 per- then growth in spending on the major mandatory health cent of GDP in 2020 and by about 4 percent in 2035. care programs, Social Security, and interest payments (Details of CBO’s long-term revenue projections are would cause deficits to increase, and debt would once presented in Chapter 4.) again grow faster than the economy. By 2035, it would equal 79 percent of GDP (see Figure 1-2). The Size of the Fiscal Imbalance 14. In contrast, debt held by trust funds and other government How large is the long-term budgetary shortfall facing the accounts—which, together with debt held by the public, make up U.S. government? Two measures offer complementary gross federal debt—represents internal transactions of the govern- perspectives: Annual amounts of federal debt show how ment and thus has no effect on credit markets. CBO
  • 28.
    14 THE LONG-TERM BUDGET OUTLOOK Figure 1-2. Federal Debt Held by the Public Under CBO’s Long-Term Budget Scenarios (Percentage of gross domestic product) 200 Actual Projected 175 150 125 Alternative Fiscal Scenario 100 75 Extended-Baseline Scenario 50 25 0 2000 2005 2010 2015 2020 2025 2030 2035 Source: Congressional Budget Office. Note: The extended-baseline scenario adheres closely to current law, following CBO’s 10-year baseline budget projections through 2020 (with adjustments for the recently enacted health care legislation) and then extending the baseline concept for the rest of the long- term projection period. The alternative fiscal scenario incorporates several changes to current law that are widely expected to occur or that would modify some provisions that might be difficult to sustain for a long period. (For details, see Table 1-1 on page 3.) Under the alternative fiscal scenario, deficits would also (23.3 percent of GDP in 2035, compared with 19.3 per- decline for a few years after 2010 and then grow again, cent under the alternative fiscal scenario), and noninterest but at a much faster rate. By 2020, debt would approach spending for things other than the major mandatory 90 percent of GDP. After that, the growing imbalance health programs and Social Security would reach the between revenues and noninterest spending, combined lowest levels relative to output since before World War II with the spiraling cost of interest payments, would swiftly (7.8 percent of GDP in 2035, compared with 9.3 percent push debt to unsustainable levels. Debt would surpass its under the alternative fiscal scenario). With the changes historical peak of 109 percent of GDP by 2025 and assumed in the extended-baseline scenario, the sharp would exceed 200 percent of GDP in 2037. increase in outlays projected for the major health care programs and Social Security could be accommodated The federal government could not issue ever-larger with a fairly small increase in debt relative to the size of amounts of debt relative to the size of the economy indef- the economy. initely. If debt continued to rise rapidly relative to GDP, investors at some point would begin to doubt the govern- Many budget analysts believe that the alternative fiscal ment’s willingness to pay interest on that debt. Therefore, scenario presents a more realistic picture of the nation’s under the alternative fiscal scenario, the government underlying fiscal policy than the extended-baseline sce- would eventually need to cut spending well below the nario does—because, for example, it does not allow the levels projected under that scenario or increase taxes well impact of the AMT to expand substantially. The explo- above their average historical percentage of GDP to put sive path of federal debt under the alternative fiscal the federal budget on a sustainable path. scenario underscores the need for large and rapid policy changes to put the nation on a sustainable fiscal course. Debt would rise much more slowly relative to GDP under the extended-baseline scenario because current law The Fiscal Gap would lead to both of those sorts of adjustments. In that How much would policies have to change to avoid unsus- scenario, revenues would reach historically high levels tainable increases in government debt? A useful answer CBO
  • 29.
    CHAPTER ONE THE LONG-TERM BUDGET OUTLOOK 15 Table 1-3. The Federal Fiscal Gap Under CBO’s Long-Term Budget Scenarios (Percentage of gross domestic product) Present Value of the Future Stream of Revenues or Outlays over a Given Period Fiscal Gap Projection Period Revenues Outlays (Outlays minus revenues) Extended-Baseline Scenario 25 Years (2010 to 2034) 22.7 23.9 1.2 50 Years (2010 to 2059) 23.7 24.5 0.8 75 Years (2010 to 2084) 25.0 25.7 0.7 Alternative Fiscal Scenario 25 Years (2010 to 2034) 20.7 25.5 4.8 50 Years (2010 to 2059) 19.8 26.7 6.9 75 Years (2010 to 2084) 19.5 28.2 8.7 Source: Congressional Budget Office. Notes: The fiscal gap is a measure of federal shortfalls over a given period. It represents the extent to which the government would need to immediately and permanently either raise tax revenues or cut spending—or do both, to some degree—to make the government’s debt the same size (relative to gross domestic product, or GDP) at the end of the period that it was at the beginning of 2010. To allow for the increase in the nominal value of federal debt that would occur even if that debt was maintained at its current share of GDP outlays include current debt, and revenues include the present value of the target end-of-period debt. (The end-of-period debt is , equal to GDP in the last year of the period multiplied by the ratio of debt to GDP at the beginning of 2010. A present value is a single number that describes a flow of future revenues or outlays in terms of an equivalent lump sum received or spent today.) The extended-baseline scenario adheres closely to current law, following CBO’s 10-year baseline budget projections through 2020 (with adjustments for the recently enacted health care legislation) and then extending the baseline concept for the rest of the long- term projection period. The alternative fiscal scenario incorporates several changes to current law that are widely expected to occur or that modify some current provisions that might be difficult to sustain for a long period. (For details, see Table 1-1 on page 3.) comes from looking at the fiscal gap, which measures the quarter century. If the change came entirely from reve- immediate change in spending or revenues that would be nues, it would amount to roughly a one-quarter increase necessary to keep the debt-to-GDP ratio the same at the in revenues relative to the amount projected for 2020 and end of a given period as at the beginning of the period. later years. If the change came entirely from spending, it The fiscal gap is conceptually similar to the actuarial would represent a cut of roughly one-fifth in primary imbalance for Social Security (see Table 3-1 in spending from the amount projected for 2020 and a cut Chapter 3). Both measures quantify a long-term shortfall of one-sixth from the amount projected for 2035. in present-value terms—that is, as a single number that describes a flow of future revenues or outlays in terms of an equivalent lump sum received or spent today—and both can be expressed as a share of GDP.15 15. The fiscal gap equals the present value of revenues over a given period minus the present value of outlays over that period, adjusted to keep federal debt at its current percentage of GDP. The fiscal gap over the next 25 years would amount to Specifically, current debt is added to the outlay measure, and the 1.2 percent of GDP under the extended-baseline scenario present value of the target end-of-period debt (which equals GDP or 4.8 percent under the alternative fiscal scenario (see in the last year of the period multiplied by the ratio of debt to Table 1-3). In other words, relative to the projections of GDP at the beginning of 2010) is added to the revenue measure. the alternative fiscal scenario, an immediate and perma- The present value of a stream of future revenues is computed by taking the revenues for each year, discounting each value to 2010 nent reduction in spending or increase in revenues equal dollars, and summing the resulting series. The same method is to 4.8 percent of GDP—the equivalent of almost applied to the projected stream of outlays. CBO used a real dis- $700 billion in this year’s federal budget—would be count rate equal to the effective interest rate on debt held by the needed to create a sustainable fiscal path for the next public, which was assumed to be 2.7 percent in the long term. CBO
  • 30.
    16 THE LONG-TERM BUDGET OUTLOOK Figure 1-3. The Effect of Delaying Action on the Fiscal Imbalance Reductions in Primary Spending or Waiting to close the fiscal gap would make the necessary Increases in Revenues in Various Years changes larger. To illustrate the costs of delay, CBO simu- Needed to Close the 25-Year Fiscal Gap lated the effects of closing the fiscal gap under the alterna- Under CBO’s Alternative Fiscal tive fiscal scenario beginning in 2011, 2015, 2020, or 2025. Those simulations indicate that postponing action Scenario would substantially increase the size of the policy adjust- (Percentage of gross domestic product) ments needed to put the budget on a sustainable course. 14 For example, if lawmakers wanted to close the fiscal gap 12.3 through 2035 but did not begin until 2015, they would 12 have to reduce primary spending or increase revenues 10 over that period by 5.7 percent of GDP, rather than by 7.9 4.8 percent if they acted in 2011 (see Figure 1-3). If they 8 waited until 2020 to close the fiscal gap through 2035, 6 5.7 they would have to cut noninterest outlays or raise reve- 4.8 nues over that period by 7.9 percent of GDP. Moreover, 4 those simulations omit the effects that deficits and debt 2 would have on economic growth and interest rates in the intervening years; incorporating such effects would make 0 the impact of delaying policy changes even more severe. Actions Actions Actions Actions Begin in Begin in Begin in Begin in 2011 2015 2020 2025 Another perspective on the effects of delay comes from the so-called sustainable spending level—the fixed Source: Congressional Budget Office. amount of outlays (measured as a share of GDP) that Notes: Primary spending refers to all spending other than interest could be supported by a projected stream of revenues. To payments on federal debt. eliminate the fiscal gap through 2035 under the alterna- The fiscal gap is a measure of federal shortfalls over a given tive fiscal scenario, primary outlays could be reduced to period. It represents the extent to which the government 17.3 percent of GDP in 2015 and later. If no changes would need to immediately and permanently either raise tax were made until 2020, primary outlays would have to fall revenues or cut spending—or do both, to some degree—to permanently to 15.9 percent of GDP, and if action was make the government’s debt the same size (relative to gross delayed until 2025, the projected revenue stream would domestic product) at the end of the period that it was at the only support primary outlays of 12.1 percent of GDP beginning of 2010. (see Figure 1-4). By comparison, primary outlays are The alternative fiscal scenario incorporates several changes expected to equal 23.0 percent of GDP this year. to current law that are widely expected to occur or that would modify some provisions that might be difficult to sus- tain for a long period. (For details, see Table 1-1 on page 3.) Uncertainty of Long-Term Over 75 years, the fiscal gap would amount to only Budget Projections 0.7 percent of GDP under the extended-baseline scenario Future budgetary outcomes will depend in large part on because revenues would be approximately the same as pri- future policies—as evidenced by the difference between the debt paths of the two scenarios analyzed in this mary spending in the long term (though both would be report. But outcomes will also depend on factors outside much greater relative to GDP than in the past). Under the direct control of policymakers, such as the state of the the alternative fiscal scenario, deficits would grow every economy and demographic trends. For example, if long- year, so the fiscal gap would be larger over longer periods. term economic growth is slower than projected, deficits Creating a sustainable fiscal path for the next 75 years will be greater for any given set of policies. Conversely, if under that scenario would require immediate and perma- fertility rates are higher than assumed or improvements in nent policy changes equal to 8.7 percent of GDP. mortality are smaller, the population will be younger than CBO
  • 31.
    CHAPTER ONE THE LONG-TERM BUDGET OUTLOOK 17 Figure 1-4. Various Paths for Primary Spending That Would Close the 25-Year Fiscal Gap Under CBO’s Alternative Fiscal Scenario (Percentage of gross domestic product) 25 20 Cuts Begin in 2011 Cuts Begin in 2015 15 Cuts Begin in 2020 10 Cuts Begin in 2025 5 0 2010 2015 2020 2025 2030 Source: Congressional Budget Office. Notes: Primary spending refers to all spending other than interest payments on federal debt. Closing the 25-year fiscal gap would make federal debt the same size (relative to gross domestic product, or GDP) at the end of the period that it was at the beginning. This analysis uses the fiscal gap and revenue projections in CBO’s alternative fiscal scenario and then calculates the amount of primary spending that would close the fiscal gap if spending was held constant as a share of GDP going forward from various points in time. The alternative fiscal scenario incorporates several changes to current law that are widely expected to occur or that would modify some provisions that might be difficult to sustain for a long period. (For details, see Table 1-1 on page 3.) projected, and spending on Social Security and Medicare debt would still grow to more than 150 percent of GDP will be lower as a percentage of GDP for any given set in 2035 under the alternative fiscal scenario.) And even of policies. (Values for the major demographic and eco- if revenues increase significantly relative to GDP in the nomic variables that underpin CBO’s long-term projec- future—as under the extended-baseline scenario—debt is tions are described in Appendix B.) likely to remain at levels that are extremely high by past standards. Indeed, debt is already at historically high lev- The government’s future mandatory spending will also els, and federal interest costs are likely to grow substan- depend crucially on future health care costs. The rate at tially when interest rates return to more normal levels. which health care costs have grown has varied greatly in the past. For an analysis of how altering CBO’s assump- tions about such cost growth would affect projected The Economic Impact of Rising health care spending, see Chapter 2. Federal Debt The economic effects of growth in federal debt depend Although the size of future budgetary shortfalls is uncer- partly on the economic conditions that prevail when defi- tain, if revenues remain at past levels relative to GDP—as cits are incurred. When the long-term outlook for the under the alternative fiscal scenario—federal debt is likely budget appears sustainable, running deficits for a limited to keep growing rapidly under any plausible assumptions time is not necessarily detrimental to the economy. about future trends in the economy, demographics, and Indeed, when the economy has substantial unemploy- health care costs. (For instance, if the rate of productivity ment and unused factories, offices, and equipment, run- growth was 50 percent higher than assumed in this ning deficits generally increases output and employment report, or about equal to the rate seen during the 1960s, relative to what would occur with a balanced budget. For CBO
  • 32.
    18 THE LONG-TERM BUDGET OUTLOOK instance, the larger deficits that result from automatic Whatever policies lawmakers chose to tackle the fiscal declines in tax revenues or increases in government imbalance, taking those actions earlier would lead to spending (such as for unemployment benefits) during higher output in the long run, enhance the well-being of and immediately after a recession help reduce the severity future generations, and reduce the risk of a fiscal crisis. At of the downturn by offsetting some of the decline in dis- the same time, however, early action could make current posable income and thus supporting demand for goods generations worse off than if action was deferred. and services.16 Similarly, policymakers’ actions to go beyond such “automatic stabilizers” by reducing taxes and Crowding Out of Capital and Related increasing spending further during a period of economic Economic Effects weakness can also lessen the severity of the downturn. As Increased government borrowing tends to crowd out pri- an example, CBO estimated that the spending increases vate investment in productive capital, leading to a smaller and tax cuts enacted in the American Recovery and Reinvestment Act of 2009 (P.L. 111-5) boosted output capital stock and lower output in the long run than and employment significantly during the past year com- would otherwise be the case. Deficits tend to have that pared with what would have happened in the absence of effect on private investment because the portion of that legislation.17 Thus, the federal government’s ability people’s savings used to buy government bonds is not to run budget deficits enables fiscal policy to offset some available to pay for such investment. of the negative effects of recessions. An exception is that government borrowing to finance Even temporary deficits, however, produce increases in public investment, such as improvements in infrastruc- debt that have harmful consequences in the long run ture, need not reduce future output if the public invest- (assuming the government does not run budget surpluses ment is as productive as private investment. However, the later to retire the additional debt). Moreover, economic long-term rise in debt projected by CBO is driven by fluctuations resulting from business cycles are not the increases in government transfer payments (such as fundamental source of the long-term budgetary pressures spending on entitlement programs) rather than increases facing the nation. Instead, outlays are projected to rise in government investment. above the amount that can be funded from current rates of taxation because of increases in Social Security spend- Other factors can offset some of that crowding-out effect. ing and, more important, continuing growth in federal Greater government borrowing tends to lead to greater spending on health care programs as a share of GDP (see private saving, which increases the funds available both to Box 1-2 on page 10). If those developments are not pre- purchase government debt and to finance private invest- vented or offset through changes elsewhere in the budget, the resulting increase in deficits will hurt the economy ment. Government borrowing generally boosts private through several channels, as described below. saving for several reasons: At the same time, steps taken to address the looming B Crowding out usually leads to higher interest rates, deficits could also have negative consequences. Raising which raise the return on saving; revenues significantly relative to GDP (as under the extended-baseline scenario) would harm the economy B Some people save more because they anticipate that through the impact on people’s decisions about how taxes will be raised, or spending cut, in the future to much to work and save. The size of that impact, and cover the cost of paying interest on the accumulated its implications for individuals, would depend crucially debt; and on the specific tax policies involved. Cutting federal spending could also have negative effects on individuals, B The policies that give rise to deficits (such as tax cuts businesses, and the economy. or increased government transfer payments) put more money in private hands, some of which is probably 16. See Congressional Budget Office, The Effects of Automatic Stabiliz- saved. ers on the Federal Budget. 17. See Congressional Budget Office, Estimated Impact of the Ameri- Overall, however, the offsetting rise in private saving is can Recovery and Reinvestment Act on Employment and Economic generally smaller than the change in the deficit, so greater Output from January 2010 Through March 2010 (May 2010). government borrowing leads to lower national saving. CBO
  • 33.
    CHAPTER ONE THE LONG-TERM BUDGET OUTLOOK 19 Lower national saving means that the nation as a whole is Under the extended-baseline scenario, crowding-out setting aside fewer resources for the future, which results effects would be more modest. Real GDP per capita in lower income in the long run than would otherwise would be slightly lower, and debt as a percentage of GDP occur. That reduction in saving leads to lower domestic slightly higher, than under stable economic conditions investment. At the same time, however, higher interest (see Figure 1-6). However, those projections of GDP and rates attract more foreign capital to the United States and debt do not incorporate the negative impact that the induce U.S. savers to keep more of their money at home. higher tax rates in effect under that scenario would have Such net inflows of capital prevent U.S. investment from on incentives to work and save. declining as much as national saving does. But those capital inflows also create the obligation for more profits In the second case, CBO analyzed the effects of rising and interest to flow overseas in the future. Therefore, debt using a model of the economy that assumes that although flows of capital into the United States can help people make decisions about how much to work and save maintain domestic investment, the gains from that addi- on the basis of current and anticipated government poli- tional investment do not fully accrue to U.S. residents. cies and economic conditions (such as wages and interest CBO has analyzed the economic effects of rising federal rates). In that analysis, CBO compared economic out- debt under two sets of assumptions. Those analyses go comes under a policy that would stabilize the ratio of beyond the long-term budget projections, which assume debt to GDP earlier with outcomes under a policy that a stable economy unaffected by deficits in the long run. would allow that ratio to grow for another 10 years before being stabilized. The underlying budgetary assumptions In the first case, CBO assessed the impact on the econ- used in the analysis follow those of the alternative fiscal omy if private saving were to respond to changes in scenario (adapted for that particular model) until policy deficits according to a simple rule that reflects how is changed to stabilize the debt-to-GDP ratio.19 In princi- such saving has behaved in the past. Specifically, CBO ple, that ratio could be stabilized through any number of assumed that for each $1 increase in the deficit, con- government policies. CBO analyzed two possible policies: sumption would fall—and therefore, other things being one in which marginal tax rates were increased, and one equal, saving would rise—by 40 cents. Because that assumption is based on past outcomes, it serves as a useful in which government transfer payments (which were rule of thumb in situations that are within the range of assumed to go mainly to older people) were reduced. experience. However, when projected interest rates and the debt-to-GDP ratio rise to levels rarely seen before, CBO’s analysis suggested that delaying action for that rule of thumb may no longer be relevant. 10 years—and thus allowing the debt-to-GDP ratio to rise by an additional 30 percentage points under the CBO estimated that with that rule of thumb applied, real assumptions of the analysis—would result in output’s GDP per capita in 2027 under the alternative fiscal sce- being about 2 percent to 4 percent lower in the long run nario would be about 17 percent lower than it would be than it would be if the ratio was stabilized earlier at lower under the stable economic conditions assumed for the levels, depending on the policy used to stabilize the debt. long-term budget projections (see Figure 1-5).18 That (Despite those reductions, output would continue to be reduction would occur because of the crowding out of higher than current levels because of productivity investment. Incorporating the lower output and higher growth.) Most of the reduction in output would stem interest rates implied by crowding out would accelerate from two factors: the crowding out of investment in pro- the projected growth of debt as a percentage of GDP ductive capital, which would cause the capital stock to be under that scenario. Even with crowding-out effects taken 6 percent to 10 percent smaller if action was delayed, into account, however, GDP per capita would be consid- erably higher in 2027 than it is now because of continued 19. The economic model used for this comparison is capable of esti- growth in productivity. mating outcomes only under sustainable government policies. Therefore, the analysis had to involve stabilizing the debt-to-GDP 18. Results could not be estimated beyond 2027 under the alternative ratio at some point rather than allowing it to increase indefinitely. fiscal scenario because the implications of the simple crowding- For more details of the analysis, see Congressional Budget Office, out assumption used in this analysis are not realistic under the Economic Impacts of Waiting to Resolve the Long-Term Budget debt levels that occur in later years. Imbalance (forthcoming). CBO
  • 34.
    20 THE LONG-TERM BUDGET OUTLOOK Figure 1-5. Real GDP per Capita Under Stable Economic Conditions or with Crowding-Out Effects (2010 dollars) 70,000 Stable Economic Conditions 60,000 Extended-Baseline Scenario with Crowding-Out Effects 50,000 Alternative Fiscal Scenario a with Crowding-Out Effects 40,000 0 2010 2015 2020 2025 2030 2035 Source: Congressional Budget Office. Notes: “Crowding out” refers to the fact that government borrowing (to finance deficits) tends to crowd out private investment in productive capital, leading to a smaller capital stock and lower output in the long run than would otherwise occur. The stable economic conditions that CBO used in making its long-term budget projections under both scenarios included assumptions—after 2020—of a constant real (inflation-adjusted) interest rate on federal debt and steady growth rates for real wages and output. The extended-baseline scenario adheres closely to current law, following CBO’s 10-year baseline budget projections through 2020 (with adjustments for the recently enacted health care legislation) and then extending the baseline concept for the rest of the long- term projection period. The alternative fiscal scenario incorporates several changes to current law that are widely expected to occur or that would modify some provisions that might be difficult to sustain for a long period. (For details, see Table 1-1 on page 3.) GDP = gross domestic product. a. Results could not be estimated beyond 2027 for the alternative fiscal scenario with crowding-out effects because the simple crowding-out assumption used in this analysis does not yield realistic results in later years under that scenario. and the effects of higher marginal tax rates on incentives all future generations by amounts equivalent to a cut of to work and save (in the case of the policy involving roughly 1 percent to 2 percent of their lifetime consump- higher taxes). tion, again depending on the specific policies adopted. Another conclusion of CBO’s analysis was that genera- Other Consequences of Rising Federal Debt tions born after about 2015 would be worse off if action Besides the outcomes described above, which would to stabilize the debt-to-GDP ratio was delayed from 2015 unfold incrementally over time, higher debt could raise to 2025. People born before 1990, however, would be the probability of a fiscal crisis in which investors would better off if action was delayed, largely because they lose confidence in the government’s willingness to fully would partly or wholly avoid the policy changes needed honor its obligations, and thus, the government would be to stabilize the debt (leaving aside the negative effects of a forced to pay much more for debt financing.20 Interest possible fiscal crisis or of reduced flexibility for the gov- rates might rise only gradually to reflect growing uncer- ernment to respond to economic challenges, as described tainty about whether government debt would be fully below). Finally, generations born between 1990 and 2015 honored, but other countries’ experiences suggest that a could either gain or lose from a delay depending on the loss of investor confidence could occur abruptly instead. details of the policy used to stabilize the debt (again leaving aside some other effects of growing debt). In the 20. See Congressional Budget Office, Federal Debt and the Risk of a long run, a 10-year delay would reduce the well-being of Fiscal Crisis (forthcoming). CBO
  • 35.
    CHAPTER ONE THE LONG-TERM BUDGET OUTLOOK 21 Figure 1-6. Federal Debt Held by the Public With and Without Crowding-Out Effects (Percentage of gross domestic product) 200 180 Alternative Fiscal Scenario Alternative 160 with Crowding-Out Effectsa Fiscal Scenario 140 120 Extended-Baseline Scenario 100 with Crowding-Out Effects 80 Extended-Baseline Scenario 60 0 2010 2015 2020 2025 2030 2035 Source: Congressional Budget Office. Notes: “Crowding out” refers to the fact that government borrowing (to finance deficits) tends to crowd out private investment in productive capital, leading to a smaller capital stock and lower output in the long run than would otherwise occur. The stable economic conditions that CBO used in making its long-term budget projections under both scenarios included assumptions—after 2020—of a constant real (inflation-adjusted) interest rate on federal debt and steady growth rates for real wages and output. The extended-baseline scenario adheres closely to current law, following CBO’s 10-year baseline budget projections through 2020 (with adjustments for the recently enacted health care legislation) and then extending the baseline concept for the rest of the long- term projection period. The alternative fiscal scenario incorporates several changes to current law that are widely expected to occur or that would modify some provisions that might be difficult to sustain for a long period. (For details, see Table 1-1 on page 3.) a. Results could not be estimated beyond 2027 for the alternative fiscal scenario with crowding-out effects because the simple crowding-out assumption used in this analysis does not yield realistic results in later years under that scenario. If interest rates on government debt spiked, the value of to fund its other commitments. Greater debt in the outstanding government debt would fall sharply. That future would increase the risk that investors would be decline in value could precipitate a broader financial crisis unwilling to finance all of the outlays or revenue reduc- by causing large losses for mutual funds, pension funds, tions needed to deal with unforeseen events unless they insurance companies, banks, and other holders of federal were compensated with very high interest rates. Instead, debt. Experience in other countries suggests that resolv- to reassure investors concerned about a widening deficit ing such a crisis would require fiscal policy changes that during a recession, policymakers might be forced to raise would be far more drastic and painful than if policies had taxes or reduce spending suddenly, probably exacerbating been adjusted sooner to avoid a crisis. already weak economic conditions. Higher debt would also reduce policymakers’ ability to Even in the absence of a crisis, the longer that debt kept respond to unexpected challenges, such as economic downturns or international crises. Lower amounts of growing, the more significant would be the policy debt, by contrast, give the government the ability to bor- changes needed to control it, which could further row to meet sudden needs. If federal debt had been larger increase the burden of fiscal tightening on future genera- in 2008 than it was, the government might have had less tions. Large and abrupt changes in fiscal policy, such as flexibility to respond to the financial turmoil and slump- cuts in government transfer payments, would be more ing economy by using money to stimulate economic difficult for people to adjust to than smaller and more activity and stabilize the financial sector while continuing gradual changes. In addition, larger increases in tax rates CBO
  • 36.
    22 THE LONG-TERM BUDGET OUTLOOK would lead to greater losses in economic efficiency by insurance plans, thus resulting in a larger share of com- reducing incentives for work and saving. pensation taking the form of taxable wages. Combining all of the direct and indirect effects, CBO projects that the new excise tax will increase revenues as a share of Changes in CBO’s Long-Term GDP by just over half a percentage point in 2035 and Projections Since June 2009 by more than 3 percentage points in 2080. The long-term paths for primary spending presented in this report are similar to the ones that CBO published Federal debt is slightly higher in the next few decades last year, but the paths for revenues differ.21 In the under the extended-baseline scenario than was projected extended-baseline scenario, the recent enactment of in 2009 (see the bottom panel of Figure 1-7). In later major health care legislation has increased projected reve- decades, however, debt is substantially lower because of nues, particularly in the 2030s and beyond, thus slowing the higher projected growth in revenues. In the 2009 pro- the accumulation of debt considerably. In the alternative jection, revenues grew more slowly than outlays, and debt fiscal scenario, the health care legislation and changes in rose rapidly after 2030, reaching 200 percent of GDP in CBO’s assumptions have pushed up projected revenues in 2067. In the current projection, revenues and outlays the next few decades but lowered them thereafter. As in follow similar paths throughout the long-term projection last year’s projection for that scenario, debt accumulates period. As a result, debt grows much less—from its cur- very rapidly. rent level of about 60 percent of GDP to 75 percent by 2032 and exceeding 100 percent by 2080. Changes in Projections Under the Extended-Baseline Scenario Changes in Projections Under the Compared with the previous long-term outlook, CBO’s Alternative Fiscal Scenario current projections for primary spending under the The differences between CBO’s current and previous pro- extended-baseline scenario are slightly higher before 2020 jections of primary spending under the alternative fiscal and are a little lower after 2030 (see the top panel of scenario are very small. On average, outlays are 0.1 per- Figure 1-7). The longer-run difference arises almost cent of GDP lower over the projection period (see the entirely because CBO has reduced its projection of top panel of Figure 1-8), mostly because of changes in spending on major mandatory health care programs for projected health care spending. later years of the projection period. That reduction reflects two factors: technical changes in the projected The revisions to revenues are slightly more complicated. growth rate of health care costs and a slightly lower pro- CBO’s 2009 projection was based on the assumption that jected level of health care spending in 2030 because of the receipts from income taxes would consistently grow faster recent legislation (see Chapter 2). than GDP, causing total projected revenues to gradually increase from 18 percent of GDP in 2012 to 19 percent The largest change in the extended-baseline scenario in 2035 and 22 percent in 2080. In the current projec- since last year is a significant increase in projected reve- tion, revenues are estimated to rise at a faster rate over the nues as a percentage of GDP, especially in the 2030s and next decade, primarily because of the economic recovery later years. Whereas previously CBO projected that total and the additional taxes imposed by the health care legis- revenues would reach 22 percent of GDP in 2035 and lation. However, tax policy is assumed to adjust after 26 percent in 2080, the current extended-baseline sce- 2020 so revenues remain at their projected 2020 level nario has revenues growing to 23 percent of GDP in (just over 19 percent of GDP) for the rest of the long- 2035 and 30 percent in 2080 (an increase of 4 percentage term projection period. Consequently, revenues are points for that year). Most of the change in revenues projected to be higher for years before 2035 and lower stems from the new excise tax on high-premium health afterward. insurance plans that is scheduled to take effect in 2018. That tax will not only generate additional revenues Taking those changes together, the striking increase in directly when it is paid but also increase revenues if debt that was projected under the alternative fiscal sce- people opt to avoid it by selecting lower-cost health nario in last year’s report is apparent this year as well (see the bottom panel of Figure 1-8). Federal debt is projected 21. See Congressional Budget Office, The Long-Term Budget Outlook to reach 100 percent of GDP in 2023 and then continue (June 2009). to grow at an unsustainable pace. CBO
  • 37.
    CHAPTER ONE THE LONG-TERM BUDGET OUTLOOK 23 Figure 1-7. Comparison of CBO’s 2009 and 2010 Budget Projections Under the Extended-Baseline Scenario (Percentage of gross domestic product) Revenues and Primary Spending 30 25 20 Spending Revenues 2009 Projection 2009 Projection 2010 Projection 2010 Projection 15 10 0 2010 2015 2020 2025 2030 2035 Federal Debt Held by the Public 200 175 150 125 100 75 2010 Projection 50 2009 Projection 25 0 2010 2015 2020 2025 2030 2035 Source: Congressional Budget Office. Notes: Primary spending refers to all spending other than interest payments on federal debt. The extended-baseline scenario adheres closely to current law, following CBO’s 10-year baseline budget projections through 2020 (with adjustments for the recently enacted health care legislation) and then extending the baseline concept for the rest of the long- term projection period. (For details, see Table 1-1 on page 3.) CBO
  • 38.
    24 THE LONG-TERM BUDGET OUTLOOK Figure 1-8. Comparison of CBO’s 2009 and 2010 Budget Projections Under the Alternative Fiscal Scenario (Percentage of gross domestic product) Revenues and Primary Spending 30 25 20 Spending Revenues 15 2009 Projection 2009 Projection 2010 Projection 2010 Projection 10 0 2010 2015 2020 2025 2030 2035 Federal Debt Held by the Public 200 175 150 125 2010 Projection 100 75 50 2009 Projection 25 0 2010 2015 2020 2025 2030 2035 Source: Congressional Budget Office. Notes: Primary spending refers to all spending other than interest payments on federal debt. The alternative fiscal scenario incorporates several changes to current law that are widely expected to occur or that would modify some provisions that might be difficult to sustain for a long period. (For details, see Table 1-1 on page 3.) CBO
  • 39.
    CHAPTER 2 The Long-Term Outlook for Mandatory Spending on Health Care S pending for health care in the United States has been growing faster than the economy for many years, and the increasing pressure of premiums and cost-sharing requirements on enrollees’ finances. posing a challenge not only for the federal government’s two major health insurance programs, Medicare and Even assuming that such changes occur, the Congressio- Medicaid, but also for state and local governments and nal Budget Office anticipates that federal spending on the private sector. Measured as a percentage of the the government’s major mandatory health care programs nation’s gross domestic product, total spending on health will continue to rise relative to GDP. CBO has projected care services and supplies increased from 5 percent in spending for those programs—Medicare, Medicaid, the 1960 to 10 percent in 1985 and 15 percent in 2008, the Children’s Health Insurance Program, and the insurance most recent calendar year for which data are available. subsidies that will be provided through exchanges estab- Federal spending for Medicare and Medicaid rose from lished by the recently enacted health care legislation, 2.2 percent of GDP in fiscal year 1985 to 5.3 percent in described below—under two scenarios.1 Under the 2009. Underlying those trends, health care spending per extended-baseline scenario, which reflects current law, person has grown faster than the nation’s economic out- federal spending for those programs would grow from put per person by an average of about 2 percentage points 5.5 percent of GDP today to about 10 percent of GDP in per year over long periods. Key factors contributing to 2035; about 6 percent of GDP would be devoted to that faster growth are the emergence and increased use of Medicare, and about 4 percent would be spent on Medic- new medical technologies, rising personal income, and aid, CHIP, and the exchange subsidies. For the alternative the expanding scope of health insurance coverage. fiscal scenario, CBO assumes that several policies Such rates of growth cannot continue indefinitely, how- designed to restrain federal spending on health care ever, because if they did, total spending on health care would not be continued. As a result, mandatory federal would eventually account for all of the country’s eco- spending on health care programs would grow faster, nomic output—an implausible outcome. Instead, over reaching about 11 percent of GDP by 2035. Medicare time, people will try to limit their spending for health spending would grow to about 7 percent of GDP, and care in order to maintain their consumption of other federal spending on Medicaid, CHIP, and the exchange goods and services. In addition, state governments— subsidies would reach about 4 percent of GDP. Beyond which pay a large share of Medicaid’s costs and have con- 2035, federal health care spending would continue to siderable influence on those costs—will need to reduce climb relative to GDP under both scenarios. spending growth in order to balance their budgets. Thus, even in the absence of changes in federal law, growth in 1. In this report, federal discretionary spending on health care—that spending on Medicaid and on health care in the private is, spending that is subject to annual appropriations—is included sector will gradually slow. The rate of growth of spending in the budget projections for other noninterest spending (see Table 1-2 in Chapter 1). Some mandatory spending on health on Medicare is also expected to slow, but to a lesser care (for example, spending for federal retirees) is also included in extent, reflecting changes in medical practices common other noninterest spending; that mandatory spending represents a to all patients, regulatory changes allowed under the law, very small share of the federal budget. CBO
  • 40.
    26 THE LONG-TERM BUDGET OUTLOOK Quantifying the extent to which the rate of growth of modified to reflect different policies under the alternative health care spending will decline under current law is dif- fiscal scenario). Looking beyond the next two decades, ficult. The growth of such spending relative to the growth determining the impact of the legislation on federal of the economy has varied greatly from year to year dur- health care spending is very difficult because the uncer- ing the past several decades, so projections of the likely tainties involved are so great. Moreover, disentangling the difference in growth rates during the next few decades are effects of the legislation from steps that would have been very uncertain. As the projection period lengthens, the taken under prior law to slow the growth of health care uncertainties mount because the likelihood of significant spending becomes increasingly challenging. Conse- changes in medical practice and technology increases. As quently, CBO’s approach in formulating the longer-term a result, CBO’s projections of health care spending for projections in this report has been to incorporate the the next few decades probably provide more real informa- projected effects of the legislation on the level of federal tion than its projections for the longer term. spending for health care over the next one or two decades (depending on the scenario) and to extrapolate such A new consideration in this year’s Long-Term Budget Out- spending (including the incremental effects of the legisla- look is the recent enactment of the Patient Protection and tion) using the same growth rates that would have been Affordable Care Act, or PPACA (Public Law 111-148), applied in the absence of the legislation. The use of that and the Health Care and Education Reconciliation Act of mechanical approach reflects CBO’s judgment that the 2010 (P.L. 111-152). That legislation has significant and agency does not have an analytic basis for projecting the conflicting implications for federal spending. On the one effects of the recently enacted legislation on the growth hand, it will substantially expand eligibility for Medicaid rate of federal health care spending over the very long (mostly at federal expense) and provide subsidies through term.3 the new insurance exchanges. On the other hand, the legislation will significantly decrease Medicare outlays, The projections presented in this report differ from those largely by reducing payment rates for many types of in last year’s Long-Term Budget Outlook because of both health care providers relative to the rates that would have technical changes in CBO’s methodology and the impact been paid under prior law, but also by making other of the health care legislation. In last year’s report, specific changes in the program and establishing a CBO projected that mandatory federal spending on mechanism designed to control the growth in Medicare’s health care would total between 10 percent and 11 per- costs per enrollee. (The legislation made numerous other cent of GDP in 2035 under the extended-baseline sce- changes as well, but their impact on federal spending for nario, slightly higher than the agency’s current projec- health care is generally more modest.) The legislation will tion.4 Under the alternative fiscal scenario, last year’s also increase federal revenues significantly (as discussed in projection for mandatory spending on health care was Chapter 4); one noteworthy provision is a tax that will be about 11 percent of GDP in 2035—essentially the same imposed, starting in 2018, on employment-based health as the current projection. insurance plans with relatively high premiums, which will encourage enrollees in those plans to shift to less expen- 3. For further discussion of the challenges of projecting the long- sive and less extensive coverage. term effects of legislation on federal health care spending, see Congressional Budget Office, letter to the Honorable Max Baucus CBO and the staff of the Joint Committee on Taxation about different measures for analyzing proposals to reform health (JCT) have estimated the budgetary effects of that legisla- care (October 30, 2009). tion in detail for the next 10 years and in a much less 4. One factor complicating the comparison is that this year’s report precise way for the following 10 years.2 The projections presents figures for gross spending for Medicare, whereas last year’s report focused on net Medicare spending—that is, gross spending reported here incorporate that original estimate (except as minus certain offsetting receipts (primarily the premiums paid by enrollees). Here, those offsetting receipts (which are projected to 2. See Congressional Budget Office, letter to the Honorable Nancy total about 1 percent of GDP in 2035) have been excluded from Pelosi about the budgetary effects of H.R. 4872, the Reconcilia- the spending total reported last year for purposes of comparing tion Act of 2010 (March 20, 2010). the two projections. CBO
  • 41.
    CHAPTER TWO THE LONG-TERM BUDGET OUTLOOK 27 Figure 2-1. have private health insurance. CBO estimates that about 150 million nonelderly people currently have an Distribution of Spending for employment-based health plan as their primary source Health Services and Supplies, 2008 of coverage, and about 13 million people have primary insurance coverage purchased directly from an insurer. At any given time during this year, in CBO’s estimation, Other Public about 50 million people will be uninsured. Spending (10%) In 2008, the most recent calendar year for which data are available, total spending for health care services and sup- plies amounted to about $2.2 trillion, or 15.1 percent of Medicaid and CHIP the nation’s GDP.6 In that year, 52 percent of spending (16%) Private Health Insurance (36%) was financed privately; the rest of the spending came from public sources (see Figure 2-1): B Payments by private health insurers were the largest component of private spending, making up 36 percent Medicare (22%) of total expenditures on health care. Consumers’ out- Consumers' Out-of-Pocket of-pocket expenses, which include payments made to Expenditures satisfy deductibles and copayments for services cov- (13%) ered by insurance, as well as payments for services not covered by insurance, accounted for 13 percent of those expenditures.7 Other sources of private funds, Other Private such as philanthropy, accounted for 4 percent of total Spending (4%) health care spending. Source: Congressional Budget Office based on data from the B Federal spending for Medicare made up 22 percent of Centers for Medicare and Medicaid Services. total expenditures on health care in 2008, and federal Note: CHIP = Children’s Health Insurance Program. and state spending for Medicaid and CHIP accounted for 16 percent. Another 10 percent was accounted for by various other public programs, including those run Overview of Current Financing for by state and local governments’ health departments, Health Care the Department of Veterans Affairs, the Department Although the recent health care legislation made a num- of Defense, and workers’ compensation programs. ber of significant changes to Medicare, Medicaid, and the financing of private health insurance—and is projected to 5. Some people have coverage from more than one source at a time. substantially reduce the number of people who are Currently, about 7.5 million people with Medicaid coverage are uninsured—reviewing the current status of the health also covered by Medicare, which is their primary source of insurance system is useful because it provides a starting coverage. All of the estimates reflect average monthly enrollments during the year. point for CBO’s projections. 6. This report defines “total health care spending” as spending for Today, a combination of private and public sources health care services and supplies as defined in the national health finances the provision of health care in the United States. expenditure accounts maintained by the Centers for Medicare and Medicaid Services. That concept excludes spending on medical About 46 million people are covered by Medicare, and research, structures, and equipment. Under a broader definition 58 million are covered by Medicaid, the two main sources that includes those categories, total national health expenditures of public financing.5 Medicare provides near-universal in 2008 were 16.2 percent of GDP. coverage for the elderly and also covers several million 7. In this analysis, out-of-pocket payments do not include the premi- nonelderly people; Medicaid covers a variety of low- ums that people pay for health insurance (because premiums fund income individuals, most of whom are nonelderly. The the payments that insurers provide, which are already included in majority of Americans under the age of 65, however, the measure of private spending). CBO
  • 42.
    28 THE LONG-TERM BUDGET OUTLOOK Medicare health care costs for which beneficiaries are responsible. In 2010, Medicare will provide federal health insurance However, the vast majority of beneficiaries who receive for 46 million people who are elderly or disabled (the care in the fee-for-service portion of Medicare have elderly make up nearly 85 percent of enrollees) or who supplemental insurance that covers many or all of the have end-stage renal disease or amyotrophic lateral sclero- program’s cost-sharing requirements. According to one sis (also known as Lou Gehrig’s disease). People become recent study, the most common sources of supplemental eligible for Medicare on the basis of age when they reach coverage in 2006 were plans for retirees offered by former 65; disabled individuals become eligible for the program employers (held by 39 percent of beneficiaries in the 24 months after they qualify for benefits under Social fee-for-service part of Medicare), individually purchased Security’s Disability Insurance program. medigap policies (32 percent of beneficiaries), and Medicaid (16 percent).9 Part A of Medicare, or Hospital Insurance, primarily covers inpatient services provided by hospitals as well as Medicaid and CHIP skilled nursing and hospice care. Part B, or Supplemen- Medicaid is a joint federal/state program that pays for tary Medical Insurance, mainly covers services provided health care services for a variety of low-income individu- by physicians and other practitioners and by hospitals’ outpatient departments. Most enrollees in Medicare are als. In 2009, federal spending for Medicaid was $251 bil- in the traditional fee-for-service program, in which the lion, of which $228 billion covered benefits for enrollees. federal government pays for covered services directly, but (In addition to benefits, Medicaid’s spending included enrollees can instead obtain coverage for Medicare’s bene- payments to hospitals that treat a “disproportionate fits through a private health insurance plan under Part C share” of low-income patients, costs for the Vaccines for of Medicare (called Medicare Advantage). A voluntary Children program, and administrative expenses.) The prescription drug benefit became available in 2006 as federal government’s share of Medicaid’s spending for Part D of Medicare. In 2009, gross spending for Medi- benefits varies among the states. That share usually aver- care was $499 billion. ages 57 percent, but legislation temporarily boosted it in response to the economic downturn; in 2009, the federal The various parts of the program are financed in different share averaged two-thirds. According to the Centers for ways. Part A benefits are financed primarily by a payroll Medicare and Medicaid Services, states spent $130 bil- tax (currently 2.9 percent of taxable earnings), the reve- lion on Medicaid in 2009. nues from which are credited to the Hospital Insurance (HI) Trust Fund. For Part B, premiums paid by beneficia- States administer their Medicaid programs under federal ries cover about one-quarter of outlays, and the govern- guidelines that specify a minimum set of services that ment’s general funds cover the rest. (Payments to private must be provided to certain categories of low-income insurance plans under Part C are financed by a blend of individuals. Required services include inpatient and out- funds from Parts A and B.) Enrollees’ premiums under patient hospital services, services provided by physicians Part D are set to cover about one-quarter of the cost of and laboratories, and nursing home and home health the basic prescription drug benefit, although many low- care. To be eligible for Medicaid, a person must have a income enrollees receive larger subsidies; general funds low income and (in certain cases) only a few assets— cover most of the remaining cost. Taking all of the parts although the minimum financial thresholds vary, depend- of Medicare together, in calendar year 2008, about 42 percent of gross federal spending was financed by ing on the basis for an enrollee’s eligibility. Groups that the payroll tax, about 12 percent by beneficiaries’ premi- must be eligible include low-income children and families ums, and about 40 percent by general funds of the who would have qualified for the former Aid to Families government.8 with Dependent Children program, certain other low- income children and pregnant women, and most elderly Cost-sharing requirements in Medicare vary widely, and and disabled individuals who qualify for the Supplemen- the program does not set an annual cap on the amount of tal Security Income program. 8. Various other sources, including a portion of the federal income 9. Estimates are based on information in Medicare Payment taxes that people pay on their Social Security benefits, provide the Advisory Commission, A Data Book: Healthcare Spending and remainder of the funding for Medicare. the Medicare Program (June 2009), p. 61. CBO
  • 43.
    CHAPTER TWO THE LONG-TERM BUDGET OUTLOOK 29 Within those requirements and other statutory limits, grant program with a fixed nationwide cap on federal states have flexibility in administering the Medicaid pro- spending. In 2009, federal spending on CHIP was gram and determining its scope. Partly as a result, the $7.5 billion, and about 8 million people (mostly chil- program’s rules are complex, and it is difficult to general- dren) were enrolled in the program at some point during ize about the types of enrollees covered, the benefits the year. The federal share of CHIP spending varies offered, and the cost sharing required. States may choose among the states but usually averages 70 percent. to make additional groups of people eligible (such as individuals with income above the mandatory eligibility thresholds and those who have high medical expenses The Historical Growth of Health relative to their income) or to provide additional benefits Care Spending (such as coverage for prescription drugs and dental ser- Total spending for health care in the United States—that vices), and they have exercised those options to varying is, private and public spending combined—has risen sig- degrees. Moreover, many states seek and receive federal nificantly as a share of GDP over the past several decades. waivers that allow them to provide benefits and cover Such spending has grown relative to GDP in most years, groups that would otherwise be excluded. By one esti- with the notable exception of the period from 1993 to mate, federal and state expenditures on optional popula- 2000, when spending for health care remained relatively tions and benefits accounted for about 60 percent of the stable as a share of the economy. Many analysts have Medicaid program’s total spending in 2001.10 attributed that lull in growth to a substantial rise in the number of people enrolled in managed care plans as well About 71 million people will be enrolled in Medicaid as to excess capacity among some types of providers, at some point during 2010, CBO estimates; the average which increased the leverage that health plans had in enrollment over the course of the year will be about negotiating payments. Economic growth was also 58 million. Those two ways of measuring enrollment relatively rapid in that period. yield such divergent estimates because many people are eligible for Medicaid for only part of the year. About half Spending for Medicare and Medicaid has also grown of Medicaid’s enrollees are low-income children, and quickly in recent decades, in part because of rising enroll- another one-quarter are either the parents of those chil- ment and in part because of rising costs per enrollee. dren or low-income pregnant women. The elderly and Between 1975 and 2009, gross federal spending for disabled constitute the remaining one-quarter of Medic- Medicare rose from 0.9 percent of GDP to 3.5 percent, aid’s enrollees. Expenses tend to be higher for elderly and and federal spending for Medicaid increased from 0.4 disabled beneficiaries, many of whom require long-term percent of GDP to 1.8 percent. Over that same period, care, than for other beneficiaries. About one-third of total spending for Medicaid (including spending by the Medicaid’s spending is for long-term care, which includes states) increased from 0.8 percent of GDP to 2.7 percent. nursing home services, home health care, and other medical and social services for people whose disabilities Underlying Factors prevent them from living independently. Overall, the A crucial factor underlying the rise in per capita spending elderly and disabled account for about two-thirds of the for health care in recent decades has been the emergence, program’s spending. adoption, and widespread diffusion of new medical tech- nologies and services.12 Major advances in medical sci- CHIP is a joint federal/state program that provides health ence allow providers to diagnose and treat illnesses in insurance coverage for uninsured children living in fami- ways that previously were impossible. Many of those lies with income that is relatively low but too high for innovations rely on costly new drugs, equipment, and them to qualify for Medicaid.11 Like Medicaid, CHIP is skills. Other innovations are relatively inexpensive, administered by the states within broad federal guide- but their costs add up quickly as growing numbers of lines. Unlike Medicaid, however, CHIP is a matching 11. Under certain conditions, parents of enrolled children are also eligible for CHIP, but they constitute a very small percentage of 10. See Kaiser Commission on Medicaid and the Uninsured, the program’s enrollment. Medicaid Enrollment and Spending by “Mandatory” and “Optional” Eligibility and Benefit Categories (Washington, D.C.: 12. See Congressional Budget Office, Technological Change and the Henry J. Kaiser Family Foundation, June 2005), p. 11. Growth of Health Care Spending (January 2008). CBO
  • 44.
    30 THE LONG-TERM BUDGET OUTLOOK providers and patients make use of them. Although tech- Studies that have analyzed the sources of past spending nological advances can sometimes reduce costs, in medi- growth have consistently found that the aging of the pop- cine such advances and the resulting changes in clinical ulation has had only a small effect. Although older adults practice have generally increased spending. generally have higher average medical expenses than younger adults, the age composition of the population Other factors that have contributed to the growth of per has not changed sufficiently to account for much of the capita health care spending include increases in personal increase in per capita spending. Aging has had a larger income and the expanded scope of health insurance effect on federal spending for health care, however, coverage. Demand for medical care tends to rise as real because nearly all U.S. residents become eligible for (inflation-adjusted) family income increases. Moreover, Medicare when they turn 65. Over the past four decades, the expanding scope of insurance coverage in recent the share of the population that was age 65 or older grew decades, as evidenced by the substantial reduction in the by about one-quarter—from 10 percent to 13 percent. percentage of health care costs that people pay out of pocket, has also increased demand, because insurance Excess Cost Growth coverage reduces the cost of medical care for consumers. When analyzing historical trends in the growth of health (The share of the population with health insurance has care spending and developing projections for future declined slightly in recent decades.) Spending on health growth of that spending, it is useful to distinguish care would also be expected to grow if people were devel- between various components of that growth. As part of oping more health problems or were becoming more that analysis, it is common to calculate the increase in likely to contract diseases, but the evidence on whether health care spending per person relative to the growth of those factors have substantially increased the use of health GDP per person after removing the effects of demo- care in the past few decades is mixed.13 graphic changes on health care spending—in particular, changes in the population’s age distribution. The remain- Disentangling the effects of technology, income, and ing difference in growth rates is generally referred to as insurance on the growth of health care spending is diffi- “excess cost growth.” The phrase is not intended to imply cult because the growth of income and insurance cover- that growth in per capita spending for health care is nec- age has increased the demand for new technologies. A essarily excessive or undesirable; it simply measures the recent study estimated that new medical technologies and extent to which the growth in such spending (adjusting rising income were the most important factors explaining for changes in the age composition of the population) the growth in health care spending since 1960, with the exceeds the growth in per capita GDP.16 two accounting for similar shares of that growth.14 But the study also noted that the effect of the expansion in 15. Amy Finkelstein, “The Aggregate Effects of Health Insurance: insurance coverage on spending growth is highly uncer- Evidence from the Introduction of Medicare,” Quarterly Journal tain. Another recent study concluded that the expansion of Economics, vol. 122, no. 1 (February 2007), pp. 1–37. One of insurance coverage resulting from the introduction of factor that may have contributed to that study’s findings was Medicare had a substantial impact on national health care the relatively generous payment system that Medicare adopted. Following the common practice of private insurers at the time, spending—raising costs not just for the elderly patients Medicare initially paid hospitals on the basis of their incurred who gained coverage but for nonelderly patients as well. costs—an approach that gave hospitals little incentive to control It attributed part of the impact to more rapid and wide- those costs. The increase in hospital spending that resulted from spread adoption of existing treatment methods (such as Medicare’s creation might have been smaller under a less generous those provided by cardiac intensive care units), but ques- payment system. tions remain about the magnitude of those effects.15 16. For Medicare, CBO also adjusts for changes in the projected life expectancy (time until death) of beneficiaries. For Medicaid, CBO adjusts for changes in the program’s case mix—that is, the por- 13. For additional discussion, see Congressional Budget Office, Key tions of beneficiaries who are children, disabled people, elderly Issues in Analyzing Major Health Insurance Proposals (December people, and other adults—rather than for changes in age composi- 2008), p. 23. tion. The introduction of Medicare’s Part D drug benefit in 2006 14. Sheila Smith, Joseph P. Newhouse, and Mark S. Freeland, resulted in a one-time shift in some spending from Medicaid to “Income, Insurance, and Technology: Why Does Health Medicare; to adjust for that shift, CBO assumed that excess cost Spending Outpace Economic Growth?” Health Affairs, vol. 28, growth in 2006 for both Medicare and Medicaid was equal to the no. 5 (September/October 2009), pp. 1276–1284. average of excess cost growth in the two programs for that year. CBO
  • 45.
    CHAPTER TWO THE LONG-TERM BUDGET OUTLOOK 31 Table 2-1. from its most recent baseline budget projections, which reflect a detailed analysis of each program and its compo- Excess Cost Growth in Spending for nents. (Throughout this analysis, spending on CHIP, Health Care which accounts for less than 0.1 percent of GDP, is com- (Percentage points) bined with spending on Medicaid.) For the years beyond that 10-year span, CBO uses the projected amounts of Medicare Medicaid All Other Total spending in the last year of the baseline (2020) and 1975 to 2008 2.5 2.0 1.8 1.9 applies growth rates that reflect CBO’s projections of income growth, general inflation, and demographic 1980 to 2008 2.2 1.7 1.9 1.9 changes, as well as rates of excess cost growth that initially reflect historical growth rates but that are assumed to 1985 to 2008 1.5 1.2 1.8 1.7 slow over time.17 Thus, two of the key parameters that affect the projections of mandatory federal spending on 1990 to 2008 1.8 1.0 1.4 1.4 health care are the initial rates of excess cost growth and Source: Congressional Budget Office. the path by which those rates diminish. Note: Excess cost growth refers to the extent to which the growth rate of Medicare or Medicaid spending per beneficiary—or Initial Rates of Excess Cost Growth all other health care spending per capita—exceeded the Given the uncertainty surrounding future trends in cost growth rate of nominal gross domestic product per capita growth for health care, a reasonable starting point is the per year, on average. historical rate of excess cost growth. Use of that starting point is consistent with the assumption that the future The resulting calculations indicate that rates of excess cost will look like the past, at least initially. Selecting which growth have ranged between 1.0 and 2.5 percentage historical period to use, however, presents a trade-off: points across programs and during various time periods Using a longer period avoids giving transient or cyclical between 1975 and 2008 (see Table 2-1). For all categories developments undue weight, but it also gives too little of health care spending, excess cost growth was greater, emphasis to more-recent trends that turn out to be on average, during the 1975–2008 period than during persistent. the 1990–2008 period. Average annual rates of excess cost growth for total health care spending during those The long-term projections in this report are based on the two periods were 1.9 percentage points and 1.4 percent- average rate of excess cost growth observed between 1985 age points, respectively. and 2008. Excess cost growth was lower, on average, dur- ing that period than during the longer 1975–2008 CBO’s Projection Methodology period. That slowing probably stems, at least in part, This section reviews the approach that CBO follows in from two important shifts: Private health insurance projecting mandatory federal spending on health care moved away from indemnity policies—which generally over the long term and discusses some technical changes reimburse enrollees for their incurred medical costs, and in the application of that approach that have been made which predominated before the 1990s—and toward since last year’s report. The ways in which the effects of greater management of care; and Medicare shifted from the recently enacted health care legislation have been cost-based payment methods to fee schedules that seem incorporated into the projections are examined in a sub- less conducive to spending growth because price increases sequent section, after the key provisions of that legislation are constrained. Excess cost growth was even lower, on have been described more fully. In effect, the current sec- average, during the shorter 1990–2008 period, but that tion describes how CBO would have projected spending average gives a good deal of weight to the years in the for health care in the absence of that legislation—which 1990s when managed care was spreading most rapidly— serves as the starting point for incorporating the impact some of which probably represented a one-time down- of the legislation. ward shift in health care costs rather than a change in the For the first 10 years of the projection period, CBO uses 17. After 2020, spending on CHIP was held constant as a share of the estimates of spending for Medicare and Medicaid GDP. CBO
  • 46.
    32 THE LONG-TERM BUDGET OUTLOOK underlying growth rate. In CBO’s judgment, the average spending growth outside of Medicare will affect Medi- rate of excess cost growth since 1985 best reflects features care, which is integrated to a significant degree with the of the health care and health insurance systems that are rest of the health care system. In particular, Medicare will likely to endure. probably experience some reduction in cost growth to the extent that actions by individuals, businesses, and states CBO used the average rate of excess cost growth since result in lower-cost “patterns of practice” by physicians, 1985 for total health care spending—1.7 percentage slower development and diffusion of new technologies, points—as the initial rate for Medicare, Medicaid, and and cost-limiting changes to the structure of the overall all other national health care spending, rather than start- health care system. Moreover, the federal government will ing from those sectors’ differing historical rates. That probably make regulatory changes aimed at slowing the approach recognizes that past changes in federal law have growth of spending for Medicare (and Medicaid), and the affected the growth rates observed in Medicare and Med- demand for health care services by Medicare beneficiaries icaid to an extent that is difficult to disentangle from will be constrained as the program’s premiums and cost- other factors affecting those growth rates. It also reflects sharing amounts consume a growing share of beneficia- the considerable uncertainty about whether and how ries’ income. future growth rates will differ across the sectors. In the absence of changes in federal law, state govern- This approach to developing initial growth rates differs ments and the private sector have more flexibility to from that adopted in CBO’s June 2009 Long-Term Budget respond to the pressures of rising health care spending Outlook in two ways: The projections for last year’s report than does the federal government. Consequently, CBO were based on trends since 1975, and they used the dif- projects that excess cost growth in Medicaid’s spending fering historical growth rates for each of the three sectors and in other (non-Medicaid, non-Medicare) spending as those sectors’ starting points. would slow to a greater degree than would Medicare’s spending. Specifically, CBO assumed that the rate of Path of the Slowdown excess cost growth for both Medicaid and other health When health care expenditures increase as a share of care spending in 2084 (the last year of the current 75-year GDP, they absorb a rising share of people’s income, projection period) would be zero, whereas the rate of reducing growth in the consumption of other goods and excess cost growth for Medicare at the end of the period services. Thus, continued growth in health care spending would be 1.0 percentage point. Excess cost growth is pro- will create mounting pressure to slow the growth of costs, jected to decline linearly—that is, by the same fractional even in the absence of changes in federal law. number of percentage points each year—from its initial starting point of 1.7 percentage points. That approach The private sector and state governments will probably reflects a judgment that, over time, the steps needed to respond to rising costs for health care by instituting vari- keep reducing growth rates will become increasingly ous changes. Employers can intensify their efforts to onerous but that the pressure to take them will also reduce the costs of the insurance plans they sponsor—for intensify because of continued increases in health care example, by working with insurers to make the delivery spending. of health care more efficient or by reducing the extent of the insurance coverage they offer. To avoid higher premi- That approach to specifying the path of the slowdown in ums, employees can shift to plans with more tightly man- excess cost growth differs from the approach adopted in aged benefits or higher cost-sharing requirements. State last year’s report in two ways: The projected values of governments can respond to growing costs for Medicaid excess cost growth in the final year of the projection by limiting the services they choose to cover or by tight- period differ slightly, and last year’s report projected that ening eligibility to reduce the number of beneficiaries. the reductions in growth rates would occur relatively Because the federal government’s spending for Medicaid quickly in the initial years and more slowly in the later depends on what the states spend, actions by the states years.18 that reduce the growth of their Medicaid spending will also slow the growth of federal spending for the program. 18. In last year’s report, the rates of excess cost growth in the final year of the 75-year projection period were 0.1 percentage point for Many features of the Medicare program cannot be altered Medicaid and all other health care spending and 0.9 percentage without changes in federal law. Still, a slowdown in points for Medicare. CBO
  • 47.
    CHAPTER TWO THE LONG-TERM BUDGET OUTLOOK 33 Resulting Growth Rates been reduced. Even so, health care costs are projected to Under CBO’s approach, excess cost growth projected for continue to rise more rapidly than income, representing the 2021–2084 period averages about 0.8 percentage an increasing share of total output and of federal points for Medicaid and for other health care spending spending. and about 1.3 percentage points for Medicare. That is, in the absence of changes in federal law, Medicare’s costs per Summary of Initial Assessments enrollee are projected to grow—on average over a 65-year Without taking into account the impact of the recently period—about 0.5 percentage points faster than either enacted health care legislation, CBO’s long-term projec- per-enrollee costs in the Medicaid program or per capita tions of health care spending would be based on the fol- costs for other spending on health care. (Those calcula- lowing set of assessments: tions do not factor in any effects of the recent health care legislation, which are examined below.) In last year’s B Spending for Medicare and Medicaid from 2010 projections, that gap was larger. Specifically, the average through 2020 would equal the projections in CBO’s rates projected for excess cost growth over a similar period most recent baseline (which did not include the effects were 0.6 percentage points for Medicaid, 0.5 percentage of the recent legislation). points for other spending, and 1.5 percentage points for Medicare. B In 2021, excess cost growth in spending for Medicare, Medicaid, and all other health care spending would It might be difficult to envision how excess cost growth equal the overall average for historical growth since in Medicare’s spending could continually outstrip spend- 1985—that is, 1.7 percentage points. ing for Medicaid and other health care over such a long period. One way in which that might happen is that B Excess cost growth in all three categories—Medicare, actions taken to reduce spending growth in the private Medicaid, and other health care spending—would sector could weaken the incentives to develop and diffuse slow beginning in 2022. new medical technologies for nonelderly people but have less of an effect on new technologies focused on diseases B Excess cost growth for Medicare would decline lin- that principally affect the elderly. Indeed, excess cost early from 1.7 percentage points in 2021 to 1.0 per- growth in Medicare has exceeded that for other spending centage point in 2084, and excess cost growth for by as much as half a percentage point over periods of a Medicaid and for health care spending apart from few decades, even though past growth rates reflect Medicare and Medicaid would decline linearly from changes in law that have probably helped to slow 1.7 percentage points in 2021 to zero in 2084. growth in Medicare’s costs; noticeable differences in future growth rates over such periods would not be unprecedented. Recent Health Care Legislation Lawmakers enacted legislation in March 2010 that will Relative to a projection in which excess cost growth per- substantially change the nation’s health insurance system sists at historical rates, the sizable slowdown in excess cost and have significant implications for federal spending on growth that CBO projects probably can be achieved only health care. The Patient Protection and Affordable Care through significant changes in the nature of health care, Act, as amended by the Health Care and Education Rec- access to care, or the amount that households pay directly for care. For example, in the private sector, households onciliation Act of 2010, will require most legal residents will probably face increased cost sharing; new and poten- of the United States to obtain health insurance starting in tially useful health technologies will probably be intro- 2014; significantly expand eligibility for Medicaid; set up duced more slowly or be used less frequently than they insurance exchanges through which certain individuals would without a slowdown in excess cost growth; and and families will receive federal subsidies to greatly reduce more treatments and interventions may simply not be their cost of purchasing private coverage; substantially covered by insurance. In addition, households that would reduce the growth of Medicare’s payment rates for most otherwise receive health insurance through Medicaid may services (relative to the growth rates projected under prior be ineligible because of tightened eligibility rules or may law); impose an excise tax on insurance plans with rela- be eligible but find that the scope of covered services has tively high premiums; and make various other changes to CBO
  • 48.
    34 THE LONG-TERM BUDGET OUTLOOK the federal tax code, Medicare, Medicaid, and other outlays because their value will often exceed what enroll- programs. ees’ income tax liability would otherwise be.20 In addi- tion, the subsidies to reduce enrollees’ cost sharing will be Provisions That Will Increase Federal Spending classified as outlays. The expansion of Medicaid eligibility and the provision of subsidies through the new insurance exchanges will Provisions That Will Reduce Federal Spending both increase federal spending for health care. Starting The legislation contains a number of provisions that will in 2014, most nonelderly people with income below substantially reduce federal spending on Medicare relative 138 percent of the federal poverty level (FPL) will to what it would have been under prior law. The major become eligible for Medicaid.19 The people who will gain source of those savings is a set of provisions that perma- eligibility for Medicaid under the new law consist primar- nently reduce the annual updates to Medicare’s payment ily of nonelderly adults with low income who are not par- rates for many types of fee-for-service health care provid- ents of dependent children. (Low-income children and ers. Under prior law, those payment updates would have their parents already qualify for Medicaid under prior generally been equal to the estimated change in the aver- law, although the income thresholds vary by state.) The age cost of providers’ inputs (such as labor and equip- federal government will pay all of the costs of covering ment). Under the new law, however, those updates will be newly eligible enrollees through 2016. In subsequent adjusted downward by the estimated rate of economy- years, the federal share of that spending will decline wide growth in productivity—a measure that seeks to gradually to 90 percent in 2020, where it will remain. capture, for the economy as a whole, how much more output is being produced from a given level of inputs. (In Insurance exchanges will be established in 2014 through some cases, the law also specifies additional reductions in which certain people with income up to 400 percent of the update factors.) The other key source of savings, the FPL will be eligible for federal subsidies to reduce according to CBO’s projections, is a reduction in pay- their cost of obtaining private health insurance coverage. ments to private health insurance plans under Part C of Eligible people who purchase a relatively inexpensive plan Medicare. providing a specified level of benefits will receive a sub- sidy that limits their net premium to a certain percentage The legislation also includes various changes in Medi- of their income. In 2014, the percentages of income will care’s payment policies that many experts believe have the range from 2 percent for the lowest-income households potential to reduce federal spending on health care with- to 9.5 percent for households with income between out harming patients’ health—but that CBO expects will 300 percent and 400 percent of the FPL (those percent- probably require much experimentation and refinement ages will be indexed in future years, as described below). before significant savings will be achieved. Therefore, People with income below 250 percent of the FPL will CBO projected limited savings during the next two also be eligible to receive subsidies to reduce their cost- decades from provisions allowing physicians to establish sharing requirements. People will not be eligible to “accountable care organizations,” establishing a national receive subsidies through the exchanges if they already pilot program to develop approaches to bundling the qualify for public coverage—including Medicaid—or if payments for an “episode” of care during and after hospi- they are offered coverage through their employment, talization, and making related changes to other payment unless they would have to pay more than a specified share policies.21 The legislation further establishes a Center for of their income for such coverage. Medicare and Medicaid Innovation and gives the Secre- Although the premium subsidies are structured as tax 20. To the extent that receiving a tax credit reduces what a person credits, most of the funds involved will be classified as owes in taxes, the credit results in a reduction in revenues. Because the tax credits are refundable, however, people can receive a credit that exceeds their income tax liability, in which case a cash pay- 19. PPACA expanded eligibility for Medicaid to include nonelderly ment will be made for the portion beyond the liability; such residents with income up to 133 percent of the federal poverty payments appear in the federal budget as outlays. level. A provision of the Health Care and Education Reconcilia- tion Act of 2010 effectively increased that threshold to 138 per- 21. For a further description of accountable care organizations, see cent of the FPL. The FPL is currently $22,050 for a family of Congressional Budget Office, Budget Options Volume I: Health four. Care (December 2008), pp. 72–74. CBO
  • 49.
    CHAPTER TWO THE LONG-TERM BUDGET OUTLOOK 35 tary of Health and Human Services broad authority to other providers of Medicare’s services. In particular, develop and conduct experiments to test and refine new increases in payment rates for many providers will be held approaches to paying providers and delivering health care below the rate of increase in the average cost of providers’ benefits. The Secretary has the authority to implement inputs. such approaches on a broader scale (including nationally) if an evaluation concludes that they have favorable effects Taking all the provisions of the legislation together, CBO on the quality of care and expenditures. expects that, adjusted for inflation, Medicare spending per beneficiary will increase at an average annual rate of In addition, the legislation establishes an Independent less than 2 percent during the next two decades—com- Payment Advisory Board (IPAB), which will be required pared with a roughly 4 percent annual growth rate during to submit proposals to reduce Medicare’s spending per the past two decades (a calculation that excludes the enrollee if the growth of such spending is projected to effect of establishing the Medicare prescription drug ben- exceed certain targets. Those proposals would go into efit). It is unclear whether that lower rate of growth can effect automatically unless blocked or replaced by subse- be sustained and, if so, whether it will be accomplished quent legislative action. From 2015 through 2019, the through greater efficiencies in the delivery of health care target growth rate is the average of general price inflation or will instead reduce access to care or diminish the qual- and measured price inflation for medical services. In sub- ity of care (relative to the situation under prior law). sequent years, the target growth rate is the percentage increase in per capita GDP plus 1 percentage point. The Another provision that may be difficult to sustain will legislation places a number of limitations on the actions slow the growth of federal subsidies for health insurance available to the IPAB, including a prohibition against purchased through the insurance exchanges. For enrollees modifying Medicare’s eligibility rules or reducing who receive subsidies, the amount they will have to pay benefits. Nevertheless, CBO expects these provisions to depends primarily on a formula that determines what restrain Medicare spending somewhat. share of their income they have to contribute to enroll in a relatively low-cost plan (with the subsidy covering the The legislation also imposes an excise tax on relatively difference between that contribution and the total pre- expensive insurance plans offered through employers, mium for that plan). Initially, the percentages of income starting in 2018. The primary impact of that tax on the that enrollees must pay are indexed so that the subsidies federal budget is through federal revenues, as discussed in will cover roughly the same share of the total premium Chapter 4; whether and how it will affect federal spend- over time. After 2018, however, an additional indexing ing for health care (for example, through spillovers from factor will probably apply; if so, the shares of income that changes in private spending for health care) is difficult to enrollees have to pay will increase more rapidly, and the predict. shares of the premium that the subsidies cover will decline.22 Questions About Sustainability One challenge that arises in projecting federal outlays for Net Budgetary Effects of the Legislation health care over the long term is that the recent legislation CBO and the staff of the Joint Committee on Taxation either left in place or put into effect a number of proce- have provided detailed estimates of the effects of the dures that may be difficult to sustain over a long period. recently enacted health care legislation on the federal For example, the legislation did not alter the sustainable budget over the period from 2010 to 2019 and have pro- growth rate mechanism used for determining updates to vided a less precise analysis for the subsequent decade.23 Medicare’s payment rates for physicians; under that Those estimates show an increase in mandatory outlays mechanism, those rates are scheduled to be reduced by of $382 billion and an increase in federal revenues of about 21 percent in 2010 and then decline further in $525 billion over the 2010–2019 period, yielding a subsequent years. Since that mechanism was enacted in 1997, its provisions have usually been modified to avoid 22. The additional indexing factor will apply in any year (after 2018) scheduled reductions in payment rates, and legislation in which the total costs of exchange subsidies exceed a specified was just enacted to delay cuts in those payment rates percentage of GDP; CBO expects that condition will probably be until December 2010 (a development that is not reflected met. in the projections). At the same time, the legislation 23. See Congressional Budget Office, letter to the Honorable Nancy includes provisions that will constrain payment rates for Pelosi about the budgetary effects of H.R. 4872. CBO
  • 50.
    36 THE LONG-TERM BUDGET OUTLOOK reduction in deficits of $143 billion. CBO and JCT sort of extrapolation may not be appropriate. Distin- expect that the legislation will also reduce federal budget guishing between a series of shifts in the level of federal deficits over the ensuing decade relative to those pro- health care spending and permanent changes in the jected under prior law—with a total effect during that growth rate of such spending is difficult. Although CBO decade in a broad range around 0.5 percent of GDP. The can provide a rough indication of the legislation’s effect imprecision of that calculation reflects the even greater on the level of spending 20 years ahead, the agency does degree of uncertainty that attends to it, compared with not believe that it has an analytic basis for evaluating the 10-year budget estimates. Federal outlays for health whether the legislation’s effect on the rate of growth of care are projected to remain higher than they would have spending over the next 20 years will continue. been under prior law for most of that second decade, but to fall slightly below the prior-law level by 2030 (under Therefore, to project mandatory federal spending on the assumption that all of the legislation’s provisions are health care for the longer term—incorporating the fully implemented).24 impact of the new laws—CBO has adopted a relatively simple and mechanical approach. Specifically, the projec- Determining the effects of the legislation beyond 2030 is tions incorporate the effects of the legislation on the level very difficult because of the considerable uncertainties of that spending over the next one or two decades and involved. A wide range of changes could occur—in peo- then calculate spending in subsequent years by applying ple’s health, in the sources and extent of their insurance the same growth rates that would have applied in the coverage, and in the delivery of medical care—that are absence of the legislation. In other words, the incremental almost impossible to predict but that could have a signifi- effects of the legislation are extrapolated using the same cant effect on federal health care spending, both under growth rates as are projected in the absence of the legisla- the legislation and under prior law. Furthermore, over a tion. Consequently, because the legislation is expected to longer time horizon, it becomes very challenging to dis- reduce Medicare’s spending by about 20 percent in 2030, entangle the effects of the legislation from the effects of projected Medicare spending will be about 20 percent other changes that would have been made even without lower than the prior-law projections in subsequent years. the legislation to slow the growth of private and public Likewise, because the legislation is estimated to raise spending on health care. Medicaid’s spending by about 20 percent in 2030, Med- icaid’s spending is projected to remain about 20 percent Because the legislation is expected to reduce mandatory above the prior-law estimates thereafter. federal spending on health care 20 years from now, the average growth rate of that spending calculated over those two decades will be slightly lower than it would otherwise Long-Term Projections of Mandatory have been. It might seem natural to assume that the dif- ference in growth rates will continue indefinitely, but that Federal Spending CBO calculated mandatory federal spending on health care under two scenarios. The first is intended to reflect 24. CBO also estimated the effects of the legislation on the “federal the provisions of current law; the second deviates from budgetary commitment to health care,” a term that describes the sum of net federal outlays for health programs and tax preferences current law: for health care (such as the tax exclusion for employment-based health insurance). Specifically, CBO estimated that the two laws B Under the extended-baseline scenario, the effects of will increase that commitment by about $390 billion over the the recent health care legislation as estimated by CBO 2010–2019 period. In subsequent years, however, the effects of and JCT for the next two decades are layered on top of the provisions of the laws that will tend to decrease the federal budgetary commitment to health care will exceed the effects of the CBO’s March 2010 baseline projections. Medicare’s provisions that will increase it. As a result, CBO expects that, payment rates for physicians are assumed to be relative to prior law, the legislation will generate a net reduction in reduced as specified under current law through 2020. the federal budgetary commitment to health care during the Beyond the next 20 years, the projected growth rates 2020–2029 period. For additional discussion of that term, see in spending for the government’s mandatory health Congressional Budget Office, letter to the Honorable Max Baucus about different measures for analyzing current proposals to reform care programs are based on CBO’s projections of health care. In this report, the effects of the legislation on tax demographic and economic trends (see Appendix B) preferences for health care and tax revenues more generally are and the agency’s projections about excess cost growth examined in Chapter 4. for the 2030–2084 period. CBO
  • 51.
    CHAPTER TWO THE LONG-TERM BUDGET OUTLOOK 37 B Under the alternative fiscal scenario, the effects of the at the same rate under both scenarios thereafter.26 The recent health care legislation as estimated by CBO and resulting difference between the extended-baseline JCT for the next decade are layered on top of CBO’s scenario and the alternative fiscal scenario highlights the March 2010 baseline projections—except that Medi- significance of those policies for the federal budget. care’s payment rates for physicians are assumed to rise gradually through 2020.25 Beyond that point, the pro- The subsidies provided through the new insurance jected growth rates in spending for the government’s exchanges are projected differently under the two scenar- mandatory health care programs are based on CBO’s ios. For the extended-baseline scenario, those outlays are projections of demographic and economic trends and extrapolated through 2029 in a way that is consistent the agency’s projections about excess cost growth for with the cost estimate for the health care legislation. the 2021–2084 period. For the alternative fiscal scenario, outlays are projected through 2029 in a similar manner but without applying The two scenarios thus differ in only one respect through the additional indexing provision that would reduce 2020: Under the extended-baseline scenario, the existing the government’s share of premium costs (described on sustainable growth rate formula used to determine pay- page 35). For each scenario, projections for outlays ment rates for physicians is assumed to continue to apply, beyond 2029 are based on CBO’s projections of demo- resulting in sharp reductions in those payment rates from graphic and economic trends and the agency’s projections the current amounts; under the alternative fiscal scenario, of excess cost growth for Medicaid and all other health Medicare’s payment rates for physicians are instead care spending over the 2030–2084 period. assumed to increase gradually, pushing up total spending. The resulting difference between the scenarios regarding In both scenarios, the projections of exchange subsidies physicians’ payments by Medicare during the first are subject to an especially large degree of uncertainty and 10 years affects the projections of Medicare’s spending could err in either direction. On the one hand, income beyond 2020 as well. growth and the indexing of the subsidies may diminish the value of the exchange subsidies over time; on the Between 2020 and 2030, the difference between the two other hand, changes in other insurance options (includ- scenarios is greater. Under the extended-baseline scenario, ing employment-based insurance) could cause spending projected federal spending is assumed to be constrained on exchange subsidies to grow faster than projected. In all by a number of policies specified in the recent health care of the projections, the outlays for exchange subsidies are legislation—the continuing reductions in updates for presented in combination with outlays for Medicaid (and Medicare’s payment rates, the constraints on Medicare CHIP) both for ease of exposition and to reflect the fact imposed by the IPAB, and the additional indexing provi- that they all constitute federal subsidies to provide health sion that will slow the growth of exchange subsidies after insurance for lower- and moderate-income households. 2018. Because those policies may be difficult to maintain (Most of the exchange subsidies are classified as outlays; over the long term, in the alternative fiscal scenario it is the portion that reflects reductions in revenue is included assumed that they will not continue after 2020. Given in the revenue projections discussed in Chapter 4.) CBO’s projection methodology, the upshot of those assumptions is that federal spending would be higher in Projected Spending 2030 under the alternative fiscal scenario and would grow In 2010, federal spending on Medicare, Medicaid, and CHIP will amount to 5.5 percent of GDP, CBO expects, 25. For the alternative fiscal scenario, CBO assumed that Medicare’s with Medicare accounting for 3.6 percent of GDP and payment rates for physicians would be held constant in 2010 at federal spending on Medicaid and CHIP adding 1.9 per- the 2009 amounts and then increased annually through 2020 cent of GDP. using the Medicare economic index—a measure of input costs for physicians’ services, adjusted for productivity gains. After 2020, Medicare’s spending on physicians’ services is combined with all 26. CBO assumed that under both scenarios, Medicare benefits other Medicare spending, which is projected to grow using the would continue to be paid in full regardless of the financial status assumptions described above. of the Hospital Insurance Trust Fund. CBO
  • 52.
    38 THE LONG-TERM BUDGET OUTLOOK Figure 2-2. Under the alternative fiscal scenario, mandatory federal spending on the major health care programs would be Mandatory Federal Spending on higher because CBO assumed that several policies Health Care, by Category, Under designed to limit that spending would not continue in CBO’s Extended-Baseline Scenario effect; as a result, projected spending would be greater, particularly for Medicare, than under the extended- (Percentage of gross domestic product) baseline scenario. Specifically, Medicare’s spending would 10 grow to about 7 percent of GDP by 2035, and federal Actual Projected spending on Medicaid, CHIP, and the exchange subsidies would reach about 4 percent of GDP—so total federal 8 spending on those programs would be about 11 percent of GDP (see Figure 2-3). Extrapolating to 2080, federal Medicaid, CHIP, and 6 spending on those programs would continue to rise, Exchange Subsidies reaching about 19 percent of GDP. Medicare’s spending 4 would be between 13 percent and 14 percent of GDP, or about 2 percentage points higher than under the Medicare extended-baseline scenario. Federal spending for Medic- 2 aid, CHIP, and the exchange subsidies in 2080 would be between 5 percent and 6 percent of GDP—close to the 0 amount estimated under the extended-baseline scenario, 2000 2005 2010 2015 2020 2025 2030 2035 because the policies governing Medicaid and CHIP are Source: Congressional Budget Office. the same in both cases and because exchange subsidies represent a relatively small share of GDP. (For CBO’s pro- Notes: The extended-baseline scenario adheres closely to current jections of national spending on health care, see Box 2-1 law, following CBO’s 10-year baseline budget projections on page 40.) through 2020 (with adjustments for the recently enacted health care legislation) and then extending the baseline concept for the rest of the long-term projection period. Comparison with CBO’s 2009 Projections In last year’s report, CBO projected that mandatory fed- (For details, see Table 1-1 on page 3.) eral spending on the major health care programs would CHIP = Children’s Health Insurance Program. total between 10 percent and 11 percent of GDP in 2035 Under the extended-baseline scenario, federal spending under the extended-baseline scenario, slightly higher than for those programs and for the exchange subsidies would the agency’s current projection.28 That total was projected to rise to about 19 percent of GDP by 2080 in last year’s total about 10 percent of GDP in 2035; about 6 percent report, about 2 percentage points higher than the current would be for Medicare, and about 4 percent would be projection. Under the alternative fiscal scenario, last year’s for Medicaid, CHIP, and the exchange subsidies (see projection for mandatory federal spending on health care Figure 2-2). Extrapolating to 2080, total federal spending was about 11 percent of GDP in 2035 and was between on those major health care programs would reach about 19 percent and 20 percent of GDP in 2080—roughly the 17 percent of GDP: Medicare’s share would be between same as the current projections. 11 percent and 12 percent, and the share for Medicaid, The differences from last year’s projections reflect both CHIP, and the exchange subsidies would be between technical changes in CBO’s methodology and the impact 5 percent and 6 percent.27 The figures for 2080 should of the recently enacted health care legislation. For the be viewed with much more caution because of the extended-baseline scenario, CBO’s technical changes greater uncertainty involved in making such long-range reduced projected federal spending on health care projections. through 2035, compared with last year’s projection. 27. For an analysis of the relative impacts that aging of the population 28. The estimates from last year’s report have been adjusted to reflect and excess cost growth have on the projections, see Box 1-2 in gross spending for Medicare, rather than net spending, to make Chapter 1. them comparable with the estimates in this year’s report. CBO
  • 53.
    CHAPTER TWO THE LONG-TERM BUDGET OUTLOOK 39 Figure 2-3. Under both scenarios, the relatively small net changes in mandatory federal spending on health care relative to last Mandatory Federal Spending on year’s projections mask larger gross differences in pro- Health Care Under CBO’s jected spending on Medicare, Medicaid, CHIP, and the Long-Term Budget Scenarios exchange subsidies. Specifically, under the extended- baseline scenario, gross Medicare spending in 2035 is (Percentage of gross domestic product) now projected to be lower by nearly 2 percent of GDP, 12 compared with last year’s projections, and outlays for Actual Projected Medicaid, CHIP, and the new exchange subsidies are 10 Alternative Fiscal higher by about 1 percent of GDP.29 (Again, those differ- Scenario ences in the component projections reflect both technical 8 changes and the effects of legislation.) By 2080, the Extended-Baseline differences from last year’s projections are larger—gross 6 Scenario Medicare spending is lower in this year’s projection, by about 4 percent of GDP, and spending for Medicaid, 4 CHIP, and the exchange subsidies is higher, by about 2 percent of GDP. Those results largely reflect CBO’s 2 judgment that Medicare’s spending will grow at a some- what faster rate than Medicaid’s after 2030; consequently, 0 the savings from reducing projected Medicare spending 2000 2005 2010 2015 2020 2025 2030 2035 in 2030 become magnified over time relative to the added Source: Congressional Budget Office. costs projected for Medicaid, CHIP, and the exchange Note: The extended-baseline scenario adheres closely to current subsidies. law, following CBO’s 10-year baseline budget projections through 2020 (with adjustments for the recently enacted Projections Under Alternative Assumptions health care legislation) and then extending the baseline Although all long-term economic and demographic concept for the rest of the long-term projection period. The trends are uncertain and thus difficult to forecast, excess alternative fiscal scenario incorporates several changes to cost growth in health care spending during the next current law that are widely expected to occur or that would modify some provisions that might be difficult to sustain for 75 years may be particularly so. The systems of health a long period. (For details, see Table 1-1 on page 3.) care and health care financing have existed in their cur- rent forms for only a few decades, and medical technol- The net impact of the recent legislation was to increase ogy continues to evolve rapidly. The projections in this federal spending for most of the next 20 years; but by report will undoubtedly prove to be inaccurate in one 2035, the incremental effect of the legislation (if all of its direction or another. And judging their accuracy will be provisions are fully implemented) is a net reduction in difficult even after the fact, because they assume no projected expenditures (see Figure 2-4 on page 42). By changes in federal law or policies, and such changes are that point, the savings in Medicare are expected to exceed virtually certain to occur. Even without policy changes, the combined increase in outlays for Medicaid, CHIP, though, actual spending for health care could be much and the exchange subsidies. Even so, most of the differ- lower or much higher than the figures contained in ence from last year’s projection for 2035 is attributable to CBO’s and other forecasters’ projections. CBO’s technical changes rather than the effects of the For comparison purposes, CBO projected federal spend- legislation. For the alternative fiscal scenario, the net ing for Medicare, Medicaid, CHIP, and the exchange effect of CBO’s technical changes was about the same as subsidies under varying assumptions about excess cost for the extended-baseline scenario. However, under that growth. The effects of that variation are easiest to scenario, the net impact of the recent legislation would be to increase federal spending in 2035 because of the 29. In last year’s report, the projections for Medicaid did not include assumption that a number of important provisions of the spending for CHIP; however, spending on that program is rela- legislation that would reduce federal spending would not tively small (about $7 billion in 2008), representing less than one- continue in effect beyond 2020. tenth of 1 percent of GDP. CBO
  • 54.
    40 THE LONG-TERM BUDGET OUTLOOK Box 2-1. National Spending on Health Care The Congressional Budget Office (CBO) has a GDP would be about 1 percentage point higher in limited ability to project national spending on health 2035 and roughly 2 percentage points higher in care because the agency does not track several compo- 2080. nents of those expenditures as closely as it analyzes the components that are part of the federal budget. Methodology To generate projections of total expenditures on To estimate total spending for health care for the health care over the longer term, the agency has com- 2009–2019 period, CBO started with its projections bined its own projections with estimates and projec- of federal spending on the government’s major man- tions developed by the Office of the Actuary in the datory health care programs—Medicare, Medicaid, Centers for Medicare and Medicaid Services (CMS).1 the Children’s Health Insurance Program, and the The projections are rough and involve substantial insurance subsidies that will be provided through uncertainty—especially those that extend far into the exchanges established by the recently enacted health future—and thus should be viewed with caution. care legislation (the Patient Protection and Affordable Care Act and the Health Care and Education Recon- During the past 30 years, total spending on health ciliation Act of 2010). Other spending for health care care has almost doubled as a share of the economy, includes payments by private health insurers, out-of- growing from 8 percent to 15 percent of gross domes- pocket payments by households, and other public tic product (GDP). To project such spending in the spending. CBO projected those categories of spend- future, CBO developed two scenarios. Under the ing for the 2009–2019 period using its projections of extended-baseline scenario, which reflects current payments by private health insurers and the CMS law, total spending for health care would increase actuaries’ projections of all other components of that to about 26 percent of GDP by 2035. (All years spending. CBO also relied on the CMS actuaries’ reported here are calendar years.) By 2080, total estimate of the incremental effects of the recently spending on health care under that scenario would enacted health care legislation on other spending account for roughly 41 percent of GDP, in CBO’s (that is, spending other than federal spending on the estimation. Under the alternative fiscal scenario, in major mandatory health care programs).2 Through which several policies designed to restrain federal 2019, those projections show higher levels of other spending on health care are assumed not to continue spending and total spending on health care as a result in effect, total spending on health care as a share of of the legislation. 1. As used here, the term “total expenditures” means spending 2. See Centers for Medicare and Medicaid Services, Office of on health care services and supplies; it excludes spending on the Actuary, memorandum on the effects of the Patient medical research, structures, and equipment. Protection and Affordable Care Act (April 22, 2010). Continued illustrate by changing the rate of excess cost growth that If, instead, excess cost growth for those programs contin- applies after 2020 under the alternative fiscal scenario. A ued to equal 2 percentage points indefinitely—or roughly projection in which such growth is held constant at zero, the average rate observed since 1975—mandatory federal although implausible, is useful because it isolates the spending for health care would grow to between 11 per- effect that the aging of the population has on spending cent and 12 percent of GDP by 2035. (Under the alter- (see Figure 2-5 on page 43). In that case, mandatory native fiscal scenario used in this report, that figure is federal spending on health care would increase from 11 percent in 2035.) By 2080, the differences between 5.5 percent of GDP in 2010 to nearly 9 percent by 2035. the two projections would be much greater; mandatory CBO
  • 55.
    CHAPTER TWO THE LONG-TERM BUDGET OUTLOOK 41 Box 2-1. Continued National Spending on Health Care CBO derived the path of other spending on health the recently enacted health care legislation is pro- care after 2019 by combining its projections of jected to have much smaller effects on total spending demographic and economic changes with assump- for health care. tions about excess cost growth for such spending (that is, growth in spending per person that exceeds Specifically, the projections in last year’s report used the growth of GDP per person, after adjusting for data from 2006 as the starting point and then applied changes in the population’s age distribution). Specifi- the historical rate of excess cost growth for other cally, CBO used the average rate of excess cost growth spending on health care to determine the total since 1985 for total health care spending—1.7 per- amount of other spending through 2019 (after which centage points—as the initial rate of excess cost cost growth was projected to slow). This year’s report growth for the longer-term projections. CBO also updated that starting point to 2008 and then used a assumed that the rate of excess cost growth for other combination of projections from CBO and the CMS health care spending in 2084 would be zero. In actuaries to generate estimates for other spending between, excess cost growth is assumed to decline lin- between 2009 and 2019. Those changes resulted in a early—that is, by the same number of fractional per- projected amount of other spending on health care in centage points each year. The resulting calculations of 2019 that is lower than the figure in last year’s other spending were then combined with the projec- report—a difference of about 3 percent of GDP. After tions of federal spending for the government’s major accounting for the increase in other spending mandatory health care programs to yield a rough pro- expected to result from the recent legislation, CBO jection of total spending on health care. used that lower amount as the starting point for the projection of other spending beyond 2019. The pro- Comparison with CBO’s 2009 Projections jection for those years was also affected by technical In the Long-Term Budget Outlook that CBO released changes in CBO’s approach for projecting other in June 2009, total spending on health care was spending on health care over the longer term. projected to reach about 31 percent of GDP in 2035 and about 46 percent in 2080 under the extended- baseline scenario.3 The corresponding figures for this year are about 5 percentage points lower than last 3. Last year’s report focused on net Medicare spending, so year’s projected levels. Essentially all of that difference premiums paid by enrollees and other offsetting receipts for Medicare were included in other health care spending. The in 2035 and the vast majority of the difference in comparisons of Medicare and other health care spending 2080 is attributable to the use of updated data and to between this report and last year’s report adjust for that the technical changes CBO made in its methodology; difference. federal spending on health care in that year is projected to status of Part A of Medicare. A commonly used measure be between 9 percent and 10 percent of GDP under the is the actuarial balance—that is, the present value of reve- assumption that excess cost growth is zero, compared nues plus the current trust fund balance minus the pres- with projected spending of between 30 percent and ent value of outlays and the desired trust fund balance 31 percent of GDP under the assumption that excess (one year of outlays) at the end of a specified period.30 cost growth is equal to 2 percentage points indefinitely. 30. A present value is a single number that expresses a flow of current Trust Fund Measures and future income or payments in terms of an equivalent lump Projections of the balances in the Hospital Insurance sum received or paid today. Here, it is calculated over 75 years Trust Fund offer another way to look at the financial using a 3 percent real discount rate. CBO
  • 56.
    42 THE LONG-TERM BUDGET OUTLOOK Figure 2-4. Comparison of CBO’s 2009 and 2010 Projections of Mandatory Federal Spending on Health Care Under the Extended-Baseline Scenario (Percentage of gross domestic product) 12 2009 Projection 10 8 2010 Projection 2010 Projection Excluding Effects of Recent Health Care Legislation 6 4 0 2010 2015 2020 2025 2030 2035 Source: Congressional Budget Office. Note: The extended-baseline scenario adheres closely to current law, following CBO’s 10-year baseline budget projections through 2020 (with adjustments for the recently enacted health care legislation) and then extending the baseline concept for the rest of the long- term projection period. (For details, see Table 1-1 on page 3.) That difference is usually shown as a percentage of the ples with income over $250,000 (those income thresh- present value of taxable payroll over the same period. olds are not indexed for inflation); the resulting revenues A negative actuarial balance means that outlays plus the will be credited to the trust fund. (The legislation also desired trust fund balance will exceed revenues plus the imposes a 3.8 percent tax on investment income for the current balance; its value represents the amount by which same households, but the revenues from that provision revenues as a percentage of taxable payroll (the income will not be directed to the HI trust fund.) rate) would have to be increased immediately and in every year of the projection period to cover all projected Using CBO’s current projections for the extended- costs and provide the desired balance in the trust fund at baseline scenario, the actuarial imbalance for the HI trust the end of the period. Alternatively, outlays as a percent- fund over 75 years is 2.4 percentage points, which is the age of taxable payroll (the cost rate) could be reduced by difference between projected income equal to 4.2 percent an equivalent amount—or a combination of the two of taxable payroll and projected costs totaling 6.5 percent approaches yielding the same total effect could be used to of taxable payroll (see Table 2-2 on page 44). Eliminating address the imbalance. a gap of that size would require, as an example, either an immediate increase in the basic rate of HI payroll taxes, The recent health care legislation contains numerous from its current 2.9 percent to 5.3 percent, or an imme- provisions that will affect the actuarial balance in the HI diate cut of about one-third in spending on Part A. Given trust fund. Many provisions will reduce outlays for Part A the tremendous uncertainty surrounding long-term pro- of Medicare. In addition, the legislation increased the HI jections of spending for health care, however, a more use- payroll tax rate by 0.9 percentage points (to 3.8 percent) ful metric may be the actuarial imbalance in the nearer for individuals with income over $200,000 and for cou- term. CBO estimates that the imbalance over 25 years is CBO
  • 57.
    CHAPTER TWO THE LONG-TERM BUDGET OUTLOOK 43 Figure 2-5. Mandatory Federal Spending on Health Care Under CBO’s Alternative Fiscal Scenario and Different Assumptions About Excess Cost Growth (Percentage of gross domestic product) 12 Excess Cost Growth of 2.0 Percentage Points 10 Slowing Growtha 8 No Excess Cost Growth 6 4 0 2010 2015 2020 2025 2030 2035 Source: Congressional Budget Office. Notes: Excess cost growth refers to the extent to which the growth rate of annual health care spending per beneficiary is assumed to exceed the growth rate of nominal gross domestic product per capita. The alternative fiscal scenario incorporates several changes to current law that are widely expected to occur or that would modify some provisions that might be difficult to sustain for a long period. (For details, see Table 1-1 on page 3.) a. Under the alternative fiscal scenario, the rate of excess cost growth declines each year from an initial value of 1.7 percentage points in 2021. 0.7 percentage points under the extended-baseline sce- ences between the current calculations of the actuarial nario. (The projected imbalances are larger under the balance and those provided last year reflect a combination alternative fiscal scenario because Medicare spending is of technical revisions and changes resulting from the higher under that scenario and tax revenues are lower.) recent legislation. (Changes in the economic forecast also affected the projections of payroll tax revenue.) In last year’s report, the projected imbalances under the extended-baseline scenario were substantially larger for The reductions in projected Part A outlays and increases comparable periods—6.1 percent of taxable payroll over in projected HI revenues resulting from the legislation 75 years, and 1.3 percent over 25 years.31 As with the pro- will significantly raise balances in the HI trust fund and jections of overall federal health care spending, differ- may suggest that substantial additional resources have been set aside to pay for future Medicare benefits. How- 31. The imbalances that CBO projected last year were also larger than ever, only the additional savings by the government as a those projected by the Medicare program’s trustees. In 2009, the whole—from reductions in unified budget deficits— trustees projected an actuarial imbalance equal to 3.9 percent of truly increase the government’s ability to pay for future taxable payroll over 75 years. One reason for the difference from CBO’s previous projection is that the trustees assumed a lower rate spending, whether for Medicare benefits or other pro- of excess cost growth in Medicare—averaging about 1 percentage grams. At least initially, those savings will be much point per year over the projection period. The trustees have not smaller than the increase in balances in the trust fund. yet released their 2010 estimate of the actuarial imbalance. In particular, unified budget accounting shows that the CBO
  • 58.
    44 THE LONG-TERM BUDGET OUTLOOK majority of the HI trust fund savings achieved under the Table 2-2. legislation through 2019 will be used to pay for other spending and therefore will not enhance the government’s Financial Measures for Medicare’s underlying ability to pay for future Medicare benefits. Hospital Insurance Trust Fund Under Although the HI trust fund has important legal meaning, CBO’s Extended-Baseline Scenario in that its balances are a measure of the amounts that gov- ernment has the legal authority to spend under current (Percentage of taxable payroll) law, it has little economic significance.32 Projection Period Income Cost Actuarial (Calendar Years) Rate Rate Balance 25 Years (2010 to 2034) 3.8 4.5 -0.7 Slowing the Growth of Health Care Costs 50 Years (2010 to 2059) 4.0 5.5 -1.5 In order for policymakers to put the nation on a sustain- able budgetary path, they will need to let revenues rise to 75 Years (2010 to 2084) 4.2 6.5 -2.4 much higher levels (as a share of GDP) than have been collected historically, decrease spending significantly from Source: Congressional Budget Office. projected levels, or adopt some combination of those two Note: Over the relevant periods, the income rate is the present approaches. Because health care costs will account for a value of annual revenues (including the initial trust fund significant share of the federal budget under current law, balance) and the cost rate is the present value of annual and the growth of those costs is a major contributor to outlays (including the target trust fund balance at the end of the period), each divided by the present value of taxable the long-term fiscal pressures facing the country, policy payroll or gross domestic product. The actuarial balance is options to restrain the growth of federal spending on the difference between the income and cost rates. health care will continue to attract considerable interest. successful policies to restrain spending growth. In many The recently enacted health care legislation included cases, the current health care system does not provide many provisions designed to reduce health care spending incentives for doctors, hospitals, and other providers of (relative to prior projections), and it will be important to health care—or their patients—to control costs. monitor the effects of those provisions carefully as they Although the recent legislation took some initial steps are implemented. Information learned from the pilot toward modifying those incentives, more substantial programs and demonstrations mandated by the legisla- changes will probably be needed to significantly lower the tion will be particularly useful in developing and refining future trajectory of health care spending. For example, future policies. given the key role of medical technology in contributing More generally, making appropriate changes in financial to spending growth, slowing the growth of spending over incentives will probably be critical in developing the long term will probably require decreasing the pace of adopting new treatments and procedures or limiting the breadth of their application. Such changes need not 32. See Congressional Budget Office, letter to the Honorable Jeff Sessions providing additional information on the effect of the involve explicit rationing but could occur as a result of Patient Protection and Affordable Care Act on the Hospital market mechanisms or policy changes that affect the Insurance Trust Fund (January 22, 2010). incentives to develop and use more costly treatments. CBO
  • 59.
    CHAPTER 3 The Long-Term Outlook for Social Security T he federal government spends more on Social Security than it does on any other single program. dren of those retired workers. In general, workers qualify for retirement benefits if they are age 62 or older and Created in 1935, the program now consists of two parts: have paid sufficient Social Security taxes for at least 10 Old-Age and Survivors Insurance (OASI), which pays years. However, Social Security also provides other types benefits to retired workers and to their dependents and of benefits. The program pays benefits to survivors of survivors; and Disability Insurance (DI), which makes deceased workers, who make up 12 percent of beneficia- payments to disabled workers who have not reached full ries. In addition, workers under the full retirement age retirement age (the age of eligibility for full retirement who have had to limit their employment because of a benefits) and to their dependents. In all, about 53 million physical or mental disability can qualify for DI benefits, people currently receive Social Security benefits. The in many cases with a shorter employment history. Dis- Congressional Budget Office estimates that outlays for abled workers and their spouses and children account for that program in fiscal year 2010 will total about $700 bil- 19 percent of beneficiaries.1 (Retired workers and their lion, accounting for one-fifth of all federal spending. dependents receive 73 percent of Social Security benefits, survivors of deceased workers receive 11 percent, and During the program’s first four decades, spending for disabled workers and their spouses and children receive Social Security increased relative to the size of the econ- 16 percent of benefits.) omy, reaching about 4 percent of gross domestic product in the mid-1970s. That increase was caused largely by The benefits that retired or disabled workers initially repeated expansions of the program. Costs rose to receive are based on their individual earnings histories. 4.9 percent of GDP in 1983, the year that the last major Both those earnings and the formula used to compute piece of legislation affecting Social Security was enacted. initial benefits are indexed to changes in average annual Between 1984 and 2008, spending for Social Security earnings for the workforce as a whole. In subsequent fluctuated between 4.2 percent and 4.6 percent of GDP. years, a cost-of-living adjustment is applied to the initial During the recent recession, GDP contracted and Social benefit to reflect annual growth in consumer prices. Security outlays increased more rapidly than they would have with stable economic growth because the number of For workers born before 1938, the full retirement age is OASI and DI claimants increased as the job market dete- 65. Under current law, that age is gradually increasing riorated. As a result, outlays rose to 4.8 percent of GDP and will be 67 for people born in 1960 or later. The age in 2009 (see Figure 3-1). CBO anticipates that, if the full at which workers may start receiving reduced benefits, benefits specified under current law are paid, spending 62, remains the same. for Social Security will reach 6.2 percent of GDP in 2035 and remain close to that figure in ensuing decades. The Social Security Administration estimates that work- ers who retire at age 65 in 2010 and who had average annual earnings—earnings equal to the average earnings How Social Security Works Social Security is often characterized as a retirement 1. See Congressional Budget Office, Social Security Disability Insur- program because a majority of its beneficiaries—about ance: Participation Trends and Their Fiscal Implications, Issue Brief 69 percent—are retired workers or the spouses and chil- (forthcoming). CBO
  • 60.
    46 THE LONG-TERM BUDGET OUTLOOK Figure 3-1. Spending for Social Security Under CBO’s Long-Term Budget Scenarios (Percentage of gross domestic product) 7 Actual Projected 6 5 4 3 2 1 0 2000 2005 2010 2015 2020 2025 2030 2035 Source: Congressional Budget Office. Note: Projected spending for Social Security is identical under CBO’s two long-term budget scenarios, the extended-baseline scenario and the alternative fiscal scenario. The extended-baseline scenario adheres closely to current law, following CBO’s 10-year baseline budget projections through 2020 (with adjustments for the recently enacted health care legislation) and then extending the baseline concept for the rest of the long-term projection period. The alternative fiscal scenario incorporates several changes to current law that are widely expected to occur or that would modify some provisions that might be difficult to sustain for a long period. (For details, see Table 1-1 on page 3.) of all workers in the country—throughout their career rity benefits. Revenues from both sources are credited to will qualify for an annual benefit of about $16,500. That the two Social Security trust funds (the Old-Age and Sur- amount will replace approximately 40 percent of their vivors Insurance Trust Fund and the Disability Insurance preretirement earnings. In coming decades, the replace- Trust Fund). Social Security benefits and the program’s ment rate will be lower for workers with average earnings administrative costs are paid from those funds; benefit who retire at age 65, mainly as a result of the scheduled payments represent roughly 99 percent of total outlays increase in the full retirement age. Because initial benefits for the program. The balances currently credited to those are based on beneficiaries’ previous earnings, indexed to funds have accumulated over many years, during which overall average wages, and because wages grow over time, revenues received by the trust funds exceeded the benefit the real (inflation-adjusted) value of those benefits will payments from those trust funds. Interest on those bal- continue to rise. ances is credited to the trust funds, but because those interest transactions represent payments from one part The Social Security program is funded by two sources of of the government (the general fund of the Treasury) to dedicated tax revenues. Roughly 97 percent of those reve- another (the Social Security trust funds), they do not nues derive from a payroll tax—currently, 12.4 percent of affect federal budget deficits or surpluses. earnings—that is split evenly between workers and their employers. Only earnings up to a maximum annual amount ($106,800 in 2010) are subject to the payroll tax. The Outlook for Social Security That amount, referred to as the taxable maximum, gener- Spending and Revenues ally increases each year at the same rate as average earn- The cost of the Social Security program will rise signifi- ings in the United States. The remaining share of tax rev- cantly in coming decades—a development that analysts enues—3 percent—is collected from the income taxes have long foreseen. Average benefits per beneficiary typi- that higher-income beneficiaries pay on their Social Secu- cally grow when the economy does because the earnings CBO
  • 61.
    CHAPTER THREE THE LONG-TERM BUDGET OUTLOOK 47 Figure 3-2. The Population Age 65 or Older as a Percentage of the Population Ages 20 to 64 (Percent) 40 Actual Projected 35 30 25 20 15 10 5 0 2000 2005 2010 2015 2020 2025 2030 2035 Source: Congressional Budget Office. on which those benefits are based also increase.2 In addi- relative to the size of the economy. As a result, by the tion, as members of the baby-boom generation reach latter part of this decade, outlays will regularly exceed retirement age, and as longer life spans lead to longer revenues, excluding interest, if the benefits specified retirements, a significantly larger share of the population under current law are paid. will draw Social Security benefits.3 As a result, the total dollar amount of benefits scheduled to be paid under According to CBO’s projections, the number of people current law will grow faster than the economy. age 65 or older will increase by 90 percent between now and 2035, compared with an increase of just 12 percent In 2010, for the first time since the enactment of the over that period in the number of people ages 20 to 64. Social Security Amendments of 1983, annual outlays for Today, that older population is one-fifth the size of the the program will exceed annual revenues, excluding inter- younger population; at those rates of growth, it will be est credited to the trust funds, CBO projects. Although more than one-third the size of the younger group by Social Security’s revenues are likely to be greater than out- 2035 (see Figure 3-2). About 92 million people will be lays again for the next few years, that relationship is not collecting Social Security benefits in 2035, CBO projects, expected to persist. As an increasing number of baby compared with 53 million who receive benefits today. boomers reach retirement age, outlays will increase Furthermore, the average benefit will have grown nearly as fast as GDP per person. CBO therefore estimates that, 2. CBO projects that the continuing rapid growth of health care costs will reduce the portion of compensation that workers receive unless changes are made to Social Security, spending for in wages subject to the Social Security payroll tax. That reduction the program will rise from 4.8 percent of GDP today to will lower the growth of both Social Security revenues and benefits 6.2 percent by 2035. Spending for Social Security will relative to what would occur if health care costs grew more slowly. then dip slightly to 5.9 percent as members of the large 3. The outlook for the baby boomers’ financial situation in retire- baby-boom generation die, but it will later turn upward ment is summarized in Congressional Budget Office, The Retire- again—reaching 6.3 percent of GDP in 2080—as a result ment Prospects of the Baby Boomers, Issue Brief (March 18, 2004); of beneficiaries’ increasing life spans.4 for details, see Congressional Budget Office, Baby Boomers’ Retirement Prospects: An Overview (November 2003). See also Congressional Budget Office, Will the Demand for Assets Fall 4. For details on CBO’s methodology for projecting Social Security’s When the Baby Boomers Retire?, Background Paper (September revenues and outlays, see CBO’s Long-Term Projections for Social 2009). Security: 2009 Update (August 2009). CBO
  • 62.
    48 THE LONG-TERM BUDGET OUTLOOK CBO’s projections of outlays for Social Security are the estimates that over the next 75 years, dedicated reve- same under both of the scenarios discussed in this nues—payroll taxes and taxes on benefits—will fall short report—the extended-baseline scenario and the alterna- of scheduled benefits in Social Security by 1.6 percent of tive fiscal scenario—but projections of Social Security taxable payroll under the extended-baseline scenario (see revenues depend upon which of those scenarios is used. Table 3-1). That shortfall equals 0.6 percent of GDP. In The revenues generated by payroll taxes are identical other words, to bring the program into actuarial balance under the two scenarios; however, projections of revenues over the next 75 years, payroll taxes could be immediately derived from the taxation of Social Security benefits are increased by 1.6 percent of taxable payroll and kept at higher under the extended-baseline scenario.5 Under that that higher rate, or scheduled benefits could be reduced scenario, which is based on the assumption that provi- by an equivalent amount. Under the alternative fiscal sions of current law remain unchanged, both the number scenario, the shortfall would be 2.1 percent of taxable of Social Security beneficiaries subject to taxes on benefits payroll, or 0.8 percent of GDP. and average income tax rates would increase.6 As a result, income taxes on Social Security benefits would grow to Another commonly used measure of the program’s sus- 4 percent of benefits in 2016, 6 percent in 2035, and tainability is the trust funds’ exhaustion date, which CBO 9 percent by 2080. Under the alternative fiscal scenario, projects will be 2039 under the extended-baseline sce- which is based on CBO’s assumption that tax rates would nario and 2037 under the alternative fiscal scenario.8 be lower, the income taxes on Social Security benefits that Once the trust funds are depleted, the Social Security are credited to the Social Security trust funds would equal Administration would no longer have legal authority to 4 percent of benefits in 2020 and later, CBO projects. Consequently, the projections of Social Security’s finances pay benefits. In the years following the exhaustion of the are somewhat less favorable under the alternative fiscal trust funds, annual outlays would therefore be limited to scenario than they are under the extended-baseline annual revenues. As a result, the benefits that can be paid scenario. under current law are substantially lower than the bene- fits that are scheduled to be paid. Thus, benefits can be A commonly used measure of the sustainability of a pro- projected in two ways: as “payable benefits,” which reflect gram that has a trust fund and a dedicated revenue source the limits imposed by the availability of balances in the is its actuarial balance—that is, the sum of the present trust funds; or as “scheduled benefits,” which reflect the value of revenues and the current trust fund balance benefit formulas specified in law, regardless of the trust minus the sum of the present value of outlays and a funds’ balances. This report uses the latter approach, target balance at the end of the period—over a specified which is consistent with a long-standing statutory period.7 For Social Security, that difference is traditionally requirement that CBO, in its baseline projections, presented as a percentage of the present value of taxable assume that laws are implemented as specified and that payroll over the period under consideration. CBO funding for entitlement programs is adequate to make all payments.9 5. Those projections do not incorporate the economic effects of the two scenarios. 8. CBO anticipates that the Disability Insurance trust fund will be 6. For information about CBO’s projections of total income taxes exhausted in 2018 (under both scenarios) and that the Old-Age under the two scenarios, see Chapter 4. For details on the impact and Survivors Insurance trust fund will be exhausted in 2042 of differing assumptions about income taxes on Social Security under the extended-baseline scenario and 2040 under the alterna- benefits, see Congressional Budget Office, The Outlook for Social tive fiscal scenario. However, this study focuses on the combined Security (June 2004), Box 3-1, pp. 24–25. trust funds. In 1994, the Social Security Trustees’ Report pro- jected that the DI trust fund would be exhausted in 1995. That 7. To account for the difference between the trust fund’s current bal- outcome was prevented by legislation that redirected revenue from ance and the desired balance at the end of the period, the balance the OASI trust fund to the DI trust fund. In part because of that at the beginning of the time frame is added to the projected reve- experience, it is a common analytical convention to consider the nues and an additional year of costs at the end of the period is DI and OASI trust funds as combined. added to projected outlays. The present value is a single number that expresses a flow of current and future income or payments in 9. See section 257 of the Balanced Budget and Emergency Deficit terms of an equivalent lump sum received or paid today. Control Act of 1985, P.L. 99-177, as amended; 2 U.S.C. 907. CBO
  • 63.
    CHAPTER THREE THE LONG-TERM BUDGET OUTLOOK 49 Table 3-1. Financial Measures for Social Security Under CBO’s Long-Term Budget Scenarios Projection Period Actuarial (Calendar years) Income Rate Cost Rate Balance As a Percentage of Taxable Payroll Extended-Baseline Scenario 25 Years (2010 to 2034) 15.2 15.1 0.2 50 Years (2010 to 2059) 14.6 15.7 -1.2 75 Years (2010 to 2084) 14.4 16.0 -1.6 Alternative Fiscal Scenario 25 Years (2010 to 2034) 15.1 15.1 * 50 Years (2010 to 2059) 14.2 15.7 -1.5 75 Years (2010 to 2084) 14.0 16.0 -2.1 As a Percentage of Gross Domestic Product Extended-Baseline Scenario 25 Years (2010 to 2034) 5.7 5.6 0.1 50 Years (2010 to 2059) 5.3 5.8 -0.4 75 Years (2010 to 2084) 5.2 5.8 -0.6 Alternative Fiscal Scenario 25 Years (2010 to 2034) 5.6 5.6 * 50 Years (2010 to 2059) 5.2 5.8 -0.5 75 Years (2010 to 2084) 5.1 5.9 -0.8 Source: Congressional Budget Office. Notes: Over the relevant periods, the income rate is the present value of annual revenues (including the initial trust fund balance) and the cost rate is the present value of annual outlays (including the target trust fund balance at the end of the period), each divided by the present value of taxable payroll or gross domestic product. The actuarial balance is the difference between the income and cost rates. The extended-baseline scenario adheres closely to current law, following CBO’s 10-year baseline budget projections through 2020 (with adjustments for the recently enacted health care legislation) and then extending the baseline concept for the rest of the long- term projection period. The alternative fiscal scenario incorporates several changes to current law that are widely expected to occur or that would modify some provisions that might be difficult to sustain for a long period. (For details, see Table 1-1 on page 3.) * = between -0.05 percent and 0.05 percent. CBO
  • 64.
    50 THE LONG-TERM BUDGET OUTLOOK Changes in CBO’s Long-Term Three broad approaches for constraining the rise in spending for Social Security have received considerable Social Security Projections attention. Those approaches, which could be imple- Since June 2009 mented separately or in combination, are as follows: The shortfalls for Social Security that CBO is currently projecting are larger than the ones projected in last year’s B Reduce the size of the initial payments that new Social Long-Term Budget Outlook. The 75-year imbalance has Security beneficiaries are scheduled to receive; increased from 1.3 percent of taxable payroll under the extended-baseline scenario to 1.6 percent and from B Raise the age specified in law—currently 67 for people 1.5 percent of taxable payroll under the alternative fiscal born in 1960 or later—at which workers become eligi- scenario to 2.1 percent. Those differences are the result of ble for full retirement benefits (thereby reducing the changes in both projected outlays and projected revenues. amount of the initial benefit received at any specific The projected 75-year cost rate—a measure of outlays— age at which a claimant chooses to start receiving is about 2 percent higher under both scenarios, owing to benefits); or near-term economic weakness, slightly lower projections of real wage growth, and technical modeling changes. B Reduce the annual cost-of-living adjustment that The projected 75-year income rate—a measure of Social beneficiaries receive once they become eligible for benefits. Security revenues—is about 1 percent lower than in 2009 under the alternative fiscal scenario because taxes on Alternatively, or in addition, Social Security’s finances benefits are projected to be lower as a share of benefits. could be improved by increasing the revenues flowing However, the projected income rate is slightly higher than into the trust funds—for example, by raising the payroll in 2009 under the extended-baseline scenario because tax rate or subjecting more earnings to the payroll tax. taxes on benefits are projected to be higher as a share Policymakers could also restore the system to long-term of benefits. actuarial balance by dedicating more general fund reve- nues to Social Security, but that action would have no effect on the overall federal budget. Slowing the Growth of Social Security Spending People generally consider the size of their expected Social CBO has recently evaluated a number of different policy Security benefits when deciding how much to save for options for changing Social Security and will present the retirement and how long to work. Those benefits are a results of that analysis in a separate report. That report major source of income for many people, and enacting focuses on how the options, if implemented, would affect any reductions in benefits well in advance of implementa- Social Security’s finances and alter the distribution of tion would give people time to respond by adjusting their benefits paid to and taxes paid by people in various plans for saving and retirement. groups distinguished by household income and year of birth.10 Among the options considered are a variety of 10. See Congressional Budget Office, Social Security Policy Options ways of reducing benefits and raising payroll taxes. (forthcoming). CBO
  • 65.
    CHAPTER 4 The Long-Term Outlook for Revenues F ederal revenues come from a variety of sources, including individual and corporate income taxes, payroll legislation—the Patient Protection and Affordable Care Act (P.L. 111-148), as amended by the Health Care and taxes, excise taxes, estate and gift taxes, customs duties, Education Reconciliation Act of 2010 (P.L. 111-152)— and other taxes and fees. Currently, proceeds from indi- that was enacted after CBO’s March projections were vidual income taxes and payroll taxes account for about completed. 85 percent of the federal government’s revenues. Under the extended-baseline scenario, revenues would Predicting the amount of revenues that will be collected rise considerably over time as a share of gross domestic in the future is difficult because such receipts are sensitive product because of the various tax reductions that are to economic developments and because policymakers scheduled to expire and the tax increases enacted in the frequently make changes to tax law. This analysis focuses health care legislation that are scheduled to go into effect. on two sets of assumptions about future policy—the In addition, the economic recovery and the interaction of extended-baseline scenario and the alternative fiscal the tax system with cumulative inflation and real (infla- scenario. tion-adjusted) growth in income would produce higher average tax rates—that is, taxes as a share of income. As a The extended-baseline scenario is based on the assump- result, revenues would rise from 15 percent of GDP in tion that the provisions of current law remain in effect. 2010 to 21 percent in 2020 and to 23 percent in 2035, Thus, under this scenario, the tax cuts enacted in the for a total increase of roughly 8 percentage points over Economic Growth and Tax Relief Reconciliation Act of the next 25 years (see Figure 4-1). By 2035, the tax sys- 2001 (EGTRRA) and the Jobs and Growth Tax Relief tem would be quite different from what it is today. Reconciliation Act of 2003 (JGTRRA) would expire as Households at all points in the income scale would pay a scheduled in 2011; the tax relief provisions in the Ameri- higher share of their income in taxes than similar house- can Recovery and Reinvestment Act of 2009 (ARRA, holds pay today and a much larger share of households— Public Law 111-5) would expire as scheduled in 2010 or nearly half—would be subject to the AMT.2 2011; and the exemption amounts for the individual alternative minimum tax would remain as they were at The alternative fiscal scenario, by contrast, embodies sev- the beginning of 2010.1 The same assumptions were eral possible changes to current law that would continue incorporated in the Congressional Budget Office’s March certain tax policies that people have grown accustomed 2010 baseline projections. However, the estimates in this to—because those policies are in place now or were in report differ from those projections because they also place until recently. In particular, most tax cuts enacted reflect the tax increases included in recent health care under EGTRRA and JGTRRA, which are currently 1. In recent years, the Congress has enacted temporary increases in 2. The long-term revenue projections reflect the assumption that the AMT exemption amounts, but the last increase expired at the economic conditions are stable after 2020 and thus exclude the end of 2009. effects of rising taxes on people’s behavior. CBO
  • 66.
    52 THE LONG-TERM BUDGET OUTLOOK Figure 4-1. Total Revenues Under CBO’s Long-Term Budget Scenarios (Percentage of gross domestic product) 25 Actual Projected Extended-Baseline Scenario 20 Alternative Fiscal Scenario 15 10 5 0 2000 2005 2010 2015 2020 2025 2030 2035 Source: Congressional Budget Office. Note: The extended-baseline scenario adheres closely to current law, following CBO’s 10-year baseline budget projections through 2020 (with adjustments for the recently enacted health care legislation) and then extending the baseline concept for the rest of the long- term projection period. The alternative fiscal scenario incorporates several changes to current law that are widely expected to occur or that would modify some provisions that might be difficult to sustain for a long period. (For details, see Table 4-1.) scheduled to expire in 2011, are assumed to remain in so as to maintain total revenues at a constant share of place. Those extensions would apply primarily to middle- GDP. and low-income taxpayers; certain provisions applying to high-income taxpayers (married couples with adjusted As a result, revenues as a share of GDP after 2020 are gross income above $250,000 and singles with income roughly 1 percentage point higher under the alternative above $200,000) would not be extended. Also under this fiscal scenario than the average share observed over the scenario, the tax rates and effective exemption amounts past 40 years. Revenues as a share of GDP have moved for the estate and gift tax that were in effect during 2009 above or below that average between 1970 and 2010 but (and expired at the end of that year) are assumed to be typically return to somewhere near the average, suggest- reinstated, and tax relief from the AMT is assumed to be ing that changes in policy have offset other aspects of the extended. Versions of some of these changes, such as tax system that otherwise would have tended to increase those related to the alternative minimum tax, have regu- the revenue share over time. In the alternative fiscal larly been enacted in the past. Those and certain other scenario, CBO assumed that those sorts of policy changes changes assumed in the scenario—such as changes related would continue. to the 2001 and 2003 tax cuts—are widely expected to be made in some form over the next few years. If they are, Revenues as a share of GDP would increase from 15 per- they will receive special treatment under the new Statu- cent of GDP in 2010 to just over 19 percent in 2020 and tory Pay-As-You-Go Act of 2010 (Public Law 111-139). would remain constant at about 19 percent of GDP (See Box 1-1 on page 4 for details.) thereafter. Revenues projected under the alternative fiscal In constructing the alternative fiscal scenario, CBO pro- scenario are considerably lower than those estimated jected revenues through 2020 on the basis of those spe- under the extended-baseline scenario—by about cific policy assumptions; after 2020, the scenario is based 2 percent of GDP in 2020 and by about 4 percent of on the assumption that tax policy would evolve over time GDP in 2035. CBO
  • 67.
    CHAPTER FOUR THE LONG-TERM BUDGET OUTLOOK 53 Figure 4-2. Revenues, by Source, 1970 to 2009 (Percentage of gross domestic product) 25 20 Total 15 10 Individual Income Taxes 5 Social Insurance (Payroll) Taxes Corporate Income Taxes 0 1970 1973 1976 1979 1982 1985 1988 1991 1994 1997 2000 2003 2006 2009 Source: Congressional Budget Office. Revenues Over the Past 40 Years excise taxes have diminished in magnitude relative to Over the past 40 years, total federal revenues have ranged GDP as the general level of prices has risen. In contrast, from 14.8 percent to 20.6 percent of GDP, averaging in the absence of legislative reductions to individual 18.1 percent, with no evident trend over time (see income taxes, receipts from individual income taxes have Figure 4-2). During that period, however, the various tended to grow relative to GDP. That increase has sources of revenue have changed in importance. Individ- occurred because rising income tends to push people into ual income taxes, which account for about half of all reve- higher tax brackets. Before 1984, when none of the nues now, have varied between about 6 percent and parameters of the individual income tax were indexed for 10 percent of GDP. Social insurance taxes, which gener- inflation, inflation by itself caused an increase in revenues ate about one-third of total revenues now, have grown as a greater share of income was taxed at higher rates.3 from 4 percent to over 6 percent of GDP. (Those taxes Even after 1984, when many of the parameters of the tax consist primarily of payroll taxes credited to the Social system were first indexed for inflation, growth in real Security and Medicare Hospital Insurance Trust Funds.) income has caused a greater share of income to be taxed Corporate income taxes contribute less now than they did at higher rates (and not all of the parameters of the tax in earlier years: In 2009, they represented about 1 percent system are indexed for inflation, so rising prices have con- of GDP, down from 3 percent in 1970. Revenues from tinued to have some effect). other sources have varied between roughly 1 percent and 3 percent of GDP over the past 40 years. Tax revenues as a share of GDP have also varied over time as a result of legislative changes. In the past 40 years, law- Some of the variation in the composition of total tax makers have enacted at least a dozen pieces of legislation revenues has stemmed from the interaction between the that have raised or lowered revenues by at least 0.5 per- tax code and changes in the economy. For example, many cent of GDP per year. excise taxes are levied on the quantity of a good pur- chased (for instance, cents per gallon of gasoline) as 3. The parameters of the tax system are the amounts that define the opposed to a percentage of the price paid. Because those various tax brackets, the personal exemption and standard deduc- levies are not indexed for inflation, revenues derived from tion amounts, and tax rates. CBO
  • 68.
    54 THE LONG-TERM BUDGET OUTLOOK Table 4-1. Assumptions About Revenues Underlying CBO’s Long-Term Budget Scenarios Extended-Baseline Scenario Alternative Fiscal Scenario Individual Income Taxes As scheduled under current law Through 2020, tax cuts from EGTRRA and JGTRRA are extended (except for rate reductions that apply to high-income taxpayers) and AMT relief is extended; thereafter, individual income taxes are adjusted to keep total revenues constant as a share of GDPa Payroll Taxes As scheduled under current law As scheduled under current law Corporate Income Taxes As scheduled under current law through 2020; remaining As scheduled under current law through 2020; remaining constant as a share of GDP thereafter constant as a share of GDP thereafter Excise Taxes As scheduled under current law As scheduled under current law through 2020; remaining constant as a share of GDP thereafter Estate and Gift Taxes As scheduled under current law 2009 tax rates and exemption amount (adjusted for inflation) continue through 2020; revenues are constant as a share of GDP thereaftera Other Sources of Revenue As scheduled under current law through 2020; remaining As scheduled under current law through 2020; remaining constant as a share of GDP thereafter constant as a share of GDP thereafter Source: Congressional Budget Office. Notes: The extended-baseline scenario adheres closely to current law, following CBO’s 10-year baseline budget projections through 2020 (with adjustments for the recently enacted health care legislation) and then extending the baseline concept for the rest of the long- term projection period. The alternative fiscal scenario incorporates several changes to current law that are widely expected to occur or that would modify some provisions that might be difficult to sustain for a long period. For details, see Table 1-1. EGTRRA = Economic Growth and Tax Relief Reconciliation Act of 2001; JGTRRA = Jobs and Growth Tax Relief Reconciliation Act of 2003; AMT = alternative minimum tax; GDP = gross domestic product. a. These assumptions are consistent with extending through 2020 provisions that are the basis for “current-policy” adjustments specified in the Statutory Pay-As-You-Go Act of 2010—with the exception that the alternative fiscal scenario assumes that all of the policies would continue through 2020, whereas the act’s “current-policy” adjustments for the estate tax parameters and the AMT end after 2011 (see Box 1-1 on page 4). Revenue Projections Under CBO’s baseline, the scenario is based on the assumption that certain tax provisions will expire as scheduled and new Long-Term Budget Scenarios The extended-baseline scenario and the alternative fiscal provisions of law will go into effect as scheduled. The scenario embody two possible paths for revenues over specific assumptions are the following: future decades. CBO’s assumptions about particular revenue sources under the two scenarios are summarized B The tax provisions of the Economic Growth and Tax in Table 4-1. Relief Reconciliation Act of 2001, the Jobs and Growth Tax Relief Reconciliation Act of 2003, and The Extended-Baseline Scenario the American Recovery and Reinvestment Act of 2009 The extended-baseline scenario follows current law. That will expire as scheduled; scenario uses the 10-year baseline projections for revenues that CBO published in March 2010, after incorporating B The AMT exemption amounts in effect at the begin- the estimated effects of the recently enacted health care ning of 2010 will remain at those levels, and the legislation (which are unchanged from the estimates parameters of the AMT will not be indexed for CBO released in March). As was the case with the March inflation; and CBO
  • 69.
    CHAPTER FOUR THE LONG-TERM BUDGET OUTLOOK 55 Table 4-2. Sources of Growth in Total Revenues as a Share of GDP Between 2010 and 2035 Under CBO’s Extended-Baseline Scenario Percentage Source of Growth of GDP Impact of Economic Recovery on Individual Income Taxes 0.6 Expiring Individual Income Tax Provisions and the AMT 2.7 Other Structural Features of the Tax System (Including real bracket creep) 2.6 Demographic Trends 0.5 Health Care Legislation 1.2 Other Factors (Including corporate, excise, and estate and gift taxes) 0.8 ___ Total Growth in Revenues as a Share of GDP 8.4 Source: Congressional Budget Office. Notes: The extended-baseline scenario adheres closely to current law, following CBO’s 10-year baseline budget projections through 2020 (with adjustments for the recently enacted health care legislation) and then extending the baseline concept for the rest of the long- term projection period. The alternative fiscal scenario incorporates several changes to current law that are widely expected to occur or that would modify some provisions that might be difficult to sustain for a long period. (For details, see Table 4-1.) “Real bracket creep” refers to the phenomenon in which rising real (inflation-adjusted) income causes an ever-larger proportion of income to be subject to higher tax brackets. GDP = gross domestic product; AMT = alternative minimum tax. B Tax increases scheduled to go into effect in future EGTRRA and JGTRRA; the growing impact of the years as a result of recently enacted health care legisla- AMT; other structural features of the income tax system; tion will be implemented as specified in current law. and demographic trends. Total revenues will also increase Such increases include the new taxes on earnings and relative to GDP because of additional revenues from investment income (beginning in 2013) and the new other tax sources as a result of the recent health care legis- tax on employment-based health insurance plans with lation, the reinstatement of the estate tax after 2010, and high premiums (beginning in 2018). certain other factors. Under the extended-baseline scenario, current law would Economic Recovery. CBO projects that revenues will remain in place indefinitely after 2020, extending those grow faster than GDP in 2011 and 2012 as the economy baseline assumptions for the rest of the long-term projec- continues to recover, with most of that growth coming tion period. from individual income taxes. Certain sources of income that had been unusually low during the downturn (for Under those assumptions, tax revenues would sharply instance, capital gains realizations) are expected to recover increase in the next few years and then steadily rise there- and return to levels consistent with an economy slowly after relative to GDP. The individual income tax system moving closer to its long-term growth path. The effects of will be responsible for much of the increase in the ratio of the recovery will increase revenues from individual total revenues to GDP because of the various ways in income taxes as a share of GDP by 0.6 percentage points, which its structure interacts with the economy. Under the CBO estimates (see Table 4-2). extended-baseline scenario, individual income tax receipts would rise by about 6.5 percentage points of Expiring Tax Provisions and the AMT. Certain aspects of GDP between 2010 and 2035 and by a smaller amount current tax law will also cause an increase in individual over the remainder of the long-term forecast horizon. income tax revenues relative to GDP. Most of the provi- That increase in individual income tax revenues reflects a sions in EGTRRA and JGTRRA are scheduled to expire number of factors, including the anticipated economic after December 31, 2010, as are most of the tax provi- recovery; the expiration of tax-relief provisions in sions in ARRA. When that happens, certain features of CBO
  • 70.
    56 THE LONG-TERM BUDGET OUTLOOK Figure 4-3. Individual Income Tax Revenues Under CBO’s Extended-Baseline Scenario and Two Variants (Percentage of gross domestic product) 14 13 12 Extended-Baseline Scenario 11 Variant 1: EGTRRA and JGTRRA Extended 10 9 Variant 2: EGTRRA, JGTRRA, and AMT Relief Extended 8 7 6 0 2010 2015 2020 2025 2030 2035 Source: Congressional Budget Office. Notes: The extended-baseline scenario adheres closely to current law, following CBO’s 10-year baseline budget projections through 2020 (with adjustments for the recently enacted health care legislation) and then extending the baseline concept for the rest of the long- term projection period. (For details, see Table 4-1.) EGTRRA = Economic Growth and Tax Relief Reconciliation Act of 2001; JGTRRA = Jobs and Growth Tax Relief Reconciliation Act of 2003; AMT = alternative minimum tax. the tax code will revert to prior law: Tax rates will rise, the time, more taxpayers will be subject to the AMT and that value of some tax credits will decrease, other credits will tax will claim a larger share of GDP. expire, and thresholds for certain tax rates will change. Those changes will increase receipts as a share of GDP in The effects of the expiration of EGTRRA and JGTRRA 2011 and beyond. and of the growing reach of the AMT can be identified by comparing CBO’s projection of individual income tax Another factor that will increase revenues relative to GDP revenues under the extended-baseline scenario, which fol- is the growing impact of the AMT. The alternative mini- lows current law, with two alternatives. The first is based mum tax is a parallel individual income tax system that on the assumption that policymakers would deviate from provides fewer exemptions, deductions, and rates than current law by permanently extending the tax provisions the regular income tax. Households must calculate the of EGTRRA and JGTRRA but would not index the amount they owe under both the AMT and the AMT for inflation; the second reflects the assumption regular income tax and then pay the higher of the two that policymakers would extend those tax provisions and amounts.4 The parameters that determine the amount also index the AMT. owed under the AMT are not indexed for inflation. Relative to the extended-baseline scenario, extending Therefore, as inflation increases people’s income over EGTRRA and JGTRRA alone would lower individual income tax revenues—and thus total revenues—by 4. Technically, a taxpayer owes the regular income tax plus any 0.9 percent of GDP in 2012 and by 0.7 percent in 2035 amount that, under the AMT, exceeds the regular tax. For more information on the AMT, see Congressional Budget Office, (see Figure 4-3). That decline in revenues as a share of The Individual Alternative Minimum Tax, Issue Brief (January 15, GDP would lessen over time because of the growth of 2010). the AMT. As a greater share of individual income taxes CBO
  • 71.
    CHAPTER FOUR THE LONG-TERM BUDGET OUTLOOK 57 was paid through the AMT, the effect of extending benefit plans is not taxed when it is earned. As baby EGTRRA and JGTRRA would decline because many of boomers withdraw money from retirement accounts and the provisions of those laws do not benefit taxpayers who receive pension benefits, those sums will make up a rising are subject to the AMT. portion of taxable income. Thus, the Treasury will receive significant tax revenues that have essentially been deferred Relative to the extended-baseline scenario, extending the for years, which will tend to boost tax receipts relative to provisions of EGTRRA and JGTRRA and indexing the GDP. As a result, under the extended-baseline scenario, AMT for inflation would lower revenues from individual projected revenues as a share of GDP would climb by income taxes (and total revenues) by 1.4 percent of GDP about 0.5 percentage points between 2010 and 2035. in 2012 and by 2.7 percent in 2035. That effect would That upward trend would end in the mid-2030s, so increase over time as cumulative inflation caused more beyond that point, revenues from taxable withdrawals taxpayers to be subject to the AMT. would no longer grow faster than GDP. Other Structural Features of the Income Tax System. Effects of Recent Health Care Legislation. One key Even if the AMT was indexed for inflation and the tax provision of the legislation is an excise tax on high- provisions of EGTRRA and JGTRRA were made perma- premium health insurance plans. Under that provision, nent, individual income tax revenues would continue to employment-based plans with premiums exceeding a rise as a percentage of GDP. Most of the parameters of specified threshold will generally be subject to an excise the individual income tax apart from the AMT are tax of 40 percent. That tax, which will be levied on insur- indexed for inflation, which prevents average tax rates ers but most likely passed on to their customers, will from rising when incomes are increasing only with infla- increase revenues in two ways. First, in those cases in tion. Rising real incomes, however, cause an ever-larger which the tax applies, it will generate additional excise tax proportion of income to be subject to higher tax rates, a revenues. Second, many individuals and employers will phenomenon known as “real bracket creep.” Rising real probably respond to the presence of the excise tax by incomes also increase taxes by reducing taxpayers’ eligibil- shifting to lower-cost insurance plans—plans with premi- ity for various credits, such as the earned income tax ums below the tax threshold—to avoid paying the excise credit and the child tax credit. In addition, some provi- tax. As a result, total payments of health insurance premi- sions of the tax code are not indexed for inflation, so ums for those individuals will be less than they would cumulative inflation would generate some increase in have been in the absence of the tax. Because, over the receipts relative to GDP. All told, even if the AMT was long term, total compensation paid by employers would indexed and the expiring tax provisions were extended, not be affected, lower expenditures for health insurance growth in people’s nominal income would increase would mean higher taxable wages for employees and, as a income tax revenues relative to GDP by 2.6 percentage result, higher payments for income and payroll taxes. points between 2010 and 2035, CBO estimates. Although the threshold for the tax on high-premium Demographic Trends. Over the next few decades, another health insurance plans is indexed for changes in overall factor will cause income tax revenues to increase as a share consumer prices, health care costs will grow faster than of GDP: the retirement of members of the baby-boom prices over the long term, CBO projects and, conse- generation. Although certain contributions to retirement quently, a greater share of premiums will be subject to the plans—such as 401(k) plans and individual retirement excise tax.6 Thus, in CBO’s estimation, whether policy- accounts—are tax-exempt when they are made, and the holders pay the excise tax through higher premiums or income earned on assets in those accounts is also exempt avoid it by switching to lower-cost plans, total taxes will from taxes, withdrawals from plans with deductible con- ultimately rise in comparison with what would have hap- tributions are subject to taxation.5 Likewise, compensa- pened in the absence of the new excise tax. Accordingly, tion that is deferred under employer-sponsored defined- CBO projects that the excise tax will increase revenues 5. Contributions to some 401(k) plans and individual retirement 6. The thresholds are initially set in statute for 2018 and are indexed accounts are not tax-deductible, but withdrawals from those to general inflation plus 1 percent for 2019 and to general infla- accounts are untaxed. tion for 2020 and subsequent years. CBO
  • 72.
    58 THE LONG-TERM BUDGET OUTLOOK by just over 0.5 percent of GDP in 2035 and eventually exempt from taxation will remain fixed at $1 million by over 3 percent of GDP in 2080. Because health care starting in 2011 and not be indexed for inflation there- spending so far into the future is highly uncertain, projec- after; as a result, a greater share of wealth would become tions at that horizon of the revenue loss from rising subject to the tax over time. Excluding the new excise tax health care costs and the revenue gain from the excise tax on high-premium health insurance plans, excise taxes are are particularly uncertain.7 projected to decline slightly as a share of GDP over time because many excise taxes are assessed as a fixed dollar Other provisions of the new health care legislation that amount per quantity of a good that is purchased and not will boost revenues as a share of GDP are additional taxes as a percentage of the price paid for that good. Therefore, on earnings and on investment income, which will be as the general price level rises over time, excise taxes tend assessed on individuals with income in excess of to fall as a share of GDP. On balance, CBO projects that $200,000 and on families with income in excess of in the absence of the excise tax on high-premium health $250,000. Those thresholds are not indexed for inflation. insurance plans, revenue derived from corporate income Because an increasing share of earnings and investment taxes, estate and gift taxes, federal excise taxes, and other income will become subject to the new surtaxes over miscellaneous receipts will rise by 0.8 percent of GDP time, CBO projects that the new levies will increase reve- between 2010 and 2035 and by a small amount after nues by a small but growing share of GDP over time. 2035. Other provisions of the health care legislation will also raise revenues by small amounts as a share of GDP. The Alternative Fiscal Scenario The alternative fiscal scenario is based on the assumption Under the extended-baseline scenario, CBO estimates, that certain tax policies that have recently expired, or that the recent health care legislation would raise revenues as a are scheduled to expire, will be extended through 2020, share of GDP by 0.5 percent in 2020, by 1.2 percent in and that tax policies will adjust so that revenues remain at 2035, and by increasing amounts thereafter. Increases in a constant share of GDP thereafter. Specifically: revenues from the recent legislation would offset a decline in revenues from rising health care costs. In CBO’s B Certain provisions of EGTRRA and JGTRRA are estimation, those costs would cause a growing portion assumed to be extended, including the $1,000 child of workers’ compensation to be paid as nontaxable health tax credit, marriage penalty relief, and lower tax rates insurance benefits, holding down both income and pay- for taxpayers with incomes under $250,000; roll tax revenues. B AMT relief, which expired at the end of 2009, is Other Factors Affecting Revenue Projections. In addition assumed to be extended; and to the factors already discussed, other factors would also B The estate tax, which expired completely in 2010 and affect the growth of federal revenues as a share of GDP is scheduled to be reinstated in 2011—at the rates and under the extended-baseline scenario. According to exemption amounts scheduled to apply in 2011 before CBO’s projections, corporate income tax revenues are the law was changed in 2001—is assumed instead to expected to rise as a share of GDP over the next 10 years, be extended at the rates in effect in 2009 and with the reflecting an anticipated rebound from a historically low exemption amounts (adjusted for inflation) that share of GDP in 2010 as the economy recovers from the applied in that year. recession. Estate and gift taxes are projected to increase as a share of GDP following the reinstatement of the estate Those changes are widely expected to be made in some tax after 2010. The dollar amount of an estate that is form over the next few years. If they are, they will receive special treatment under the new Statutory Pay-As-You- 7. While the incremental effect of the excise tax is uncertain, the Go Act of 2010. Under those assumptions, the growth in excise tax reduces uncertainty in the overall revenue forecast by revenues between 2010 and 2020 would amount to limiting the impact of untaxed health insurance benefits. Prior to the introduction of the excise tax, the size of the untaxed benefits about 4 percentage points, from 15 percent of GDP to depended upon the future path of health care spending. By limit- just over 19 percent of GDP—as compared with the ing the impact of the untaxed health benefits on the revenue base, 6 percentage-point increase projected under the the excise tax reduces that source of uncertainty. extended-baseline scenario. That projected growth in CBO
  • 73.
    CHAPTER FOUR THE LONG-TERM BUDGET OUTLOOK 59 receipts is largely attributable to several factors that also legislation).8 Under the extended-baseline scenario, the matter in the extended-baseline scenario: the anticipated impact of the legislation on the revenue share of GDP economic recovery over the next few years; the increase in would rise over time, CBO estimates, boosting revenues tax rates that would affect people in the highest income by about 1.2 percent of GDP in 2035 and by a larger brackets beginning in 2011; and the rise in estate, gift, amount after 2035; most of the increase that is projected and corporate taxes. to occur after 2035 is attributable to the excise tax on high-premium health insurance plans. In the alternative fiscal scenario, CBO assumed that after 2020 a series of changes in the tax code would be enacted Excluding the effects of health care legislation, CBO’s to offset certain factors that under the baseline scenario current long-term projection of revenues as a share of would increase revenues over time; as a result, revenues GDP under the extended-baseline scenario is close to its as a share of GDP would remain constant. The chief 2009 projection. On net, excluding the impact of that features of the current tax system that would cause reve- legislation, projected federal revenues under the scenario nues to rise are real bracket creep, unindexed tax parame- are 0.2 percentage points lower in 2020 and 0.4 percent- age points higher in 2035; after 2035, the difference ters, an increase in taxable withdrawals from retirement diminishes. The impact of changes in the long-term eco- accounts, and the long-run interaction of rising health nomic forecast on projected individual income taxes care expenditures and health care legislation. During the accounts for most of the change in 2035. Cumulative past 40 years, legislative changes have kept total revenues inflation is slightly higher by 2035 than was projected last between 15 percent and 21 percent of GDP, averaging year, which has the effect of increasing income tax reve- 18.1 percent of GDP over the period. Under this sce- nues relative to GDP. After 2035, cumulative inflation nario, revenues would remain at about 19 percent of remains slightly higher than was projected last year, but GDP in 2035, about 4 percentage points less than is pro- cumulative real income growth is projected to be slightly jected under the extended-baseline scenario. Revenues lower; the effects of those revisions on revenues are essen- would remain at about 19 percent of GDP through 2080 tially offset after 2035. under the alternative fiscal scenario, in contrast with their continued rise after 2035 under the extended-baseline In projecting the alternative fiscal scenario for this report, scenario. CBO departed somewhat from the method used for its June 2009 report. First, rather than basing the scenario on the assumption that individual income tax law in Changes in CBO’s Long-Term Revenue effect in 2009 would be extended permanently, CBO Projections Since June 2009 assumed that a narrower set of policies would be contin- Compared with last year’s estimates, the major change in ued in 2010 and beyond. Those policies are consistent CBO’s projection of revenues this year under the with the extension through 2020 of provisions that are extended-baseline scenario results from enactment of the the basis for “current-policy” adjustments specified in the health care legislation. The Patient Protection and Statutory Pay-As-You-Go Act.9 Second, and more signifi- Affordable Care Act, enacted in March 2010 and modi- cant over the longer term, CBO assumed in last year’s fied by the Health Care and Education Reconciliation report that policies in effect in 2009 would remain per- Act, includes a number of provisions that affect revenues. manently in place after 2020, whereas the assumption Most notable among those are additional taxes on earn- this year is that revenues (including those resulting from ings and investment income that will be imposed starting the recently enacted health care legislation) would remain in 2013 and the excise tax on high-premium health insur- ance plans that will go into effect in 2018. Those laws 8. See Congressional Budget Office, letter to the Honorable Nancy Pelosi about the budgetary effects of H.R. 4872, the Reconcilia- also impose new annual fees on health insurance provid- tion Act of 2010 (March 20, 2010). ers and on certain manufacturers and importers of certain drugs. Altogether, CBO and the staff of the Joint Com- 9. Although the Statutory Pay-As-You-Go Act of 2010 provides only for the temporary extension of the 2009 estate tax parameters and mittee on Taxation estimated that the legislation would alternative minimum tax relief through 2011, the alternative fiscal raise revenues by 0.5 percent of GDP in 2020 (as com- scenario assumes that both of those policies would continue pared with what would be the case in the absence of that through 2020. CBO
  • 74.
    60 THE LONG-TERM BUDGET OUTLOOK Figure 4-4. The Impact of the Alternative Minimum Tax on Individual Income Tax Liability Under CBO’s Extended-Baseline Scenario, 2009 to 2035 (By calendar year, in percent) 50 45 40 35 30 Share of Households 25 Affected by the AMT 20 Additional Liability Generated by the AMT as a 15 Share of Total Individual Revenues 10 5 0 2009 2014 2019 2024 2029 2034 Source: Congressional Budget Office. Notes: The shares of households and revenues rise in 2010 after the temporary increase in the AMT exemption expires. After 2010, the shares initially fall because taxes and the regular income tax rise with the expiration of certain provisions of the Economic Growth and Tax Relief Reconciliation Act of 2001 and the Jobs and Growth Tax Relief Reconciliation Act of 2003. The extended-baseline scenario adheres closely to current law, following CBO’s 10-year baseline budget projections through 2020 (with adjustments for the recently enacted health care legislation) and then extending the baseline concept for the rest of the long- term projection period. (For details, see Table 4-1.) AMT = alternative minimum tax. constant as a share of GDP after 2020. CBO did not sharply relative to income. Changes to the tax system specify the changes in law that would achieve a constant stemming from the expiration of EGTRRA and share of GDP after 2020. Excluding the effects of the JGTRRA would also boost tax rates. As a result of all of recently enacted health care legislation, the current pro- those changes, people at various points in the income jections of revenues as a share of GDP under the alterna- scale would pay a very different percentage of their tive fiscal scenario are 0.2 percentage points higher in income in taxes than people at the same points pay today. 2020 and 0.4 percentage points lower in 2035 than last year. The difference increases considerably after 2035 Under the alternative fiscal scenario, CBO assumed that because of the assumption in this year’s report that reve- unspecified policy adjustments would be made after 2020 nues remain constant as a share of GDP after 2020. to keep revenues constant as a share of GDP. A wide range of policy alternatives could result in that outcome, and the specific choices that might be made would have Implications of the Long-Term very different implications for the economy and for the Revenue Scenarios share of income paid in taxes by people at various income The tax systems that would be in place under the two sce- levels. narios would differ, in a variety of ways, from the current system. Under the extended-baseline scenario, inflation Impact of the AMT and income growth over many years would significantly If the parameters of the AMT remain unchanged, as change the characteristics of the tax system: Many more CBO assumed in the extended-baseline scenario, the taxpayers would pay the AMT, marginal and average tax alternative minimum tax would ultimately affect a signif- rates would rise, and the dollar value of some tax parame- icant share of taxpayers. Just 3 percent of households were ters would fall sharply in real terms and even more affected by the AMT in 2009—the most recent year in CBO
  • 75.
    CHAPTER FOUR THE LONG-TERM BUDGET OUTLOOK 61 Table 4-3. AMT rate by then). Therefore, the amount of additional tax liability under the AMT would decline as the amount Estimates of Effective Marginal of tax calculated under the regular tax rose. The AMT Tax Rates Under CBO’s Extended- would continue to apply to many taxpayers, but the addi- Baseline Scenario tional revenue attributable to it would diminish relative to GDP. (Percent) 2010 2025 2035 Marginal Tax Rates on Income from Marginal Tax Rate on Labor Income 29 35 38 Labor and Capital Marginal Tax Rate on Capital Income 13 16 16 Marginal tax rates on income from labor and capital would rise considerably under the extended-baseline Source: Congressional Budget Office. scenario. The increase in the marginal tax rate on labor Notes: The effective federal marginal tax rate on income from labor would reduce people’s incentive to work, and the increase is the share of the last dollar of earnings in the economy that in the marginal tax rate on capital would reduce their is taken by federal individual income and payroll taxes. The incentive to save. However, the reduction in earnings and effective federal marginal tax rate on income from capital is the share of the last dollar of such income that is taken by savings from higher taxes would create an incentive to federal individual and corporate income taxes. work and save more, if people wished to maintain the The extended-baseline scenario adheres closely to current same amount of after-tax income and savings. On net, law, following CBO’s 10-year baseline budget projections evidence suggests that the former effects typically prevail through 2020 (with adjustments for the recently enacted and thus that higher marginal tax rates would tend to health care legislation) and then extending the baseline discourage some economic activity. The effect of taxes on concept for the rest of the long-term projection period. the future path of economic output would depend not (For details, see Table 4-1.) only on those marginal tax rates but also on future budget which temporary higher exemption amounts were in deficits and the amount of debt the government holds effect. However, by 2011—with the expiration of AMT relative to the size of the economy. relief at the end of 2009 and the expiration at the end of CBO estimates that under the extended-baseline sce- 2010 of the income tax cuts enacted in EGTRRA and nario, the marginal tax rate on labor income would JGTRRA—the AMT would affect 9 percent of house- increase by about 6 percentage points between now and holds, CBO projects. By 2035, nearly half of the nation’s 2025, and by an additional 3 percentage points between households would be subject to the AMT. The AMT 2025 and 2035 (see Table 4-3). The increase between would also account for an increasing share of individual 2010 and 2025 includes the effects of the expiration of income tax liability over time. By 2035, roughly EGTRRA and JGTRRA after 2010, the introduction of 12 percent of individual income tax liability would be the additional tax on earnings over $250,000 that begins attributable to the AMT, compared with less than in 2013, and the impact of the excise tax on certain high- 4 percent in both 2009 and 2011 (see Figure 4-4). premium health insurance plans that takes effect in 2018. Because taxpayers’ liability under the AMT is calculated Marginal rates on labor would also rise between 2010 and as the excess amount over the regular tax owed, the 2025 and continue to rise between 2025 and 2035 AMT’s contribution to receipts is smaller than its contri- because of real bracket creep under the regular tax, the bution to the share of people affected by the tax. effects of the AMT on a rising number of taxpayers, and Under the extended-baseline scenario, both the share of the growing impact of both the additional tax on earnings households subject to the AMT and the share of total rev- and the excise tax on certain high-premium health insur- ance plans.10 enues attributable to it would continue to rise after 2035. Sometime around 2060, revenues generated by the AMT would level off as a share of GDP as real bracket creep 10. The additional tax on earnings applies to a greater share of labor income over time because the $250,000 threshold will not be caused a greater share of income to be subject to the top indexed for inflation. The excise tax on certain high-premium marginal rate under the regular income tax (whereas less plans affects a larger share of compensation over time because the bracket creep would occur under the AMT because most threshold for the tax rises with general prices, while health costs of the income under the AMT will be taxed at the top are rising at a faster rate. CBO
  • 76.
    62 THE LONG-TERM BUDGET OUTLOOK Because of the expiration of certain provisions of Without legislative changes, the proportion of taxpayers EGTRRA and JGTRRA, as well as the introduction of claiming the earned income tax credit would fall from the additional tax on investment income in excess of 15 percent this year to 10 percent in 2035 as growth in $250,000, the marginal tax rate on capital under the real income moved more taxpayers out of the eligibility extended-baseline scenario would rise by 3 percentage range for the credit. points between 2010 and 2025. Marginal rates on capital would remain roughly the same between 2025 and 2035 The fact that most tax parameters are not indexed for real because the impact of real bracket creep and the expand- income growth and that some are not even indexed for ing effects of the AMT would have little effect on the tax inflation has significant implications over the long term. rate on capital income. (The reason is that after 2025, a Under current rules for indexing tax parameters, individ- large share of capital income would already be taxed at ual income taxes as a share of income would grow by the top rate.) varying amounts for households at different points in the income scale. For example, a couple with two children, In constructing the alternative fiscal scenario, CBO did earning the median income of $94,900 in 2010 and fil- not make assumptions about any specific revenue policies ing a joint tax return, would pay about 3 percent of their after 2020. The marginal tax rates on capital and labor income in individual income taxes under the extended- would depend on the specific policies chosen to maintain baseline scenario (see Table 4-4).11 By 2035, under exist- revenues at a constant share of GDP. Therefore, CBO ing tax law, a similar couple with median income would could not analyze marginal tax rates under the alternative pay 13 percent of their income in individual income fiscal scenario. taxes, an increase of 10 percentage points. By compari- son, if the same couple earned four times the median Average Tax Rates on Typical Households income, the share of income that they would pay in indi- Over the coming decades, the cumulative effect of rising vidual income taxes would rise from 21 percent in 2010 prices will sharply reduce the value of some parameters of to 24 percent by 2035, an increase of 3 percentage points. the tax system that are not indexed for inflation. Under After 2035, income taxes as a share of income would con- the extended-baseline scenario, the estate tax exemption, tinue rising at both income levels—but again, by a greater which will be $1 million in 2011 under current law, proportion for the couple earning the median income. would be worth about $600,000 (in 2010 dollars) by Taxes as a share of income for households at various other 2035; the same is true for the amount of mortgage debt points in the income distribution would also be very dif- eligible for the mortgage interest deduction, which is also ferent than they are today. limited to $1 million in 2011 under current law. The portion of Social Security benefits subject to taxation Despite rising average tax rates, households in the future would increase from about 30 percent now to about would have higher after-tax income than similar house- 50 percent by 2035, because the thresholds for taxing holds at the same point in the income distribution have benefits are fixed in nominal terms. today because of growth in real income. For example, by 2035 under the extended-baseline scenario, real after-tax Even tax parameters that are indexed for inflation would income for the couple earning the median income would lose value relative to income over the long term. The cur- have grown by 35 percent since 2010, despite the increase rent $3,650 personal exemption would rise by almost in taxes as a share of income. The growth in pretax 70 percent by 2035 because it is indexed for inflation, income would more than offset the increase in taxes. but income per household is projected to more than double during that period, so the value of the exemption 11. The examples assume all income received by taxpayers is compen- relative to income would decline by about 30 percent. sation. For details about the calculations, see Table 4-4. CBO
  • 77.
    CHAPTER FOUR THE LONG-TERM BUDGET OUTLOOK 63 Table 4-4. Individual Income and Payroll Taxes as a Share of Income Under CBO’s Extended-Baseline Scenario Taxes as a Share of Income Under the Extended-Baseline Scenario (Percent) Income Income Income and (2010 dollars) Taxes Payroll Taxes Taxpayer Filing a Single Return Half the Median Income 2010 16,700 -2 8 2035 25,500 4 13 Median Income 2010 33,400 5 18 2035 51,000 8 20 Twice the Median Income 2010 66,800 9 22 2035 102,100 14 27 Four Times the Median Income 2010 133,600 14 27 2035 204,300 21 33 Married Couple with Two Children Filing a Joint Return a Half the Median Income 2010 47,400 -11 -1 2035 72,600 4 14 Median Income 2010 94,900 3 15 2035 145,200 13 25 Twice the Median Income 2010 189,700 13 23 2035 290,300 20 30 Four Times the Median Income 2010 379,400 21 27 2035 580,700 24 30 Source: Congressional Budget Office based on data from the March 2009 Current Population Survey. Notes: All income is assumed to be from compensation, which includes employment-based health insurance and the employer’s share of payroll taxes. For 2035, the premium on employment-based health insurance is assumed to not exceed the excise tax threshold set forth in the Patient Protection and Affordable Care Act (Public Law 111-148), as amended by the Health Care and Education Reconciliation Act of 2010 (P 111-152). .L. Taxpayers are assumed to itemize if implied itemized deductions are greater than the standard deduction. State and local taxes are assumed to be 8 percent of wages; other deductions are assumed to be 14 percent of wages. The extended-baseline scenario adheres closely to current law, following CBO’s 10-year baseline budget projections through 2020 (with adjustments for the recently enacted health care legislation) and then extending the baseline concept for the rest of the long- term projection period. (For details, see Table 4-1.) a. The examples for the married couple assume that only one spouse earns income. CBO
  • 79.
    APPENDIX A Long-Term Projections Through 2080 T his appendix presents longer-term versions of several figures that appear in Chapters 1, 3, and 4 of this (noninterest) spending, total revenues, and debt held by the public through 2080 under the extended-baseline and report. The longer-term figures show the Congressional alternative fiscal scenarios. Budget Office’s projections of categories of primary CBO
  • 80.
    66 THE LONG-TERM BUDGET OUTLOOK Figure A-1. Revenues and Primary Spending, by Category, Under CBO’s Long-Term Budget Scenarios Through 2080 (Percentage of gross domestic product) Extended-Baseline Scenario 35 Actual Projected 30 Total Primary Spending Revenues 25 Other Noninterest 20 Spending 15 Medicare, Medicaid, 10 CHIP, and Exchange Subsidies 5 Social Security 0 1970 1980 1990 2000 2010 2020 2030 2040 2050 2060 2070 2080 Alternative Fiscal Scenario 35 Actual Projected 30 Total Primary Spending Revenues 25 Other Noninterest Spending 20 15 Medicare, Medicaid, 10 CHIP, and Exchange Subsidies 5 Social Security 0 1970 1980 1990 2000 2010 2020 2030 2040 2050 2060 2070 2080 Source: Congressional Budget Office. Notes: Primary spending refers to all spending other than interest payments on federal debt. The extended-baseline scenario adheres closely to current law, following CBO’s 10-year baseline budget projections through 2020 (with adjustments for the recently enacted health care legislation) and then extending the baseline concept for the rest of the long- term projection period. The alternative fiscal scenario incorporates several changes to current law that are widely expected to occur or that would modify some provisions that might be difficult to sustain for a long period. (For details, see Table 1-1 on page 3.) CHIP = Children’s Health Insurance Program. CBO
  • 81.
    APPENDIX A THE LONG-TERM BUDGET OUTLOOK 67 Figure A-2. Federal Debt Held by the Public Under CBO’s Long-Term Budget Scenarios Through 2080 (Percentage of gross domestic product) 200 Actual Projected 175 150 Alternative Fiscal Scenario 125 100 75 Extended-Baseline Scenario 50 25 0 1970 1980 1990 2000 2010 2020 2030 2040 2050 2060 2070 2080 Source: Congressional Budget Office. Note: The extended-baseline scenario adheres closely to current law, following CBO’s 10-year baseline budget projections through 2020 (with adjustments for the recently enacted health care legislation) and then extending the baseline concept for the rest of the long- term projection period. The alternative fiscal scenario incorporates several changes to current law that are widely expected to occur or that would modify some provisions that might be difficult to sustain for a long period. (For details, see Table 1-1 on page 3.) CBO
  • 82.
    68 THE LONG-TERM BUDGET OUTLOOK Figure A-3. Comparison of CBO’s 2009 and 2010 Budget Projections Under the Extended-Baseline Scenario Through 2080 (Percentage of gross domestic product) Revenues and Primary Spending 35 30 25 20 Spending Revenues 2009 Projection 2009 Projection 2010 Projection 2010 Projection 15 10 0 2010 2020 2030 2040 2050 2060 2070 2080 Federal Debt Held by the Public 200 175 150 2009 Projection 125 100 2010 Projection 75 50 25 0 2010 2020 2030 2040 2050 2060 2070 2080 Source: Congressional Budget Office. Notes: Primary spending refers to all spending other than interest payments on federal debt. The extended-baseline scenario adheres closely to current law, following CBO’s 10-year baseline budget projections through 2020 (with adjustments for the recently enacted health care legislation) and then extending the baseline concept for the rest of the long- term projection period. (For details, see Table 1-1 on page 3.) CBO
  • 83.
    APPENDIX A THE LONG-TERM BUDGET OUTLOOK 69 Figure A-4. Comparison of CBO’s 2009 and 2010 Budget Projections Under the Alternative Fiscal Scenario Through 2080 (Percentage of gross domestic product) Revenues and Primary Spending 35 30 25 20 15 Spending Revenues 2009 Projection 2009 Projection 2010 Projection 2010 Projection 10 0 2010 2020 2030 2040 2050 2060 2070 2080 Federal Debt Held by the Public 200 2010 Projection 175 150 125 2009 Projection 100 75 50 25 0 2010 2020 2030 2040 2050 2060 2070 2080 Source: Congressional Budget Office. Notes: Primary spending refers to all spending other than interest payments on federal debt. The alternative fiscal scenario incorporates several changes to current law that are widely expected to occur or that would modify some provisions that might be difficult to sustain for a long period. (For details, see Table 1-1 on page 3.) CBO
  • 84.
    70 THE LONG-TERM BUDGET OUTLOOK Figure A-5. Spending for Social Security Under CBO’s Long-Term Budget Scenarios Through 2080 (Percentage of gross domestic product) 7 Actual Projected 6 5 4 3 2 1 0 1970 1980 1990 2000 2010 2020 2030 2040 2050 2060 2070 2080 Source: Congressional Budget Office. Note: Projected spending for Social Security is identical under CBO’s two long-term budget scenarios. CBO
  • 85.
    APPENDIX A THE LONG-TERM BUDGET OUTLOOK 71 Figure A-6. Total Revenues Under CBO’s Long-Term Budget Scenarios Through 2080 (Percentage of gross domestic product) 35 Actual Projected Extended-Baseline Scenario 30 25 20 Alternative Fiscal Scenario 15 10 5 0 1970 1980 1990 2000 2010 2020 2030 2040 2050 2060 2070 2080 Source: Congressional Budget Office. Note: The extended-baseline scenario adheres closely to current law, following CBO’s 10-year baseline budget projections through 2020 (with adjustments for the recently enacted health care legislation) and then extending the baseline concept for the rest of the long- term projection period. The alternative fiscal scenario incorporates several changes to current law that are widely expected to occur or that would modify some provisions that might be difficult to sustain for a long period. (For details, see Table 1-1 on page 3.) CBO
  • 87.
    APPENDIX B Demographic and Economic Variables Underlying CBO’s Analysis T he Congressional Budget Office’s (CBO’s) long- term budget projections are based on projections for a constant real (inflation-adjusted) interest rate on federal debt and steady growth rates for real wages and gross host of variables that relate to demographic trends and domestic product (GDP). the performance of the U.S. economy. The values for demographic variables used in this analysis come from CBO projected values for rates of interest, inflation, and the most recent annual report of the Social Security unemployment directly. For growth rates of GDP and trustees.1 The values for long-term economic variables earnings, in contrast, CBO did not make direct projec- are based on CBO’s 10-year baseline projections as well as tions but instead derived values for those variables by on historical economic trends. Those demographic and using other economic and demographic assumptions. economic variables are discussed below. (The projections (Annual values for selected economic variables through for variables related to the growth in health care costs are 2084 can be found in the supplementary data for this discussed in Chapter 2.) report on CBO’s Web site, www.cbo.gov.) Projections of Interest Rates, Inflation, and Demographic Variables Unemployment After 2020 Future tax revenues, program spending, and economic CBO projected that after a 10-year phase-in from the performance will all be affected by the size and structure 2020 rate, the real interest rate on 10-year Treasury of the U.S. population. For its long-term budget projec- notes would be 3.0 percent through 2084. Because the tions, CBO adopted the intermediate (midrange) values average maturity of federal debt is expected to be less than in the 2009 report of the Social Security trustees for such 10 years, CBO projected that the effective interest rate on demographic variables as the total fertility rate, the rate of federal debt held by the public would be slightly lower, decline in mortality, levels of immigration and emigra- averaging 2.7 percent a year. CBO used the same 2.7 per- tion, and disability rates (specifically, the rates at which cent value as a discount rate for calculating the present people enter and leave Social Security’s Disability Insur- value of future streams of total revenues and outlays. The ance program). Social Security and Medicare trust funds hold longer- term debt, so the interest rates on those funds were Economic Variables assumed to be 3.0 percent a year. CBO used that value to The economic projections in this report for 2010 discount future streams of revenues and outlays for the through 2020 are consistent with those in CBO’s January Social Security and Medicare trust funds. 2010 economic forecast, which underlies the agency’s current 10-year baseline.2 For later years, CBO projected CBO also projected that annual inflation—as measured stable economic conditions after 2020—in particular, a by growth in both the consumer price index for urban wage earners and clerical workers (CPI-W) and the con- sumer price index for all urban consumers (CPI-U)— 1. Social Security Administration, The 2009 Annual Report of the Board of Trustees of the Federal Old-Age and Survivors Insurance and Federal Disability Insurance Trust Funds (May 12, 2009). The 2. See Congressional Budget Office, The Budget and Economic trustees have not yet released their 2010 report. Outlook: Fiscal Years 2010 to 2020 (January 2010), Chapter 2. CBO
  • 88.
    74 THE LONG-TERM BUDGET OUTLOOK would be 2.5 percent. The unemployment rate was pro- share to decrease. In the near term, however, that jected to decline to 5.0 percent and remain at that level effect is likely to be offset by people’s responses to the over the long run. new excise tax on employment-based health insurance plans with relatively high premiums, which is sched- Variables Underlying Projections of uled to take effect in 2018. At least initially, employers GDP and Earnings who would otherwise be subject to the tax are apt to CBO projected that from 2021 through 2084, real shift to less expensive health plans to avoid the tax, GDP would grow at an average rate of 2.0 percent a which will tend to increase the taxable share of com- year, and real earnings would grow at an average rate of pensation. (For more about the effects of the excise 1.3 percent. Those estimates were based on CBO’s demo- tax, see Chapter 4; for a discussion of trends in costs graphic assumptions and on four underlying economic for health care, see Chapter 2.) projections: B Average Hours Worked—CBO projected that the B Growth in Productivity—CBO projected that in the average number of hours worked by people in each long term, total factor productivity (average real out- demographic group would remain constant. However, put per unit of combined labor and capital services) different segments of the population work different would grow at an average annual rate of 1.3 percent. numbers of hours, on average. For example, men tend CBO incorporated that projection into an economic to work more hours than women, and people in their model that also uses projections of growth in the 30s tend to work more hours than people in their 50s. supply of labor and capital to compute the resulting As a result, CBO’s projection of total average hours growth in labor productivity (measured as growth in worked declines by 2 percent by 2080 because of pro- output per hour worked). The resulting projection for jected changes in the composition of the labor force. growth in labor productivity averages 1.6 percent a year. That figure differs from the average growth rate B Difference Between Inflation as Measured by the GDP for real earnings because labor productivity does not Deflator and by the CPI—The GDP deflator and the translate directly into earnings growth; the other fac- consumer price index are both used to gauge inflation. tors listed below also play a role. The GDP deflator measures the level of prices of all final goods and services produced. The CPI measures B Changes in the Ratio of Taxable Earnings to Total the level of consumer prices based on a typical market Compensation—The average growth rate of taxable basket of goods and services. Because of the difference earnings is affected by the share of compensation that in how the two measures are constructed, there is a workers receive as nontaxable benefits. That share in gap between the rates at which they grow. CBO turn is influenced by the growth of premiums for projected that the gap would average 0.3 percentage employment-based health insurance. CBO expects points a year over the long-term projection period. that private-sector costs for health care will grow more CBO uses the CPI to deflate earnings, because the quickly than compensation over the long-term projec- CPI is a measure of the change in the cost of living for tion period (with that difference gradually declining). consumers. Thus, the larger the gap between the That trend, by itself, would cause the nontaxable share growth rates of the GDP deflator and the CPI, the of compensation to increase over time and the taxable more that real earnings growth is reduced. CBO