From Boring to Interesting Charts
•Download as PPTX, PDF•
204 likes•17,774 views

It’s not as difficult as you might think to create interesting charts in PowerPoint. Here are a few tips to help convert boring charts to interesting charts.

Recommended
More Related Content
Viewers also liked
Viewers also liked (20)
More from SketchBubble
More from SketchBubble (20)
Recently uploaded
Recently uploaded (20)
From Boring to Interesting Charts
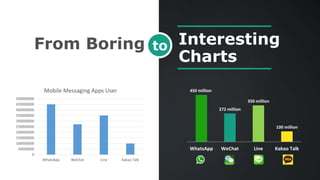
- 1. Interesting Charts toFrom Boring 450 million 272 million 350 million 100 million WhatsApp WeChat Line Kakao Talk 0 50000000 100000000 150000000 200000000 250000000 300000000 350000000 400000000 450000000 500000000 WhatsApp WeChat Line Kakao Talk Mobile Messaging Apps User
- 2. Improve the Readability of Your Graphs and Charts Bad visualization of graphs and charts is difficult for the audience to understand.
- 4. 0 50000000 100000000 150000000 200000000 250000000 300000000 350000000 400000000 450000000 500000000 WhatsApp WeChat Line Kakao Talk Mobile Messaging Apps User Create The Basic Default Chart
- 5. 450000000 272000000 350000000 100000000 WhatsApp WeChat Line Kakao Talk Mobile Messaging Apps User The Chart Is Too Crowded. Let’s Create A Simpler By Erasing The Grid And Better Number Placement
- 6. 450 million 272 million 350 million 100 million WhatsApp WeChat Line Kakao Talk Mobile Messaging Apps User (Monthly) Can You Read The Number And Text? I Don’t Think So, Please Make It Simpler And Bigger
- 7. 450 million 272 million 350 million 100 million WhatsApp WeChat Line Kakao Talk Mobile Messaging Apps User (Monthly) Now, Let’s Make It Colorful
- 8. 450 million 272 million 350 million 100 million WhatsApp WeChat Line Kakao Talk Mobile Messaging Apps User (Monthly)Wanna Add Some Related Icons?
- 9. Mobile Messaging Apps User (Monthly) 100 Million 350 Million 272 Million 450 Million Kakao Talk Line WeChat WhatsApp Try With Another Style Of Chart ?
- 10. 450 million 272 million 350 million 100 million WhatsApp WeChat Line Kakao Talk Mobile Messaging Apps User (Monthly)Try With Dark Background
- 11. 0% 5% 10% 15% 20% 25% 30% 16-24 25-34 35-49 50-59 60 and over Smoking People based on Age in Great Britain Lets Try With The New Way
- 12. 24% 26% 22% 18% 11% 16-24 25-34 35-49 50-59 60 and over Smoking People based on Age in Great Britain Erase The Grid And Better Number Placement
- 13. Smoking People based on Age in Great Britain 24% 26% 22% 18% 16-24 25-34 35-49 50-59 60 and over 11% Replace The Bar With Better Visualization
- 14. Smoking People based on Age in Great Britain 24% 26% 22% 18% 11% 16-24 25-34 35-49 50-59 60 and over Try With Dark Background
- 15. Age at Which Adults in England Started Smoking Regularly Under 16 16-17 18-19 20-24 25 and over Create The Basic Default Chart
- 16. Under 16 41% 16-17 26% 18-19 17% 20-24 11% 25 and over 5% Age at Which Adults in England Started Smoking Regularly Unite The Number And The Text To Make It Simpler
- 17. Age at Which Adults in England Started Smoking Regularly 41 % 26% 17% 11 % 5% Under 16 16-17 18-19 20-24 25 and over Let’s Play With Fonts
- 18. Age at Which Adults in England Started Smoking Regularly 41 % 26% 17% 11 % 5% Under 16 16-17 18-19 20-24 25 and over Delete Chart Border And Match The Color
- 19. Under 16 41% 16-17 26% 18-19 17%20-24 11% 25 and over 5% Age at Which Adults in England Started Smoking RegularlyTry With Another Pie Chart, May Be ?
- 20. 41 % 26% 17% 11 % 5% Under 16 16-17 18-19 20-24 25 and over Age at Which Adults in England Started Smoking Regularly Or With Another One?
- 21. 41 % 26% 17% 11 % 5% Under 16 16-17 18-19 20-24 25 and over Age at Which Adults in England Started Smoking Regularly Or With Another One?
- 22. PRACTICE MAKES PERFECT Thank you www.sketchbubble.com Lets Connect: Contact: support@sketchbubble.com