A wide variety of methods have been used to study forest structure parameters such as population density
1. THEORY
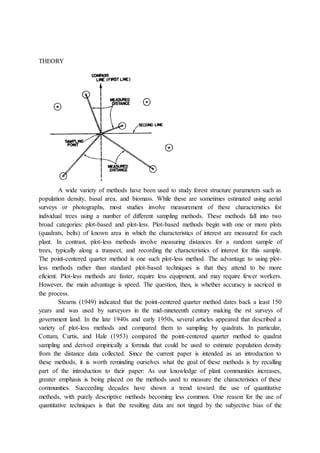
A wide variety of methods have been used to study forest structure parameters such as
population density, basal area, and biomass. While these are sometimes estimated using aerial
surveys or photographs, most studies involve measurement of these characteristics for
individual trees using a number of different sampling methods. These methods fall into two
broad categories: plot-based and plot-less. Plot-based methods begin with one or more plots
(quadrats, belts) of known area in which the characteristics of interest are measured for each
plant. In contrast, plot-less methods involve measuring distances for a random sample of
trees, typically along a transect, and recording the characteristics of interest for this sample.
The point-centered quarter method is one such plot-less method. The advantage to using plot-
less methods rather than standard plot-based techniques is that they attend to be more
eficient. Plot-less methods are faster, require less equipment, and may require fewer workers.
However, the main advantage is speed. The question, then, is whether accuracy is sacriced in
the process.
Stearns (1949) indicated that the point-centered quarter method dates back a least 150
years and was used by surveyors in the mid-nineteenth century making the rst surveys of
government land. In the late 1940s and early 1950s, several articles appeared that described a
variety of plot-less methods and compared them to sampling by quadrats. In particular,
Cottam, Curtis, and Hale (1953) compared the point-centered quarter method to quadrat
sampling and derived empirically a formula that could be used to estimate population density
from the distance data collected. Since the current paper is intended as an introduction to
these methods, it is worth reminding ourselves what the goal of these methods is by recalling
part of the introduction to their paper: As our knowledge of plant communities increases,
greater emphasis is being placed on the methods used to measure the characteristics of these
communities. Succeeding decades have shown a trend toward the use of quantitative
methods, with purely descriptive methods becoming less common. One reason for the use of
quantitative techniques is that the resulting data are not tinged by the subjective bias of the
2. investigator. The results are presumed to represent the vegetation as it actually exists; any
other investigator should be able to employ the same methods in the same communities and
secure approximately the same data.
Under the assumption that trees are distributed randomly throughout the survey site,
Morisita (1954) provided a mathematical proof for the formula that Cottam, Curtis, and Hale
(1953) had derived empirically for the estimation of population density using the point-
centered quarter method. In other words, the point-centered quarter method could, in fact, be
used to obtain accurate estimates of population densities with the advantage that the point-
centered quarter method data could be collected more quickly than quadrat data.
Subsequently, Cottam and Curtis (1956) provided a more detailed comparison of the point-
centered quarter method and three other plot-less methods (the closest individual, the nearest
neighbor, and the random pairs methods). Their conclusion was:
- The quarter method gives the least variable results for distance determinations,
provides more data per sampling point, and is the least susceptible to subjective bias..
. .
- It is the opinion of the authors that the quarter method is, in most respects, superior to
the other distance methods studied, and its use is recommended.
Beasom and Haucke (1975) compared the same four plotless methods and also
concluded that pointcentered quarter method provides the most accurate estimate of density.
In a comparison of a more diverse set of methods (Engeman et al. 1994) have a more nuanced
opinion of whether the point-centered quarter method is more eficient in the eld and more
accurate in its density estimates, especially in situations where individuals are not distributed
randomly.
In recent years, as the point-centered quarter method has been used more widely,
variations have been proposed by Dahdouh-Guebas and Koedam (2006) to address a number
of practical problems that arise in the eld (multi-stem trees, quarters where no trees are
immediately present).
One use of the point-centered quarter method is to determine the relative importance
of the various tree species in a community. The term importance" can mean many things
depending on the context. An obvious factor in uencing the importance of a species to a
community is the number of trees present of that species. However, the importance of some
number of small trees is not the same as the importance of the same number of large trees. So
the size of the trees also plays a role. Further, how the trees are distributed throughout the
community also has an e ect. A number of trees of the same species clumped together should
have a di erent importance value than the same number of trees distributed more evenly
throughout the community. Measuring importance can aid understanding the successional
stages of a forest habitat. At di erent stages, different species of trees will dominate.
Importance values are one objective way of measuring this dominance.
3. Observation Data
Data Analysis
Tree’s tallof Plot 1
Kuadran 1
Point
Samplin
g
Quarte
numbe
r
Distanc
e (cm)
Plant names Tree’s
diamete
r
Aroun
d the
tree
(cm)
α,
distance
of
observe
r
Tree’s
tall
(cm)
1 1
2
4
265
190
-
Araucaria heteropylla
Artocarpusheteropyll
us
-
14,65
10,19
-
46
32
-
42o,
268 cm
45o,
1,25 m
-
761,1
2.171,
7
-
2 1
2
4
230
-
-
Albiziachinensis
-
-
31,85
-
-
100
-
-
600,
1,35 m
-
-
579,1
-
-
3 1
2
4
-
286
-
-
Albiziachinensis
-
-
19,43
-
-
61
-
-
45o,
960 cm
-
-
1.701,
9
-
4 - - - - - - -
5 - - - - - - -
Amount 971
4. T = (tanα.x) + t
= (tan 42.268) + 147
= 761,1 cm
= 7,611 m
Kuadran 2
T = (tanα.x) + t
= (tan 45.1250) + 147
= 2.171,7 cm
= 21,717 m
Tree’s tall of plot 2
Kuadran 1
T = (tanα.x) + t
= (tan 60.1350) + 147
= 579,1 cm
= 57,91 m
Tree’s tall of plot 3
Kuadran 2
T = (tanα.x) + t
= (tan 45.960) + 147
= 1.701,9 cm
= 17,019 m
Basal area
BA = ¼ πd2
- Plot 1
Kuadran 1
BA = ¼ πd2
= ¼ . 3,14 . 14,652
= 168,5
5. Kuadran 2
BA = ¼ πd2
= ¼ . 3,14 . 10,192
= 81,5
- Plot 2
Kuadran 1
BA = ¼ πd2
= ¼ . 3,14 . 31,852
= 796,3
- Plot 3
Kuadran 2
BA = ¼ πd2
= ¼ . 3,14 . 19,432
= 296,4
Total BA = 1.342,7
Average of distance
Average of distance =
𝑎𝑚𝑜𝑢𝑛𝑡 𝑜𝑓 𝑡𝑜𝑡𝑎𝑙 𝑑𝑖𝑠𝑡𝑎𝑛𝑐𝑒
𝑎𝑚𝑜𝑢𝑛𝑡 𝑜𝑓 𝑖𝑛𝑑𝑖𝑣𝑖𝑑𝑢𝑎𝑙
=
971
4
= 242,75
Absolute density
Absolute density = basal area x (average of distance)
= 1.342,7 x 242,75
= 325.940,425
Amount of trees each 100 m2 = 100 / average of distance2
= 100 / 242,752
= 100 / 58.927,6
= 0,001696998
6. 1. Calculate the density
Absolute density
Plant species Amount Amount of trees each 100
m2
Araucaria heteropylla 0,25 0,0004242495
Artocarpusheteropyllus 0,25 0,0004242495
Albiziachinensis 0,5 0,000848499
Total 0,001696998
Relative density
Araucaria heteropylla (0,0004242495/0,001696998)
x 100
25
Artocarpusheteropyllus (0,0004242495/0,001696998)
x 100
25
Albiziachinensis (0,000848499/0,001696998)
x 100
50
Total 100
2. Calculate the dominance
Araucaria heteropylla Artocarpusheteropyllus Albiziachinensis
D of tree BA D of tree BA D of tree BA
14,65 168,5 10,19 81,5 19,43 296,4
31,85 796,3
Total of
BA
168,5 877,8 296,4
Average
of BA
168,5 438,9 296,4
Calculate the dominance of plants type
Absolute dominance
7. Araucaria heteropylla 168,5 x 0,0004242495 0,07148604
Artocarpusheteropyllus 438,9 x 0,0004242495 0,18620311
Albiziachinensis 296,4 x 0,000848499 0,2514951
Total 0,50918425
Relative dominance
Araucaria heteropylla (0,07148604/0,50918425
) x 100
14,039327
Artocarpusheteropyllus (0,18620311/0,50918425
) x 100
36,568906
Albiziachinensis (0,2514951/0,50918425 )
x 100
49,391767
Total 100
3. Calculate the frequency
Absolute frequency
Araucaria heteropylla ( 1/5 ) x 100 20
Artocarpusheteropyllus ( 1/5 ) x 100 20
Albiziachinensis ( 2/5 ) x 100 40
Total 80
Relative frequency
Araucaria heteropylla ( 20/ 80 ) x 100 25
Artocarpusheteropyllus ( 20/ 80) x 100 25
Albiziachinensis ( 40/ 80) x 100 50
Total 100
4. Calculate the importance value index
Importance value index ofeach plant species
Plants species Relative
density
Relative
frequency
Relative
dominance
INP Ranking
Araucaria heteropylla 25 25 14,039327 64,039327 3
Artocarpusheteropyllus 25 25 36,568906 86,568906 2
8. Albiziachinensis 50 50 49,391767 149,391767 1
From the result of vegetation analysis with PCQ method (Point Centered
Quarter), is known that havethe order of plant speciesthat dominanceare : (1)
Albiziachinensis, (2) Artocarpusheteropyllus, (3) Araucaria heteropylla.
DISCUSSION
From the analysis of vegetation on the table of tree species that are most
numerous in the area of research is the kind Albiziachinensis. A. chinensis Occurs
naturally in India, Myanmar, Thailand, Indo-China, China, Java and the Lesser Sunda
Islands (Bali and Nusa Tenggara). It is a native of mixed deciduous forest in tropical
and subtropical humid monsoon Climates with annual rainfall varying from 1000-
5000 mm. It Occurs in secondary forest, along river banks, and in savannas up to
1800 m altitude. Light frost is tolerated. Sengon found naturally in the forest whole
leaf mixture in the humid and temperate, with rainfall between 1,000-5,000 mm per
year. This tree is found also in secondary forests, along the banks of the river, and on
the savanna, up to an altitude of 1,800 m above sea level. Sengon adapt well in poor
soils, high pH, or containing salt; also grows well in alluvial lateritic soil and sandy
soil of ex-mine.
Based on the calculations, showing that Albiziachinensis have a high presence
in each plot as compared to other species. Relative density was biggest with the kind
Albiziachinensis with a score of 50%. This value indicates that Albiziachinensis high
densities compared to species that exist in the largest DR than other trees. Relative
dominance Albiziachinensis with a value of 49.4%. This value indicates a large
canopy closure compared to other species. Likewise views of Importance Value Index
(IVI), Albiziachinensis has an important role in comparison with other plants because
it has an important value of the total of 149.391767. The high value of IVI also
showed that these species were able to adjust to a better environment. If the views of
forest functions as a provider of oxygen, should in the Malabar forests to be more in
tree species than other crops. Because of similar trees can produce oxygen
Albiziachinensis higher than with other plants that have a smaller stature.
This may indicate that Albiziachinensis tree can thrive and grow well in this
environment. Thus the method centered quartener point can be seen that the plant is a
plant Albiziachinensis dominant and has the highest significant value compared to
other plants so that it can be used as a benchmark in the naming of a vegetation.
9. The density of trees can be affected by several factors that led to a lot of the small
number of individuals who appear in the observation area of forest in Malabar.
These factors include the factors of soil pH, light intensity, temperature,
humidity, altitude and humidity. All these factors are very influential in the growth
and development of a species. Factors that is what determines which species can
survive in the environment created conditions of the abiotic factors. From the data
listed factors indicate that the ambient temperature is not too hot and not too cold for
plant growth. The acidity of the soil near neutral, so that your metabolism can be done
by the plant is progressing well. This should be a supporting factor that makes plant
growth fertility, which then affects the density of trees.
CONCLUSION
The conclusions that can be drawn from this study are:
1. The composition of tree species, are: (1) Albiziachinensis, (2) Artocarpusheteropyllus,
(3) Araucaria tree heteropylla with a mean distance of 242.75 meters.
2. The importance of vegetation in forests Malabar at the highest level of the tree is a
tree Albiziachinensis at 149.391767. The high value of IVI also showed that these
species can adapt to the surrounding environment better than other types. Meanwhile,
IVI lowest of tree species Araucaria heteropylla amounting to 64.039327.
Beasom, Samuel L. and Harry H. Haucke. 1975. A comparison of four distance sampling techniques
in South Texas live oak mottes. J. Range Management. 28: 142{144.
Cottam, Grant and J. T. Curtis. 1956. The use of distance measures in phytosociological sampling.
Ecology. 37: 451{460.
Dahdouh-Guebas, Farid and Nico Koedam. 2006. Empirical estimate of the reliability of the use of the
Point-Centred Quarter Method (PCQM): Solutions to ambiguous _eld situations and description
of the PCQM+ protocol. Forest Ecology and Management. 228: 1{18. Available at: www.vub.ac.
be/APNA/staff/FDG/pub/Dahdouh-Guebas&Koedam_2006_ForestEcolManage.pdf
Morisita, Masaaki. 1954. Estimation of population density by spacing method. Memoirs Fac. Sci.
Kyushu Univ. Ser. E. 1: 187{197.
Morisita, Masaaki. 1957. A new method for the estimation of density by spacing method applicable
to nonrandomly distributed populations. Physiology and Ecology 7: 134{144. (In Japanese with
English summary.)
Stearns, Forest. 1949. Ninety years change in a northern hardwood forest in Wisconsin. Ecology. 30:
350{358.