
Recommended
Recommended
More Related Content
Similar to AJAResearch ArticleA Comparison of Personal SoundAmp.docx
Similar to AJAResearch ArticleA Comparison of Personal SoundAmp.docx (20)
More from simonlbentley59018
More from simonlbentley59018 (20)
Recently uploaded
Recently uploaded (20)
AJAResearch ArticleA Comparison of Personal SoundAmp.docx
- 1. AJA Research Article A Comparison of Personal Sound Amplification Products and Hearing Aids in Ecologically Relevant Test Environments Lisa Brody,a Yu-Hsiang Wu,a and Elizabeth Stangla Purpose: The aim of this study was to compare the benefit of self-adjusted personal sound amplification products (PSAPs) to audiologist-fitted hearing aids based on speech recognition, listening effort, and sound quality in ecologically relevant test conditions to estimate real-world effectiveness. Method: Twenty-five older adults with bilateral mild-to- moderate hearing loss completed the single-blinded, crossover study. Participants underwent aided testing using 3 PSAPs and a traditional hearing aid, as well as unaided testing. PSAPs were adjusted based on participant preference, whereas the hearing aid was configured using best-practice verification protocols. Audibility provided by the devices was quantified using the Speech Intelligibility Index (American National Standards Institute, 2012). Outcome measures assessing speech recognition, listening effort, and sound quality were administered in ecologically relevant laboratory conditions designed to represent real-world speech listening situations.
- 2. Results: All devices significantly improved Speech Intelligibility Index compared to unaided listening, with the hearing aid providing more audibility than all PSAPs. Results further revealed that, in general, the hearing aid improved speech recognition performance and reduced listening effort significantly more than all PSAPs. Few differences in sound quality were observed between devices. All PSAPs improved speech recognition and listening effort compared to unaided testing. Conclusions: Hearing aids fitted using best-practice verification protocols were capable of providing more aided audibility, better speech recognition performance, and lower listening effort compared to the PSAPs tested in the current study. Differences in sound quality between the devices were minimal. However, because all PSAPs tested in the study significantly improved participants’ speech recognition performance and reduced listening effort compared to unaided listening, PSAPs could serve as a budget-friendly option for those who cannot afford traditional amplification. H earing loss affects more than 37 million adults in America (National Institute on Deafness and Other Communication Disorders, 2016). Accord- ing to a survey of American adults, only about 30% of those with hearing difficulties own hearing aids (Abrams & Kihm, 2015), though treatments such as amplification have been shown to reduce negative consequences of living with untreated hearing loss (Hougaard, Ruf, Egger, & Abrams, 2016; Mulrow et al., 1990). One primary reason for the low uptake of hearing aids is their high cost (Abrams & Kihm, 2015; Kochkin, 2007). The average pair of hear- ing aids costs approximately $4,700 (President’s Council of Advisors on Science and Technology, 2015), which can im-
- 3. pose a financial burden on many individuals who might benefit from amplification and is the reason many adults live with untreated hearing loss. The increasing cost of tra- ditional hearing health care services has created a market opportunity for many nonregulated, yet more affordable, devices, commonly called personal sound amplification products (PSAPs). At the time this project was developed, a PSAP was defined as a device “intended to amplify environmental sound for non–hearing-impaired consumers” (U.S. Food and Drug Administration, 2013). This specific category of amplification is separate from traditional hearing aids, as PSAPs are not meant to be used to compensate for hearing aDepartment of Communication Sciences and Disorders, University of Iowa, Iowa City Correspondence to Yu-Hsiang Wu: [email protected] Editor-in-Chief: Sumitrajit (Sumit) Dhar Editor: Ryan McCreery Received February 2, 2018 Revision received April 5, 2018 Accepted June 13, 2018 https://doi.org/10.1044/2018_AJA-18-0027 Disclosure: The authors have declared that no competing interests existed at the time of publication. American Journal of Audiology • Vol. 27 • 581–593 • December 2018 • Copyright © 2018 American Speech-Language-Hearing Association 581
- 4. https://doi.org/10.1044/2018_AJA-18-0027 loss and are therefore not regulated as a medical device by the Food and Drug Administration. Because PSAPs are intended to be sold directly to consumers, they can be con- sidered a type of over-the-counter (OTC) amplification device. Because of their significantly lower cost, PSAPs find their place among consumers who report some diffi- culty in hearing but are not yet willing to spend thousands of dollars on audiologist-fitted hearing aids. PSAPs typi- cally look like traditional hearing aids, both behind-the- ear and in-the-ear styles, whereas some resemble ear-level Bluetooth devices. PSAPs cost between $25 and $500 (President’s Council of Advisors on Science and Technol- ogy, 2015). Although PSAPs are not meant for those with hear- ing loss, it was found that 1.5 million people with hearing impairments use either a PSAP or OTC device to compen- sate for their communication difficulties (Kochkin, 2010). Among a group of surveyed Americans who reported hear- ing difficulties, 9.4% reported owning a PSAP (Abrams & Kihm, 2015). Kochkin (2010) found that approximately 72% of those who reportedly used PSAPs had hearing loss configurations similar to those of patients who used audiologist-fitted hearing aids. Overall, the demography of those who purchased PSAPs was similar to those who purchased audiologist-fitted hearing aids in terms of age, employment, and education (Kochkin, 2010). A few sig- nificant differences between the groups were observed by Kochkin (2010). Specifically, PSAP users earned, on aver- age, $10,000 less per year than those using audiologist-fitted hearing aids and were less likely to pursue bilateral amplifi- cation. In addition, PSAP users, on average, wore their devices for only 3 hr a day compared to the average 10 hr
- 5. of use per day reported by hearing aid owners. Lastly, male individuals were reportedly more likely to purchase PSAPs compared to female individuals, whereas in the audiologist- fitted hearing aid market, the gender breakdown was more equal. Earlier studies have reported that many OTC devices provided unsuitable levels of low-frequency gain with in- sufficient high-frequency gain (Callaway & Punch, 2008; Chan & McPherson, 2015; Cheng & McPherson, 2000; Reed, Betz, Lin, & Mamo, 2017; Smith, Wilber, & Cavitt, 2016). For example, Chan and McPherson (2015) reported that the majority of the evaluated OTC devices in their study demonstrated linear input–output characteristics, peak clipping, high levels of equivalent input noise, and lit- tle usable high-frequency gain. Research further indicated that many PSAPs or OTC devices had gain frequency re- sponses that were most appropriate for rising hearing losses due to a greater low-frequency emphasis (Chan & McPherson, 2015; Cheng & McPherson, 2000). However, recent research suggested that modern PSAPs could be an appropriate solution for those with mild-to-moderate hearing loss. For example, Smith et al. (2016) examined the ability of PSAPs to match prescriptive targets for 10 hypothetical audio- grams of varying severity and found that certain higher-end PSAPs could be appropriately fit to an individual with up to a moderate degree of hearing loss. Reed, Betz, Lin, et al. (2017) found that several high-end PSAPs tested had elec- troacoustic characteristics within the tolerances used to assess hearing aid function for frequency range, equivalent input noise, maximum output, and total harmonic distor- tion measures. Previous research has also investigated the effect of PSAPs on patient outcomes in the laboratory. For exam-
- 6. ple, Xu, Johnson, Cox, and Breitbart (2015) compared the perceived sound quality of PSAPs relative to hearing aids. Results showed a significant preference for hearing aids over PSAPs only when listening to quiet conversation. No differences in sound quality were observed between any de- vices for everyday noises or music listening. More recently, Reed, Betz, Kendig, Korczak, and Lin (2017) compared five PSAPs with a traditional hearing aid. Results in speech recognition performance in noise indicated that three of the five PSAPs performed within 5 percentage points of the hearing aid. Research investigating the real-world benefit of PSAPs and OTC devices is limited. Humes et al. (2017) compared a direct-to-consumer service delivery model, which could be used to dispense OTC devices to an audiologist-based hearing aid service delivery model. The direct-to-consumer delivery model was shown to be efficacious, yielding out- comes similar to the traditional audiologist-based model. However, high-end hearing aids, rather than PSAPs or OTC devices, were used by Humes et al. Recently, Acosta, Hines, and Johnson (2018) conducted a double-blinded ran- domized control field trial to evaluate the effect of self-fitted OTC devices relative to audiologist-fitted hearing aids. Outcomes in speech communication and sound aversiveness were measured 1 week posttrial using the Abbreviated Profile of Hearing Aid Benefit (Cox & Alexander, 1995). Results indicated that, although the mean benefit score in speech communication of OTC devices was higher (better) than that of hearing aids (Cohen’s d = 0.54), hearing aids had a higher (better) benefit score in aversiveness than OTC devices (Cohen’s d = 0.78). However, likely due to the small sample size of the trial (total n = 17), none of the effects were statistically significant. Not only is the effect of PSAPs and OTC devices in
- 7. the real world unclear (for the reasons mentioned above), there are also gaps in the literature regarding the benefit of these devices relative to traditional hearing aids in well- controlled laboratory environments. For example, in the study by Xu et al. (2015) that compared the sound quality of PSAPs and hearing aids, stimuli were prerecorded by placing the devices on a manikin’s ear. Furthermore, the hearing aids used to record stimuli were not configured to compensate for each participant’s hearing loss. Therefore, it is unclear if the results of Xu et al. (2015) could general- ize to PSAPs and hearing aids used in the real world. In the study by Reed, Betz, Kendig, et al. (2017), speech recog- nition testing was conducted with research participants wearing the PSAPs adjusted using best-practice verification protocols by an audiologist, rather than by the participants themselves. The unrealistic PSAP fitting scheme used by Reed, Betz, Kendig, et al. (2017) could limit the generalizability of 582 American Journal of Audiology • Vol. 27 • 581–593 • December 2018 the study. Specifically, two PSAPs used by Reed, Betz, Kendig, et al. (2017) had smartphone application soft- ware (app) that allowed users to fine-tune the gain frequency response of the device. Previous research has shown that audiologist-driven hearing aid fine-tuning yielded better outcomes than patient-driven fine-tuning (Boymans & Dreschler, 2012). Thus, it is unclear if the PSAPs would still yield similar outcomes compared to audiologist-fitted hearing aids if the PSAPs were configured by the users. Furthermore, Reed, Betz, Kendig, et al. (2017) did not spec- ify if the device’s volume control was available to partici- pants during testing. Hence, it is also unclear how users would select the volume levels for PSAPs and how this
- 8. would affect differences in outcomes between PSAPs and traditional hearing aids. To fill gaps in the literature, the purpose of the cur- rent study was to examine the effect of PSAPs on speech recognition, listening effort, and sound quality compared to audiologist-fitted hearing aids using relatively realistic settings in the laboratory. Specifically, participants were responsible for selecting their preferred settings in an effort to simulate the real-world self-fitting process of many PSAPs on the market. In addition, outcome measures in the current study were administered using test conditions that represent real-world listening situations (i.e., ecologi- cally relevant). It is well established that the effect of certain hearing aid features, such as directional microphones, highly depends on the characteristics of listening situations (e.g., the locations of speech and noise) (Ricketts, 2000). Because directional microphones are available in many modern PSAPs, outcomes measured in ecologically rele- vant conditions could be more generalizable to the real world. Method Participants Twenty-five adults (12 men and 13 women) were recruited from the community and completed the study. Participants were eligible for inclusion in the study based on the following criteria: (a) bilateral mild-to-moderate sen- sorineural hearing loss, (b) a maximum threshold of 75 dB HL up to 4000 Hz, (c) hearing threshold symmetry within 15 dB up to 4000 Hz, and (d) the ability to understand the di- rections of the experiment and perform experiment-related tasks. The mean pure-tone thresholds are shown in Figure 1. Participants ranged in age from 56 to 81 years, with a mean of 69.6 years (SD = 8.2). All but one participant were ex-
- 9. perienced hearing aid users, with the mean years of use be- ing 8.4 years (SD = 9.7). Amplification Devices and Fitting A traditional hearing aid and three PSAPs were used in the current study. The traditional hearing aid was a ReSound LiNX2 5, denoted as the HA. The HA was a midlevel, behind-the-ear, receiver-in-the-canal device equipped with wide dynamic range compression (nine channels), adaptive directional microphones, digital noise reduction algorithms, and a smartphone app for volume adjustment. The three PSAPs used were a Sound World Solution s CS50+, a FocusEar RS2, and a Tweak Focus, denoted as PSAP1, PSAP2, and PSAP3, respectively. The PSAPs were all behind-the-ear slim-tube style. The prices of PSAP1, PSAP2, and PSAP3 were $349, $399, and $299 (per device), respectively. The PSAPs were chosen to rep- resent midlevel to high-end PSAPs. All PSAPs had direc- tional microphones and noise reduction features. PSAP1 had a corresponding smartphone app that allows users to adjust the device’s volume and frequency response. Users could also use the three-channel equalizer feature (bass, mid, and treble) of the app to adjust the shape of the fre-
- 10. quency response of PSAP1. All devices were fitted bilaterally. The HA was fitted by an audiologist using real-ear measurements matched to National Acoustics Laboratory (NAL-NL2; Keidser, Dillon, Flax, Ching, & Brewer, 2011) nonlinear prescrip- tive targets for an average-level speech input (65 dB SPL) using a clinically appropriate dome. Two user programs were configured: the first program (denoted as P1) was for quiet situations (omnidirectional microphone with noise reduction turned off), and the second program (P2) was for noisy situations (adaptive directional microphone with digital noise reduction enabled). The frequency responses of the two programs were equalized. The features in P2 were set to the default as suggested by the manufacturer. The device’s frequency response was not further fine-tuned based on user’s feedback. Figure 1. Mean hearing thresholds for the participants. Right and left ears are offset from one another. Error bars indicate 1 SD. Brody et al.: Comparing PSAPs and Hearing Aids 583
- 11. The PSAPs were fitted using the default earpiece rec- ommended by the manufacturers (PSAP1 and PSAP2: closed dome; PSAP3: power dome). PSAP1 had three pre- determined frequency responses (described as presets), so participants were given the opportunity to select and fine-tune the preset (see below for the procedure). PSAP2 and PSAP3 had only one predetermined frequency response that could not be altered by the end user. All PSAPs had multiple user programs preconfigured by the manufacturers, which could not be disabled. For all PSAPs, the default program (P1) was for listening in quiet environments and the second program (P2) was for noisy listening situations. In P2, directional microphones and noise reduction fea- tures were enabled. PSAP1 and PSAP2 had additional pro- grams for “entertainment” and telephone use. These additional programs were not tested in the current study; only P1 and P2 were used in the experiment. To better simulate user adjustments of hearing aids and PSAPs, participants individually selected their pre- ferred volume levels in each program for each device. Be- cause PSAP1 had three presets and its smartphone app had a three-channel equalizer feature, participants were allowed to select their preferred preset for each program
- 12. and use the equalizer to fine-tune the frequency response in addition to adjusting the volume. To determine the volume level for all devices (and adjust the frequency re- sponse of PSAP1), participants were positioned in a sound field created using an eight-loudspeaker array in a sound- treated booth. Eight Tannoy Di5t loudspeakers (Tannoy) were located at 0°, 45°, 90°, 135°, 180°, 225°, 270°, and 315° azimuth relative to the participant. The distance be- tween the loudspeaker and the participant was 1 m. Con- tinuous sentences from the Connected Speech Test (CST; Cox, Alexander, & Gilmore, 1987) were presented from 0° azimuth, and the CST babble noise was presented from all eight loudspeakers. Speech and babble noise were pre- sented at 60 and 40 dBA, respectively, for adjustments made in P1 and at 68 and 61 dBA, respectively, for adjust- ments in P2. These levels were selected to represent real- world listening situations (Wu et al., 2018). A Larson Davis 2560 0.5-in. random incidence microphone and a Larson Davis System 824 sound-level meter were used to calibrate the sound field (as well as the sound fields used in the outcome measures described below). The microphone was placed at the position of the listener’s head. To cali- brate the noise, the CST babble presented from each loud- speaker was first measured. The level and spectrum of each babble noise were adjusted to be equal across the eight
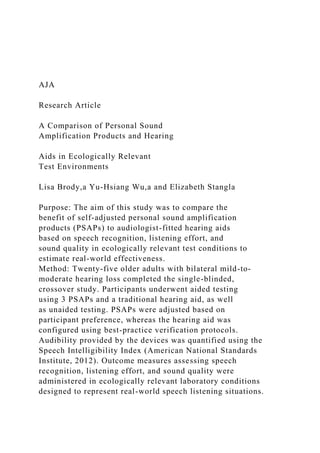
- 13. loudspeakers. The overall level of the babble noise (all loud- speakers presented at once) was then set to 40 dBA (for P1 adjustment) or 61 dBA (for P2). Participants were instructed to adjust each device using the following instructions, “Imagine you are having a conversation and adjust the device so that you can best understand the speech while maintaining comfort.” Par- ticipants adjusted left and right devices individually and could take as much time as they needed. Adjustments were made by pushing buttons on the devices (PSAP2 and PSAP3) or using a smartphone app (HA and PSAP1). For PSAP1, preset selection and fine-tuning were conducted before adjusting volume levels. A researcher was available to assist participants (e.g., changing the preset of PSAP1) during device adjustments. Pairing the smartphone (a Samsung Galaxy S6) to the devices (HA and PSAP1) was completed by the researcher before the adjustment process. For all devices, individual participant-selected settings in each pro- gram were recorded and were used for all testing in the study. To illustrate the electroacoustic characteristics of the devices, a series of Verifit 2 (Audioscan) test box mea- sures were conducted. The HA was configured to fit the
- 14. average hearing loss of the participants. All devices were set using the most commonly selected user settings (e.g., volume level and preset) across all participants in both programs. Figure 2 shows the input–output functions at 2000 Hz of P1 (A) and P2 (B) of each device. The figure indicates that the HA and PSAP1 utilized compression at various input levels whereas PSAP2 and PSAP3 demon- strated less compression. To quantify the device’s directiv- ity, a Verifit directivity measure (70 dB SPL with a +3 dB SNR) was conducted with the devices set in P2. The direc- tivity averaged from 500 to 5000 Hz (American National Standards Institute, 2010) for the HA, PSAP1, PSAP2, and PSAP3 was 8.4, 14.8, 9.7, and 9.5 dB, respectively. Figure 2. Input–output functions at 2000 Hz measured for each device in P1 (A) and P2 (B). Devices were set to the most common selected settings, averaged across all 25 participants. HA = hearing aid; PSAP = personal sound amplification product. 584 American Journal of Audiology • Vol. 27 • 581–593 • December 2018
- 15. Finally, the Verifit test box noise reduction measure (multi- talker babble noise stimulus at 70 dB SPL) showed that the average noise reduction from 500 to 5000 Hz for the HA, PSAP1, PSAP2, and PSAP3 in P2 was 2.8, 2.9, 3.5, and 0.4 dB, respectively. Outcome Measures Speech Intelligibility Index The Speech Intelligibility Index (SII; American National Standards Institute, 2012) was used to quantify speech audi- bility. Following device fittings and adjustments, an SII was measured on-ear with a 65-dB SPL speech input using a probe microphone and the Verifit hearing aid analyzer in both P1 and P2 for all devices using the participant-selected settings. An unaided SII was also recorded for comparison purposes. In addition, a real-ear aided response (REAR) with an input of 65 dB SPL was recorded for each device in each program using the subject-selected settings. Hearing in Noise Test The Hearing in Noise Test (HINT; Nilsson, Soli, & Sullivan, 1994) was used to measure participants’ speech
- 16. recognition thresholds (SRTs) both in quiet and in noise. The HINT was administered in the same sound field used for device adjustment. To measure the SRT in quiet, the HINT sentences were presented from 0° azimuth without noise and the devices were set to P1. To measure the SRT in noise, additional uncorrelated HINT noise was pre- sented using the eight-loudspeaker array. The overall level of the noise (all loudspeakers presented at once) was fixed at 65 dBA, and the devices were set to P2. Concatenated HINT sentences and the HINT speech-shaped noise were used to calibrate the sound field. In both test conditions (in quiet and in noise), the listener was asked to repeat a block of 20 HINT sentences (i.e., two lists). The speech level was adjusted adaptively, depending on the partici- pant’s responses, using the one-up-one-down procedure (4-dB steps for the first four sentences and 2-dB steps for the remaining sentences). The correct response regarding each sentence was based on the repetition of all the words in the sentence, with minor exceptions such as “a” and “the.” The presentation level (quiet condition) or signal-to- noise ratio (SNR; noise condition) of the final 17 presenta- tions was averaged to derive the SRT. Both test conditions of the HINT were administered for each device as well as in an unaided condition.
- 17. Connected Speech Test Estimated real-world speech recognition perfor- mance was assessed using the CST. The test is composed of 48 passages of conversational connected speech bro- ken up into specific topics. Each passage contains nine to 10 sentences, and 25 target words are used for scoring. The CST was selected because passages could be presented with or without a visual component and using connected speech offered more ecological validity compared to single words or unrelated sentences. The CST was conducted in conditions designed to represent real-world listening situa- tions. Specifically, Wu et al. (2018) examined the real-world listening environments of older adults with hearing loss and developed 12 “prototype listening situations” (PLSs). These PLSs describe the speech level, noise level, avail- ability of visual cues, and locations of speech and noise sources of typical speech listening situations experienced by older adults with hearing loss. The PLSs could enable more ecologically valid assessment protocols in the laboratory to evaluate real-world outcomes (Walden, 1997; Wu et al., 2018). In the current study, the six most frequent PLSs de-
- 18. scribed in Wu et al. (2018) were created for the CST testing using the eight-loudspeaker sound field described above. Wu et al. (2018) indicated that these six test environments would represent 71% of daily speech listening situations. The six PLSs (denoted as PLS1 to PLS6) were broken down into two subgroups: quiet and noise. For the three quiet PLSs, speech and noise were presented at 60 and 40 dBA, respectively (20 dB SNR). For the noisy PLSs, speech and noise were presented at 68 and 61 dBA, respectively (7 dB SNR). Note that noise was used in the quiet PLSs because, in the real world, listening environments that are completely quiet are rare (Wu et al., 2018). Within each subgroup, there were three configurations: speech presented from 0° azimuth with visual cues present, speech presented from 90° azimuth with visual cues absent, and speech presented from 0° azi- muth with visual cues absent. See Figure 3 for the charac- teristics of the PLSs. Visual cues (i.e., the talker’s face) were presented on a 17-in. computer monitor, which was placed right below the loudspeaker at 0° azimuth. For all PLSs, Figure 3. Characteristics of the six prototype listening situations (PLS). Circles indicate the eight-loudspeaker array surrounding the participant (center). Black circles indicate location of the
- 19. speech. Eye graphic indicates presence of visual cues. For PLS1 to PLS3, speech and noise were presented at 60 and 40 dBA, respectively. For PLS4 to PLS6, speech and noise were presented at 68 and 61 dBA, respectively. Brody et al.: Comparing PSAPs and Hearing Aids 585 uncorrelated CST babble was presented from each of the eight loudspeakers surrounding the listener, and the overall level (all loudspeakers presented at once) was set to 40 or 61 dBA, depending on the PLS. For each test condition, two CST passages (50 target words) were presented and scored. Performance was scored based on the percentage of target words repeated correctly in each condition. All devices were set to P1 for testing in quiet environments (PLS1, PLS2, PLS3) and P2 for testing in noisy environ- ments (PLS4, PLS5, PLS6). The CST was also adminis- tered in an unaided condition. Listening Effort Measure
- 20. Measures of speech recognition (e.g., the CST) are a useful way to quantify communication. However, research suggests that even when speech understanding scores under two conditions are similar, the level of listening effort might be different (Sarampalis, Kalluri, Edwards, & Hafter, 2009). To measure listening effort, the participants were asked to rate their perceived listening effort after listening and repeating CST sentences in each of the six PLSs. The participants answered the question “How hard were you working to achieve your level of speech understanding?” using a 21-point scale ranging from 0, representing not at all, to 100, representing very, very hard. This subjective listening effort measure, rather than objective measures such as dual-task paradigms, was selected because subjec- tive measures of listening effort can be more sensitive than objective measures (Johnson, Xu, Cox, & Pendergraft, 2015; Seeman & Sims, 2015). Sound Quality Rating Subjective sound quality judgments were recorded as a separate metric to differentiate between devices. Reports of poor sound quality may be associated with hearing aid nonuse and dissatisfaction (Solheim, Gay, & Hickson,
- 21. 2017). Perceived sound quality was measured in a manner similar to listening effort. Specifically, after listening and repeating CST sentences in a given condition, the partici- pants answered the question “How would you judge the overall sound quality?” using a 21-point scale ranging from 0, representing very poor, to 100, representing excel- lent. Sound quality ratings were obtained in only the aided conditions. Procedure The study was approved by the institutional review board of the University of Iowa. After consenting to the study protocol, participants’ hearing thresholds were mea- sured using pure-tone audiometry. If the participant met all required inclusion criteria, the devices were fitted and adjusted. Next, outcome measures were administered. For all testing, a practice condition was administered to con- firm participants’ understanding of the task. The order of device condition, PLS, HINT lists, and CST passage pairs were randomized across participants. The devices were inserted into the participant’s ears by a researcher so that participants were blinded to the device. However, researchers were not blinded to the devices when scoring test materials
- 22. (single-blinded design). Testing was completed in a series of two 2-hr sessions. Monetary compensation was pro- vided to the participants upon completion of the study. Results REAR Figure 4 shows the mean REAR (averaged across all 50 ears), measured using a 65-dB SPL speech input, of each device in P1 (A) and P2 (B) with the participant- selected settings. Mean REAR targets prescribed by NAL-NL2 averaged across participants are also shown in the figure. The REARs of the HA and PSAP1 are closest to the prescribed targets. In contrast, PSAP2 and PSAP3 underamplified speech sounds at frequencies above 2000 Hz. Root-mean-square deviations between the NAL-NL2 targets and each device at 500, 1000, 2000, and 4000 Hz were calculated and averaged across all 50 ears. Root-mean-square deviations for the HA, PSAP1, PSAP2, and PSAP3 … University of South Carolina COMD 500 Article Review Summary Due date: April 25, 2019 (11:59 pm)
- 23. Carefully read one of the three research articles posted on Blackboard. Once you’ve read the article, answer each of the following questions based on information from the article. Save the assignment as “Last name_First name_ArticleReviewAssignment” (example: “Smith_Jane_ArticleReviewAssignment”) and submit your assignment through Blackboard. 1. Provide a complete, accurate citation of the article in APA style below. Use a hanging indent! Citation: 2. What is the independent variable (or variables)? 3. What is the dependent variable (or variables)? 4. How was the dependent variable measured? List the instruments, tools, or technology that were used to measure the dependent variable. 5. Introduction: Summarize the background of the study in a few sentences. Highlight only the main points—those that are most relevant to the study you read.
- 24. 6. Introduction: What was the purpose of the study? 7. Introduction: What were the research questions or hypotheses? (Usually found in the last paragraph before the Methods section.) 8. Methods: Who were the participants in the study? List the number of participants and summarize their demographic characteristics briefly. 9. Methods: What did the participants do in the study? In other words, what procedures were used for data collection? Summarize these procedures briefly. 10. Results and Discussion: Briefly summarize the results of the study as they relate to the research questions or hypotheses (from question #7 above). Use normal, everyday language; statistical terminology is not needed. 11. Discussion: What are the conclusions and implications of the results that the authors describe in the Discussion section? 12. Reflection: What did you think about this article? What is the “take away” message, in your opinion?