
Recommended
Recommended
More Related Content
Similar to Deloitte’s 2014 Global Outsourcing and Insourcing Survey .docx
Similar to Deloitte’s 2014 Global Outsourcing and Insourcing Survey .docx (20)
More from simonithomas47935
More from simonithomas47935 (20)
Recently uploaded
Recently uploaded (20)
Deloitte’s 2014 Global Outsourcing and Insourcing Survey .docx
- 1. Deloitte’s 2014 Global Outsourcing and Insourcing Survey December 2014 2014 and beyond Contents Executive summary 2014 and beyond… The results of the Global Outsourcing Survey of 2012 rang loud, identifying a noticeable market shift towards insourcing — a response to changes in political sentiment, wage deflation, and high labor supply following the Great Recession of the late 2000’s. In 2014, however, the sentiment of the market appears to have changed, signaling a net increase in outsourcing consumption. Customers are no longer focusing on bringing services back in house, but are focusing on optimizing vendor relationships and improving operational flexibility.
- 2. Beyond 2014, customers are looking to expand their flexibility to react to potential changes in the regulatory and technology environment. Historically, increases in market consumption of outsourced services have been driven predominately by new customer expansion for mature functions like Information Technology, Human Resources, Finance and Accounting, and Procurement (the ‘Big 4’). As expected, customer growth in mature services will likely continue to play a significant role in growth beyond 2014. Growth will also be supplemented by an appetite for newer functional offerings like Facilities Management and Legal Process outsourcing and vertical Business Process Outsourcing (BPO) like Claims and Mortgage Processing. In addition to functions, the geographic mix of the sourcing landscape will continue to evolve, as customers seek opportunities to expand their geographic footprint from mature markets like India, China, Eastern Europe, and the Philippines, to new locations in South America. Beyond 2014, the outsourcing market is projected to grow by several key dimensions including functions, services, and locations. Technological advancements and innovations including cloud computing, ‘big data’, mobility, business process
- 3. as a service (BPAS), are changing the game as end users and customers alike are demanding high quality content and service in real time. Many of these advancements are having immediate impacts on the outsourcing landscape, particularly those which remove barriers like country of origin, capital investment, and long implementation horizon. In addition to enable innovations, companies are also looking at diversifying their service delivery footprint by considering locations that have a reputation for high service quality and lower cultural barriers. Countries with an educated technological workforce, language capabilities, stable currency, and stable technology infrastructure are potential candidates for offshoring. Beyond 2014, technology will reduce geographic barriers, encouraging companies to constantly reassess service delivery options. Outsourcing growth, in all forms, is not without risk. New geographies expose vendors to new geopolitical and socioeconomic risks which may have not been previously factored into outsourcing decisions by customers. In the early years of outsourcing, companies would turn over key management responsibilities as part of their outsourcing transition without making the ongoing investments in vendor and service management. This resulted in value leakage, talent attrition, and service issues.
- 4. With a whole host of new risks being introduced into the outsourcing landscape, companies must rethink their strategic investments in vendor management. Beyond 2014, customers will be better equipped and positioned to manage and govern vendors. In order to make the leap from low cost and high quality service delivery; to innovative and proactive business partnership, vendors and companies will need to meet in the middle. On the vendor side, an enhanced focus on bringing the right skills, innovative ideas, and industry expertise is required. On the company side, building a strategic vendor management and governance capability is necessary. Beyond 2014, collaborative relationships between vendors and companies will help drive service quality. 3 The sourcing landscape In a perfect world, all of the changes occurring in the outsourcing landscape would result in tangible value creation for end customers and improved profitability for both the companies and service provider. Unfortunately, not all of the changes will result in anticipated positive change. Potential changes to the
- 5. regulatory landscape including data privacy legislation in the European Union (EU), as well as, pending immigration legislation in the United States (US) may hinder business economics and increase outsourcing related risks. Key trends in outsourcing To understand the dynamics of the outsourcing market, Deloitte surveyed 140 companies in nearly 30 different countries, on specific dimensions representing changes affecting the outsourcing industry. These categories included: regulation and legislation, functions and services, geography, and innovation and technology. Based on the results of the questionnaire, the following key trends emerged: Technology: Recent developments and innovations, like cloud computing and business process as a service (BPAS), are driving growth within the outsourcing space while innovations like gamification and ‘Bring Your Own Device’ (BYOD) are having less influence on outsourcing decisions. New and emerging innovations like mobility and big data are also having a pervasive impact on sourcing decisions; however, they are not the primary innovations that respondents are focusing on. As big data and mobility gain additional popularity, these technologies should begin to have a larger impact on sourcing outcomes.
- 6. Location strategy: India continues to represent the primary destination for offshoring (especially for English language operations) and a global hub for multi- location sourcing strategy. In addition to India, respondents have indicated that they are continuing to pursue opportunities in Poland, Philippines, and China. Over the past decade, new markets for outsourcing opportunities have emerged in Romania, Mexico, and Brazil, and these are expected to see continued growth. Countries within South America and Asia remain as high potential opportunities, however, further development is required before they are viewed as viable sourcing options. Legislation and regulation: Respondents are unanimously not in favor of legislation to limit offshoring. If legislation is enacted to curb offshoring, respondents believe they may face an increase in costs, which they intend to pass through to consumers. Some participants indicated that they will absorb the impact through a reduction in profitability. In Europe, the Middle East and Africa (EMEA), relaxation of employment related regulation (e.g. immigration controls, ARD/TUPE) is expected to lead to an increase in outsourcing, while increased data privacy regulation is likely to reduce the use of outsourcing globally. As used in this document, “Deloitte” means Deloitte Consulting LLP, a subsidiary of Deloitte LLP. Please see www.deloitte.com/us/about for a detailed description
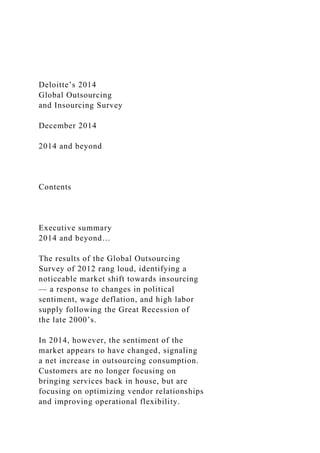
- 7. of the legal structure of Deloitte LLP and its subsidiaries. Certain services may not be available to attest clients under the rules and regulations of public accounting. 4 Structural change The last two decades have seen a significant rise in offshoring to external service providers. The driver for this trend has been largely economic, since offshoring often offers more competitive price points for the same service levels. Beyond cost savings, companies often also use outsourcing to support their strategy — in this case the choice of focusing on core, strategic competencies and relying on a global network of external service providers to perform less strategic functions. In recent years we have witnessed a small but growing reversal of this trend where companies that have previously offshored functions are bringing them back to their home country (also known as “onshoring”).1 Based on the results of the 2014 Survey, a significant majority of respondents have not and do not plan to move work from offshore locations back to their domicile country locations. Those in the minority, who do plan to move things back onshore,
- 8. cited supplier performance and inability to achieve cost targets as the primary drivers for reverting or pursuing an alternative sourcing strategy. • Only 16% of respondents have moved work back to their home country. • Most of the respondents who have moved work back to the home country have done so due to offshore supplier performance. • Government incentives provide less motivation for respondents to move work back to their home country than other driving factors. No 84% Have you moved work or are planning to move work back to your home country? Inability to realize cost advantage Customer perceptions Time zone considerations Social beliefs Government incentives Offshore supplier performance
- 9. What are the main drivers of such a decision? Yes 16% 72% 44% 28% 28% 17% 11% 1 From Bangalore to Boston, Deloitte 2013 5 Drivers for change Technology The coupling of traditional outsourcing (e.g. services plus staff enablement technology) with cloud-based offerings has both advanced and complicated the latest, cutting-edge data center deals. Both are required components to encompass the end-to-end scope of services. Historically, this has been achieved through traditional outsourcing alone, but we are seeing increased pockets of cloud products embedded in data center scope, with the
- 10. vendor’s solution providing economies of scale by leveraging virtualized servers on standardized architectures, technologies, and interfaces. The result is a lower infrastructure cost to the company (along with decreased applications costs when standardized development methods are applied) and the flexibility for companies to cease running their own data centers. According to respondents, end user engagement innovations (gamification and crowdsourcing) and hardware flexibility innovations (BYOD) are not expected to lead to an increase in outsourcing in the foreseeable future. Given the nascent nature of these innovations, many respondents are unable to predict what influence they will have on future outsourcing decisions. To what extent will the following technology developments impact your future outsourcing decisions (% of respondents more likely to oursource as result of development)? Cloud computing Business process as a service Hosted virtual desktop
- 11. Big data Enterprise mobility Open innovation Crowdsourcing Bring Your Own Device (BYOD) Gamification 69% 66% 59% 55% 53% 41% 35% 28% 13% • Over 50% of respondents have indicated that developments in enterprise mobility, big data, hosted virtual desktop, business process as a service, and cloud computing will increase outsourcing. • Less mature technology developments like BYOD and gamification are not likely to affect respondents’ decisions to outsource. 6
- 12. Drivers for change Location strategy India has been traditionally the preferred choice for many offshoring and outsourcing activities. Even though high labor costs, high withholding tax, currency volatility and inflation in Latin America are inhibitors for outsourcing as compared to established outsourcing destinations like India and China; other factors like proximity and time-zone make Latin America an attractive option for offshoring. Latin American governments continue to support free trade and promote various English language support programs to attract global service providers and companies alike. The Finance and Accounting Outsourcing (FAO) market in Latin America emerged from the earlier success of captive/ shared-service center pioneers in the region and now third-party outsourcing providers are increasing their presence in the region. The market is currently driven by intra-region outsourcing demand; however, as global FAO providers scale up their presence in the region, Latin America is soon expected to become one of the major hubs for FAO. While this region is flush with opportunities, firms looking to outsource to Latin American should proceed with caution, as countries like Brazil, although ripe with opportunity, are also subject to variable tax structures. While emerging markets with low labor costs locations receive considerable attention, established offshore, near-shore,
- 13. and even onshore locations still provide compelling opportunities to support business. Outsourcing location decisions today are driven by not just labor-cost arbitrage opportunities, but critical operating factors, risk appetite, and corporate growth strategy. India United States China Poland Philippines Romania Mexico Australia Brazil Malaysia South Africa Guatemala Israel Ecuador Panama Iceland Nicaragua Developed Developing
- 14. Future opportunities 0 20 40 60 80 100 Already there Planning to go or would consider 59% 52% 16% 40% 27% 35% 27% 24% 31% 21% 26% 21% 27% 19% 29% 17% 36% 14% 38% 8% 20% 5% 18% 4% 21% 4% 20%
- 15. 2% 29% 2% 28% 0% 20% 22% • Developed sourcing locations like India, the U.S., China and Poland can be expected to see continued growth of 15%-27%. • Developing sourcing locations like Philippines, Romania, Mexico, Brazil and Malaysia can be expected to achieve higher rates of growth, leading to a potential doubling of the outsourcing market in these countries. • Future opportunities exist in areas with low levels of current offshore service delivery, with upwards of 20% of respondents stating that they plan to source, or would consider sourcing, from these countries. 50% of respondents indicated that future technology advancements will diminish the importance of service delivery locations, with a further 12% suggesting that location may become somewhat or completely irrelevant. 7
- 16. Drivers for change Legislation and regulation — offshoring Cyclical downturns in the US and global economy will likely continue to increase the political pressure for prohibitive anti- offshoring legislation to be passed in the future, even though it has been historically difficult, particularly in North America.2 According to survey respondents, anti- offshoring legislation will have negative financial, economic, and competitive impact on corporations. • Almost all respondents (89%) believe that offshoring will continue to grow unless legislation is enacted to curb it. However, only 1 out of 4 respondents support such legislation. • More than half of responding companies will be negatively impacted by anti- offshoring legislation. In the event of anti-offshoring legislation, 18% of organizations anticipate cost increase will be passed to the consumers. A further 50% anticipate increased costs which will not be passed to the consumers, possibly resulting in competitive disadvantage. • Among large organizations (greater
- 17. than 100,000 employees), 90% are opposed to anti-offshoring legislation, while small organizations (fewer than 1,000 employees) are the more favorable to anti- offshoring legislation. • According to the survey results, companies in Asia and Americas are less concerned about anti- offshoring legislation as compared to Europe. • Despite limited support for legislation to curb offshoring, nearly 40% of respondents expect such legislation to be enacted in their home country. • Half of U.S. respondents believe the U.S. will enact regulation, and 60% of U.S. respondents believe such regulation would have a negative impact to consumers or to top line growth. However only 10% characterize the impact as significant. • Government incentives to promote repatriation of jobs have not motivated respondents to move work back to their home countries (less than 2% reporting that they did so as a result).
- 18. 2 Anti-Offshoring Bill Unlikely to Impact Call Center Industry, CIO Magazine, 2013 No 11% Yes 25% Yes 37% Yes 89% Impact will be significant Impact will be minimal 32% 68% No 75% No 63% Will offshoring continue to grow unless legislation is enacted to curb it? Do you believe your home country will enact regulations to restrict offshoring?
- 19. Should legislation be enacted to curb offshoring? Do you believe there will be a significant impact to your business? Americas Asia-Pacific EMEA 55% 45% 58% 42% 74% 26% Yes No 8 23% 18% 35% 31% 28%
- 20. 24% Drivers for change Legislation and regulation — data privacy With the latest host of data breaches at some of the largest corporations within the Fortune 500, data privacy and security has become a major priority amongst both technologists and back-office leadership alike. With concerns regarding private protections of Personally Identifiable Information (PII), governments globally are exploring opportunities to bolster and enhance existing consumer data protections. While it is unclear what future data privacy legislation may look like, it is clear that any future legislative changes will have an immediate impact on the consumption of outsourced services — particularly those directly dealing with customer information. According to survey respondents, increased data privacy regulation will have a material impact on whether or not a respondent chooses to outsource to a third party. • Of the regulations surveyed, increased data privacy regulation is projected to have the greatest impact on the outsourcing decisions. • U.S. organizations are three times more likely to decrease, rather than increase, outsourcing due to an increase in data
- 21. privacy regulation. EMEA organizations are almost twice as likely to decrease, rather than increase, outsourcing. • The majority of respondents felt that increased anti-corruption regulations would be unlikely to impact their decision to outsource. • Organizations outside of the U.S. are three times more likely to increase, rather than decrease, outsourcing, due to relaxation of hiring and termination restrictions. In the U.S., most respondents (71%) anticipate no impact on the outsourcing decision. • In the U.S., health care reform is expected to result in a moderate increase of outsourcing. • Relaxation of immigration policy will result in a moderate increase in outsourcing, driven primarily by the Asia Pacific region with 45% of participants indicating they are likely to increase use of outsourcing versus 28% across all geographies combined. This sentiment is lead primarily by responses from India, Pakistan, South Korea, and Japan. Less than 5% of organizations are likely to decrease outsourcing as a result of a relaxation in immigration policy. • Relaxation of export controls
- 22. will result in a moderate increase in outsourcing activity, driven primarily by the Asia Pacific region with 45% of participants indicating that they are likely to increase use of outsourcing versus 24% across all geographies combined. Less than 10% of organizations are likely to decrease outsourcing as a result of relaxed export controls. Likely to decrease use of outsourcing (% of respondents) Likely to increase use of outsourcing (% of respondents) Increased data privacy regulation Increased anti-corruption regulation (e.g. UK Bribery Act, BSA/AML, FCPA) Relaxed restrictions on hiring and termination of new employees (e.g. ARD/TUPE) In the U.S., impact of health care reform (e.g. PPACA) Relaxed immigration policy Relaxed export control (e.g. ITAR) 40% 13%
- 23. 13% 4% 5% 5% 9 Managing change A typical Fortune 500 organization may use as many as 10,000 suppliers to meet its business objectives.3 As capabilities and offerings of third-party providers become more sophisticated, the management of outsourced and out-tasked services becomes more complicated and risky. Nowadays, Regulators and customers, expect organizations to be accountable for the actions of their third-party providers. For example, the Office of the Comptroller of the Currency and Federal Reserve hold the board of directors of financial institutions responsible and accountable for risks taken by the organization including those taken via third-party engagements. Hence, corporations should make Vendor Management as an integral part of their business strategy. Key trends in Vendor Management
- 24. Vendor Management: The market is currently under-invested in the area of vendor management, particularly when it comes to tools, methods, and processes. Despite the lack of investment, companies generally believe that their vendor management capabilities are equal to or better than their peers. These trends clearly articulate that a lot of the underinvestment in vendor management, may be a direct result of a general market consensus that each company is equal to or better off than their peers, regardless of whether or not they assign any additional resources to improve their vendor management process maturity. Issue and Dispute Management: In addition, to evaluating performance, companies are expanding their capabilities in terms of managing and resolving issues or disputes. Where historically, companies were fairly quick to terminate a vendor contract or drastically reduce vendor services, they are now pursuing a series or preliminary options before terminating contract. In circumstances, where contracts are terminated, companies prefer to stick with a predominately outsourced strategy versus trying to insource their services. 3 Vendor Management Program Office — Five Deadly Sins of Vendor Management, Deloitte 2013 10
- 25. Managing change Vendor management Historically companies have extended onshore sourcing and procurement functions to include a Vendor Management capability. With increasing demand for outsourcing and offshoring and growing complexity, Vendor Management functions have evolved and established their own identity (including specialized skills and tools). The next stage of outsourcing journey has seen a small but growing trend of organizations moving Vendor Management functions and processes to near shore or offshore centers. Just as companies have evaluated benefits for outsourcing IT and non IT services, in addition to realizing cost benefits, the same approach can be applied to Vendor Management. According to the survey respondents, Financial, Commercial and Contract Management capabilities are perceived to be above average in terms of quality and maturity. However, other processes including Governance, Service Performance, Issue and Dispute Management, and Transition Management require additional improvement. • Respondents believe that they are
- 26. the most mature in Financial and Commercial Management with nearly 93% of respondents indicating that they are at or above their peers. • Respondents believe that they are the least mature in Issue and Dispute Management with nearly 26% of respondents indicating that they are below the market. • Vendor Management organizations continue to be most effective at traditional Vendor Management (e.g. financial management, contract management), however few organizations rate themselves above average in Multi-Service Provider Integration and Supplier Risk Management. Below average (% of respondents) Above average (% of respondents) Financial and commercial management Contract management and compliance Governance Service performance management Issue and dispute management Transition and transformation management
- 27. Change and request management Multi-service provider integration Supplier risk management Documents management 49%7% 39%16% 38%13% 33%14% 33%26% 31%23% 30%16% 28%25% 22%18% 19%25% How would you rate your vendor management capabilities? 11 As companies move beyond ‘Managing to the Contract’, they will continue to
- 28. look at and evaluate vendors on multiple dimensions. During the early stages of outsourcing, vendor performance was measured predominately through quantitative measures, e.g. service levels; however, companies are now beginning to further expand performance management programs by evaluating providers based on a variety of different measurements including end-to-end business outcomes and results. According to survey respondents, most issues are derived from the service provider being reactive rather than proactive or from the provider delivering poor service despite achieving service levels. Cost related metrics and culture compatibility are least commonly cited as the cause of service provider related issues. Managing change Issue and dispute management • Nearly 50% of respondents cited that the reactive vs. proactive nature of their service providers and poor service quality despite achieving service levels as reasons for issues surfacing with service providers. • Nearly 40% of respondents cited a lack of innovation and underqualified resourcing as reason for complications with service providers. • Despite the focus on attrition and cost,
- 29. less than 30% of survey respondents cited these reasons as a cause for issues surfacing with providers. Reactive vs proactive Poor service quality (despite achieving Service Levels) Lack of innovation Unqualified resources Lack of responsiveness Failure to meet Service Levels Ineffective issue resolution Communication barriers Poor quality of relationship High service provider attrition Too costly Incompatible culture 49% 48% 37% 36%
- 30. 34% 33% 33% 30% 30% 28% 21% 19% Please identify issues that you are currently facing with your outsourcing providers 12 Managing change Issue and dispute management (continued) Once an issue has been identified with a service provider, companies may pursue several alternative strategies to address and remediate the issue before it escalates to a dispute. The primary option for the company is to ‘Manage to the Relationship’, whereby they leverage informal channels to identify an immediate resolution which may or may not fall within the guardrails of the contract. The secondary option for the
- 31. company is to ‘Manage to the Contract’, often a more contentious approach, requiring them to leverage contractual mechanisms, rights and obligations to resolve the issue. As a tertiary option, companies may choose to resolve the issue through conclusive actions like terminating the contract in part or in its entirety. All options are viable, however, given the hierarchical nature, and challenges posed by each, companies generally choose less contentious methods first. According to respondents, the preferred approach for resolving conflict with providers is to first ‘Manage to the Relationship’, then ‘Manage to the Contract’, and leverage any ‘Last Resort’ options where needed. Additionally, nearly 70% of respondents choose to continue outsourcing upon termination of the agreement, indicating that many of the unresolved issues are vendor specific and not attributed to outsourcing specifically. • Over 60% of respondents, indicated that escalating issues to vendor leadership is the best method for resolving issues and disputes with vendors. • Last resort options including termination for cause and termination
- 32. for convenience were taken by 13% and 9% of respondents, respectively. • Of respondents who elect to terminate their agreement, 70% continue to contract with a 3rd party to achieve their post contract service strategy. Escalation of issues to vendor leadership Enhanced governance processes Provided additional training Restructured/renegotiated the deal Restructured service levels Increased competition Added vendor management capability Reduced the scope of services Terminated for cause Terminated for convenience Manage to relationship Manage to
- 33. contract Last resort 0 10 20 30 40 50 60 70 80 63% 58% 40% 39% 35% 33% 32% 23% 13% 9% What steps have you taken, if any, to remediate outstanding issues with your providers? Post contract insourcing vs. outsourcing What was your post contract termination strategy? Were you satisfied with the results?
- 34. Outsource 69% Satisfied 62% Insource 25% Neutral 32% Other 6% Dissatisfied 6% 13 Functions and services In spite of the structural (e.g. legislation, regulation, and technology) and cultural (e.g. location) changes influencing outsourcing decisions, the market appears to demanding more outsourcing. Information Technology (IT) continues to be the most commonly outsourced function, at nearly 60% penetration. While IT services are highly mature in the market place, to gain a better perspective, it is necessary to evaluate functions like Human Resources, Legal, and Real
- 35. Estate and Facilities Management where outsourcing is expected to grow by 12%-26% per annum. This growth is redefining what traditionally outsourced tasks were within each function, e.g. from transactional to increasingly complex work based on judgment. 14 Functions and services Finance Finance and Accounting (F&A) services outsourcing is expected to increase in growth over the next few years. 30% of respondents expect to outsource additional services across all areas of F&A, with the least historically outsourced services, Accounts Receivable and Billing, seeing a planned increase above the 30% mark. This trend suggests outsourced F&A will continue to see strong growth and become more standard practice for many companies. Increasing availability of global service providers in non-traditional locations will support this fast-growing functional area. Currently many activities are basic transactional finance and accounting processes such as accounts payable, however companies are starting
- 36. to experiment with outsourcing non-transactional financial functions like financial analysis. Outsourcing knowledge-based financial services is still a nascent business practice, but as the comfort level of organizations rise it should become a more common practice. 50% 29% 49% 33% 41% 22% 41% 24% 40% 31% 38% 23% 36% 32%
- 37. 32% 34% Current outsourcing (% of respondents) Plan to outsource (% of respondents) Travel and entertainment Accounts payable Collections General accounting Payroll Fixed asset accounting Accounts receivable Billing Travel and entertainment Accounts payable Collections General accounting Payroll Fixed asset accounting
- 38. Accounts receivable Billing 15 Legal opinions Legal counsel Patent review/drafting Legal research and analysis Negotiation support Paralegal support Contracting drafting e-Discovery Billing services Functions and services Legal Corporate legal departments are faced with a number of issues that require them to evaluate and implement Legal Process Outsourcing (LPO) solutions. Key concerns include resource allocation, inefficiencies in processes and project
- 39. management, and technological investments such as automation and document standardization.4 The solutions offered by outsourcing Legal services have led to a rise in tactical Legal services such as e-Discovery, Billing, and Research and Analysis. E-Discovery is one of the largest growth opportunities within legal services outsourcing. Among respondents who plan to outsource legal services, 25% plan to outsource e-Discovery. As the LPO market becomes more mature, corporate legal departments are starting to move outsourcing beyond transaction- based legal processes to judgment based processes, such as Contract Drafting which is expected to grow by 18%. 4 Implementing a corporate legal process outsourcing solution, Deloitte 2013 67% 23% 65% 15% 57% 14% 56% 26% 43% 14% 43% 17%
- 40. 37% 18% 35% 18% 21% 25% Current outsourcing (% of respondents) Plan to outsource (% of respondents) Legal opinions Legal counsel Patent review/drafting Legal research and analysis Negotiation support Paralegal support Contracting drafting e-Discovery Billing services 16 Functions and services Real estate and facilities management
- 41. Real Estate and Facilities Management (RE&FM) spend is typically the second largest administrative cost for companies. Design and Construction are the most commonly outsourced services in RE&FM with 53% of respondents indicating that they are currently outsourcing these services. While RE&FM services like Design and Construction and Document Services are reaching saturated levels of a mature market, there are still significant opportunities for growth. Of all RE&FM services polled, Asset and Lease Management is the greatest area of expected growth. While only 13% of the respondents currently outsource Asset and Lease Management Services; 37% of those who plan to outsource, are considering doing the same. Another notable service is Financial Performance Management and Reporting, which is projected to grow nearly 19%. 53% 43% 39% 35%
- 42. 31% 21% 20% 13% 11% Current outsourcing (% of respondents) Manage design and construction services Document services Manage transaction processing for real estate Develop and manage real estate portfolio Reception/guest services Office/meeting scheduling Define and develop real estate financials Manage assets/leases Manage and report financial performance 17% 14% 18%
- 43. 24% 14% 13% 20% 37% 19% Plan to outsource (% of respondents) Manage design and construction services Document services Manage transaction processing for real estate Develop and manage real estate portfolio Reception/guest services Office/meeting scheduling Define and develop real estate financials Manage assets/leases Manage and report financial performance 17
- 44. Functions and services Human Resources Over the last few years, Human Resources (HR) outsourcing has struggled to find the right balance between comprehensive solutions and targeted competencies that address specific business issues. The transformation continues to seek equilibrium, shifting to a center that includes value-added and judgment-based services (e.g., workforce analytics, global mobility, and employee relations). Call Center Management is a commonly outsourced service in Human Resources and is usually aligned with administration for specific services such as benefits administration. Other services commonly outsourced include Expat Administration and HRIS Maintenance and Support. In the last few years the industry has seen an increased use of offshore services. Integration services such as reporting are becoming more prevalent and are expected to undergo high growth. Among respondents who plan to outsource HR, 38% plan to outsource HR Administration, as compared to only 13% who currently outsource. Some of this trend can be attributed to growing service offerings for leave administration, recruitment process outsourcing, and learning process outsourcing.
- 45. 43% 35% 34% 30% 21% 16% 13% 13% 7% Current outsourcing (% of respondents) Call center management Expat administration HRIS maintenance and support Payroll time administration Recruiting and staffing administration Total rewards administration Workforce analytics HR administration
- 46. HR reporting 23% 21% 29% 36% 21% 33% 29% 38% 32% Plan to outsource (% of respondents) Call center management Expat administration HRIS maintenance and support Payroll time administration Recruiting and staffing administration Total rewards administration Workforce analytics
- 47. HR administration HR reporting 18 Functions and services Customer service Contact centers expect to grow to support organizational needs to improve customer service, to support business growth, and to support contact volume growth across all channels, email and social media in particular. Results of the 2013 Global Contact Center survey showed 85% of organizations currently support multi- channel customer service capabilities and over 90% of organizations that view customer experience as a competitive differentiator provide multi-channel customer access.5 With one of the highest expected growth rates in Customer Service, Simple “Tier 1” Customer Service Inquiries is the most commonly outsourced service. Due to the importance of the customer experience, Complex “Tier 2” Customer Service Inquiries are less commonly outsourced and are seeing some of the lowest growth rates among customer service outsourcing.
- 48. Loyalty programs are relatively uncommonly outsourced services but are expected to break their way into mainstream customer service outsourcing. 5 2013 Global Contact Center Survey Results, Deloitte, 2013 54% 29% 46% 13% 43% 21% 41% 28% 39% 21% 37% 15% 36% 20%
- 49. 32% 32% 32% 18% 30% 22% 27% 19% 6% 22% Current outsourcing (% of respondents) Plan to outsource (% of respondents) Simple ‘Tier 1’ customer service inquiries Order fulfillment Initial complaint handling Technical support Outbound sales Complex ‘Tier 2’ customer service inquiries
- 50. Inbound sales Back office — Non-customer facing administration processes Social media responses Billing and collections Account inquiries Loyalty programs Simple ‘Tier 1’ customer service inquiries Order fulfillment Initial complaint handling Technical support Outbound sales Complex ‘Tier 2’ customer service inquiries Inbound sales Back office — Non-customer facing administration processes Social media responses Billing and collections Account inquiries
- 51. Loyalty programs 19 Functions and services Procurement The adoption of procurement outsourcing has been very slow. The main barriers to adoption being the need for deep understanding and control of spend categories, gaining trust of the stakeholders, shortage of procurement and sourcing skills, and lack of broad knowledge of the suppliers across geographies. In many cases, procurement outsourcing is restricted to the transactional procure to pay processes as an extension of the F&A BPO deals. Consequently, the procurement outsourcing marketplace is still growing and offers an opportunity for companies seeking additional cost reductions.6 Rewards for breaching procurement outsourcing barriers are high; savings for non-core commodities and services procured though BPO services could range between 5% to more than 20%.7 As a result, there has been a significant uptick in the outsourcing of indirect procurement activities, including transactional processing and sourcing of goods and services.
- 52. Results of the survey reflect a higher adoption for transactional services. First on the list of commonly outsourced processes in Procurement is Create and Issue Purchase Orders, followed by Spend Analysis and External Benchmarking, then Creating Requisitions, and Assessing Supply Markets. Traditionally the least commonly outsourced Procurement processes and services are Supplier Negotiation and Contracting as well as the Management and Assessment of Suppliers; however, despite the current limited outsourcing activity in Procurement space, 30% of respondents have indicated that then plan to outsource Supplier Performance Management and Assessment and 23% of respondents plan to outsource Supplier Negotiation and Contracting. 6 The untapped potential of procurement outsourcing, Deloitte 2013 7 The untapped potential of procurement outsourcing, Deloitte 2013 27% 30% 26% 38%
- 53. 26% 24% 21% 17% 16% 15% 13% 23% 28% 17% 10% 25% 23% 30% Current outsourcing (% of respondents) Plan to outsource (% of respondents) Create and issue purchase orders Conduct spend analysis and external benchmarking
- 54. Create requisitions Assess supply markets Create commodity strategies Manage prices Manage RFIs and RFPs Manage and assess supplier performance Negotiate and contract with suppliers Create and issue purchase orders Conduct spend analysis and external benchmarking Create requisitions Assess supply markets Create commodity strategies Manage prices Manage RFIs and RFPs Manage and assess supplier performance Negotiate and contract with suppliers 20
- 55. Functions and services Information technology IT is typically the single largest administrative cost for companies. Over the years, IT Outsourcing (ITO) has matured into a well understood construct which drives over 60% of the total sourcing market.8 Though the demand for ITO continues to grow, there are significant shifts within the IT services delivery model driven by recent advances in technology (e.g. cloud computing, social computing, and green IT) which offer companies and providers new and creative solution options. Companies demand more value than can be derived from economies of scale and labor arbitrage alone. Sophisticated consumers of outsourced IT services are seeking service partners and arrangements that will position them to take advantage of future changes in the IT landscape. Over the past few years, leading companies have moved away from “mega deals”; instances where large organizations sole-sourced significant chunks of their IT service delivery environment to a single provider through long term deals.9 Instead, companies have begun to segment their environments and pursue a
- 56. “portfolio approach”, by engaging multiple providers and benefiting from the capabilities of smaller, specialized vendors. 8 ITO Market Trends, Deloitte, 2014 9 From strategy to execution An Outsourcing Advisory Services compendium, Deloitte, 2013 61% 60% 58% 58% 57% 51% 51% 46% 19% 14% 20% 17% 20%
- 57. 22% 23% 26% 23% 16% Current outsourcing (% of respondents) Plan to outsource (% of respondents) Network (voice) Application maintenance and support Network (data) Application hosting and support Application development/enhancements IT service desk Data center End user device provisioning and support IT architecture design Network (voice) Application maintenance and support
- 58. Network (data) Application hosting and support Application development/enhancements IT service desk Data center End user device provisioning and support IT architecture design 21 Conclusion The outsourcing landscape is constantly changing to better serve customers and Deloitte continues to assess the market dynamics to provide valuable and detailed insights to Deloitte customers. While today we are seeing continued growth in the consumption of outsourced services; there are no assurances of how long this trend will continue to last. It is nearly impossible to predict with any level of certainty when a macro-economic or disruptive business event will happen and how that will affect the interaction between companies and service providers. Despite the uncertainty, there are a few things that we do know.
- 59. 1. Vendors’ service offerings are continuously evolving to fulfill customer needs 2. Customers will likely continue to demand more from their vendors expecting them to go above and beyond the terms of the agreement to deliver value on both qualitative and quantitative terms 3. The bar for vendor management capabilities will likely keep rising as companies seek to leverage multi- vendor or multi-functional strategies requiring transition and service integration capabilities 4. The regulatory and legislative landscape will likely continue to influence outsourcing decisions and retaining the flexibility to change direction rapidly, even for complex services, is key 5. Beyond 2014, as vendors become adept at delivering innovative solutions, analytics and cloud offerings, customers will continue to benefit from the resulting increased flexibility. 6. Despite a political environment that can dampen the appeal of outsourcing, for the foreseeable future, we expect to see a continued growth of the industry. 22
- 60. Appendix Demographics Deloitte Consulting undertook a broad research effort to analyze the outsourcing landscape, trends, and approaches that companies are currently taking. The Deloitte Consulting Global Outsourcing Survey 2014 had 157 unique respondents representing 140 public and private sector entities. Respondent organizations represent major industries and include both single-country companies and multinational corporations. Industry The participants represented are in 22 industry sectors across Technology, Media, Telecommunications, Healthcare and Life Sciences, Energy and Resources, Government, Consumer Products, Industrial Products, Financial Services and Professional Services. The 10 sectors with the greatest representation were Banking, Professional Services (including Legal), Consumer Products, Technology, Process and Industrial Products, Telecommunications, Life Sciences, Transportation, Power & Utilities (including renewable), and Insurance.
- 61. 70% of respondents were from three industries: Consumer and Industrial Products (C&IP), Financial Services (FSI), and Technology Media and Telecommunication (TMT) industries Size The typical respondent representing 40% of the organizations surveyed generated between $1 billion and $15 billion in revenue and 61% of respondent organizations had revenues greater than $1B. The typical respondent representing 49% of the organizations surveyed had between 1,000 and 25,000 employees and 74% of respondent organizations had greater than 1000 employees. Geography Survey participants represent 30 countries located across North America, Central America, Asia, Africa, Eastern Europe, Western Europe, and Australia. 10 countries with the greatest representation were the US, Korea, India, Canada, UK, the Netherlands, Denmark, Finland, Colombia and Australia. 69% of survey participants are headquartered in North America or Europe. Of the survey participants headquartered in North America, 40% had more than $1 billion in annual revenue and 45%
- 62. had more than 10,000 employees. A note on location terms The survey instrument defined the terms “within country,” “nearshore,” and “offshore” as follows: • Within country: Service is generally performed in the same country as the service is received or in a country where labor rates are generally consistent with those where the service is received (e.g. US-to-US, US-to-UK, Sweden- to-UK, etc.). • Nearshore: Service is generally performed in another country near where the service is received (usually within or close to the same time zone) and where labor rates are generally lower than those where the service is received (e.g. Mexico-to-US, Eastern Europe-to-UK, etc.) • Offshore: Service is generally performed in another country where labor rates are typically significantly lower than those where the service is received and there may be a significant difference in time zone (e.g. India-to-US, Philippines-to-UK, etc.) What is your organizations primary industry sector? What is the revenues of your organization? What are your total employees? Respondents by region Consumer and Industrial Products Financial Services
- 63. Technology, Media, and Telecom Professional Services Health Care and Life Sciences Energy and Resources Public Sector Less than $1 billion $1 billion to $5 billion $5 billion to $15 billion Greater than $15 billion Fewer than 1,000 1,000 to 10,000 10,001 to 25,000 25,001+ Asia/Australia/Africa Europe Americas 6% 7% 8%
- 64. 10% 16% 23% 31% 39% 23% 17% 21% 25% 26% 31% 27% 30% 43% 18% 23 Contact us To discuss the survey results and trends, contact:
- 65. This publication contains general information only and Deloitte is not, by means of this publication, rendering accounting, business, financial, investment, legal, tax, or other professional advice or services. This publication is not a substitute for such professional advice or services, nor should it be used as a basis for any decision or action that may affect your business. Before making any decision or taking any action that may affect your business, you should consult a qualified professional advisor. Deloitte shall not be responsible for any loss sustained by any person who relies on this publication. Copyright © 2014 Deloitte Development LLC. All rights reserved. Member of Deloitte Touche Tohmatsu Limited Americas EMEA APAC Marc Mancher Deloitte Consulting LLP Indianapolis +1 860 488 5071 [email protected] Peter Lowes Deloitte Consulting LLP New York +1 212 618 4380 [email protected] Simon Tarsh Deloitte Consulting LLP New York +1 212 313 1983 [email protected] Christine Ahn Deloitte Consulting LLP
- 66. Los Angeles +1 213 553 1084 [email protected] John Tweardy Deloitte Consulting LLP Pittsburgh +1 412 402 5418 [email protected] Ian Chan Deloitte Inc. Canada Toronto +1 416 775 7245 [email protected] Michael Montonen Deloitte Consulting Group Mexico +52 55 5080 6416 [email protected] deloittemx.com Luiz Fernandes Costa Deloitte Touche Outsourcing Serv. Cont. Adm. Ltda. Sao Paulo +55 11 51866911 Punit Bhatia Deloitte MCS Limited London +44 20 7007 9466 [email protected] Neville Howard Deloitte MCS Limited London +44 20 7303 7252 [email protected]
- 67. Fabrizio Napolitano Deloitte Consulting AG Zurich +41 5 82796766 [email protected] Daan De Groodt Deloitte Consulting BV Amsterdam +31 6 8201 9392 [email protected] Per Lund Pedersen Deloitte Consulting Copenhagen +45 3093 6038 [email protected] Peter Ratzer Deloitte Consulting GmbH Munich +49 89 29036 7970 [email protected] Philippe Rassek Deloitte Consulting France Paris +33 6 7945 4923 [email protected] Antonio Russo Deloitte Consulting AG Zurich +41 5 82797441 [email protected] Parag Saigaonkar DC Overseas Services LLC Mumbai +1 678 299 7001 [email protected] Peter Barta
- 68. Deloitte Touche Tohmatsu Melbourne +61 3 9671 6699 [email protected] Colleen Gordon Deloitte Touche Tohmatsu Sydney +61 2 9322 7661 [email protected] Koji Miwa Deloitte Tohmatsu Consulting Co. Ltd. Tokyo +81 80 4359 3273 [email protected] Eric Peffer Deloitte Consulting Ptd. Ltd. Southeast Asia +65 9030 3303 [email protected] Stanley Dai Deloitte Consulting (Shanghai) Company Limited Shanghai +86 21 61412222 [email protected] For further information, visit our website at www.deloitte.com/2014GOIS Learn more Follow @Deloitte #DeloitteSharedServices Join the conversation
- 69. 24 http://www.deloitte.com/2014GOISCoverContentsExecutive summaryThe sourcing landscapeStructural changeDrivers for changeLocation strategyoffshoringdata privacyManaging changeVendor managementIssue and dispute 1Issue and dispute 2Functions and servicesFinanceLegalReal estateHRCustomer serviceProcurementITConclusionAppendixContact us Button 1: Button 16: Button 15: Button 14: Button 13: Button 12: Button 11: Button 10: Button 9: Button 8: Button 7: Button 5: Button 27: Button 26: Button 25: Button 24: Button 23: Button 22: Button 21: Button 20: Button 19: Button 18: Button 17: Button 50: Page 3: OffPage 41: OffPage 52: OffPage 63: OffPage 74: OffPage 85: OffPage 96: OffPage 107: OffPage 118: OffPage 129: OffPage 1310: OffPage 1411: OffPage 1512: OffPage 1613: OffPage 1714: OffPage 1815: OffPage 1916: OffPage 2017: OffPage 2118: OffPage 2219: OffPage 2320: OffPage 2421: OffButton 49: Page 3: OffPage 41: OffPage 52: OffPage 63: OffPage 74: OffPage 85: OffPage 96: OffPage 107: OffPage 118: OffPage 129: OffPage 1310: OffPage 1411: OffPage 1512: OffPage 1613: OffPage 1714: OffPage 1815: OffPage 1916: OffPage 2017: OffPage 2118: OffPage 2219: OffPage 2320: OffPage 2421: OffButton 48: Page 3: OffPage 41: OffPage 52: OffPage 63: OffPage 74: OffPage 85: OffPage 96: OffPage 107: OffPage 118: OffPage 129: OffPage 1310: OffPage 1411: OffPage 1512: OffPage 1613: OffPage 1714: OffPage 1815: OffPage 1916: OffPage 2017: OffPage 2118: OffPage 2219: OffPage 2320: OffPage 2421: OffButton 47: Page 3: OffPage 41: OffPage 52: OffPage 63: OffPage 74: OffPage 85: OffPage 96: OffPage 107: OffPage 118: OffPage 129: OffPage 1310: OffPage 1411: OffPage 1512: OffPage 1613: OffPage 1714: OffPage 1815: OffPage 1916: OffPage 2017: OffPage 2118: OffPage 2219: OffPage 2320: OffPage 2421: OffButton 46: Page 3: OffPage 41: OffPage 52: OffPage 63: OffPage 74: OffPage 85: OffPage 96: OffPage 107: OffPage
- 70. 118: OffPage 129: OffPage 1310: OffPage 1411: OffPage 1512: OffPage 1613: OffPage 1714: OffPage 1815: OffPage 1916: OffPage 2017: OffPage 2118: OffPage 2219: OffPage 2320: OffPage 2421: OffButton 45: Page 3: OffPage 41: OffPage 52: OffPage 63: OffPage 74: OffPage 85: OffPage 96: OffPage 107: OffPage 118: OffPage 129: OffPage 1310: OffPage 1411: OffPage 1512: OffPage 1613: OffPage 1714: OffPage 1815: OffPage 1916: OffPage 2017: OffPage 2118: OffPage 2219: OffPage 2320: OffPage 2421: OffButton 44: Page 3: OffPage 41: OffPage 52: OffPage 63: OffPage 74: OffPage 85: OffPage 96: OffPage 107: OffPage 118: OffPage 129: OffPage 1310: OffPage 1411: OffPage 1512: OffPage 1613: OffPage 1714: OffPage 1815: OffPage 1916: OffPage 2017: OffPage 2118: OffPage 2219: OffPage 2320: OffPage 2421: OffButton 43: Page 3: OffPage 41: OffPage 52: OffPage 63: OffPage 74: OffPage 85: OffPage 96: OffPage 107: OffPage 118: OffPage 129: OffPage 1310: OffPage 1411: OffPage 1512: OffPage 1613: OffPage 1714: OffPage 1815: OffPage 1916: OffPage 2017: OffPage 2118: OffPage 2219: OffPage 2320: OffPage 2421: OffButton 41: Page 3: OffPage 41: OffPage 52: OffPage 63: OffPage 74: OffPage 85: OffPage 96: OffPage 107: OffPage 118: OffPage 129: OffPage 1310: OffPage 1411: OffPage 1512: OffPage 1613: OffPage 1714: OffPage 1815: OffPage 1916: OffPage 2017: OffPage 2118: OffPage 2219: OffPage 2320: OffPage 2421: OffButton 40: Page 3: OffPage 41: OffPage 52: OffPage 63: OffPage 74: OffPage 85: OffPage 96: OffPage 107: OffPage 118: OffPage 129: OffPage 1310: OffPage 1411: OffPage 1512: OffPage 1613: OffPage 1714: OffPage 1815: OffPage 1916: OffPage 2017: OffPage 2118: OffPage 2219: OffPage 2320: OffPage 2421: OffButton 39: Page 3: OffPage 41: OffPage 52: OffPage 63: OffPage 74: OffPage 85: OffPage 96: OffPage 107: OffPage 118: OffPage 129: OffPage 1310: OffPage 1411: OffPage 1512: OffPage 1613: OffPage 1714: OffPage 1815: OffPage 1916: OffPage 2017: OffPage 2118: OffPage 2219: OffPage 2320: OffPage 2421: OffButton 38: Page 3: OffPage 41: OffPage 52: OffPage 63: OffPage 74:
- 71. OffPage 85: OffPage 96: OffPage 107: OffPage 118: OffPage 129: OffPage 1310: OffPage 1411: OffPage 1512: OffPage 1613: OffPage 1714: OffPage 1815: OffPage 1916: OffPage 2017: OffPage 2118: OffPage 2219: OffPage 2320: OffPage 2421: OffButton 37: Page 3: OffPage 41: OffPage 52: OffPage 63: OffPage 74: OffPage 85: OffPage 96: OffPage 107: OffPage 118: OffPage 129: OffPage 1310: OffPage 1411: OffPage 1512: OffPage 1613: OffPage 1714: OffPage 1815: OffPage 1916: OffPage 2017: OffPage 2118: OffPage 2219: OffPage 2320: OffPage 2421: OffButton 36: Page 3: OffPage 41: OffPage 52: OffPage 63: OffPage 74: OffPage 85: OffPage 96: OffPage 107: OffPage 118: OffPage 129: OffPage 1310: OffPage 1411: OffPage 1512: OffPage 1613: OffPage 1714: OffPage 1815: OffPage 1916: OffPage 2017: OffPage 2118: OffPage 2219: OffPage 2320: OffPage 2421: OffButton 35: Page 3: OffPage 41: OffPage 52: OffPage 63: OffPage 74: OffPage 85: OffPage 96: OffPage 107: OffPage 118: OffPage 129: OffPage 1310: OffPage 1411: OffPage 1512: OffPage 1613: OffPage 1714: OffPage 1815: OffPage 1916: OffPage 2017: OffPage 2118: OffPage 2219: OffPage 2320: OffPage 2421: OffButton 34: Page 3: OffPage 41: OffPage 52: OffPage 63: OffPage 74: OffPage 85: OffPage 96: OffPage 107: OffPage 118: OffPage 129: OffPage 1310: OffPage 1411: OffPage 1512: OffPage 1613: OffPage 1714: OffPage 1815: OffPage 1916: OffPage 2017: OffPage 2118: OffPage 2219: OffPage 2320: OffPage 2421: OffButton 33: Page 3: OffPage 41: OffPage 52: OffPage 63: OffPage 74: OffPage 85: OffPage 96: OffPage 107: OffPage 118: OffPage 129: OffPage 1310: OffPage 1411: OffPage 1512: OffPage 1613: OffPage 1714: OffPage 1815: OffPage 1916: OffPage 2017: OffPage 2118: OffPage 2219: OffPage 2320: OffPage 2421: OffButton 32: Page 3: OffPage 41: OffPage 52: OffPage 63: OffPage 74: OffPage 85: OffPage 96: OffPage 107: OffPage 118: OffPage 129: OffPage 1310: OffPage 1411: OffPage 1512: OffPage 1613: OffPage 1714: OffPage 1815: OffPage 1916: OffPage 2017: OffPage 2118: OffPage 2219: OffPage 2320: OffPage 2421: OffButton 31: Page 3: OffPage
- 72. 41: OffPage 52: OffPage 63: OffPage 74: OffPage 85: OffPage 96: OffPage 107: OffPage 118: OffPage 129: OffPage 1310: OffPage 1411: OffPage 1512: OffPage 1613: OffPage 1714: OffPage 1815: OffPage 1916: OffPage 2017: OffPage 2118: OffPage 2219: OffPage 2320: OffPage 2421: OffButton 30: Page 3: OffPage 41: OffPage 52: OffPage 63: OffPage 74: OffPage 85: OffPage 96: OffPage 107: OffPage 118: OffPage 129: OffPage 1310: OffPage 1411: OffPage 1512: OffPage 1613: OffPage 1714: OffPage 1815: OffPage 1916: OffPage 2017: OffPage 2118: OffPage 2219: OffPage 2320: OffPage 2421: OffButton 29: Page 3: OffPage 41: OffPage 52: OffPage 63: OffPage 74: OffPage 85: OffPage 96: OffPage 107: OffPage 118: OffPage 129: OffPage 1310: OffPage 1411: OffPage 1512: OffPage 1613: OffPage 1714: OffPage 1815: OffPage 1916: OffPage 2017: OffPage 2118: OffPage 2219: OffPage 2320: OffPage 2421: OffButton 28: Page 3: OffPage 41: OffPage 52: OffPage 63: OffPage 74: OffPage 85: OffPage 96: OffPage 107: OffPage 118: OffPage 129: OffPage 1310: OffPage 1411: OffPage 1512: OffPage 1613: OffPage 1714: OffPage 1815: OffPage 1916: OffPage 2017: OffPage 2118: OffPage 2219: OffPage 2320: OffPage 2421: OffButton 51: Button 52: Annual Editions Journal Summary Instructions: 1. Summarize each of the readings in the tables below. 2. You may expand the table to accommodate your information. 3. Write in complete sentences using proper grammar and mechanics. Readings: · Unit 1 in the textbook: Introduction and Social Media and Participation · As Data Overflows Online, Researchers Grapple with Ethics · Wireless Charging at a distance, Moves forward for uBeam · The Secret Life of Data in the Year 2020
- 73. · Unit 2 in the textbook: Social Media · What Will Social Media Look Like in the Future? · Licence to Text · The Truth about Video Games and Gun Violence Main idea of the article: Information presented: List at least five points made by the author 1. 2. 3. 4. 5. Response to the article:
- 74. Reading #1 – As Data Overflows Online, Researchers Grapple with Ethics Reading #2 – Wireless Charging at a distance, Moves forward for uBeam Main idea of the article: Information presented: List at least five points made by the author 1. 2. 3. 4. 5. Response to the article:
- 75. Reading #3 – The Secret Life of Data in the Year 2020 Main idea of the article: Information presented: List at least five points made by the author 1. 2. 3. 4. 5. Response to the article:
- 76. Unit 2 Social Media Reading #4 – What Will Social Media Look Like in the Future? Main idea of the article: Information presented: List at least five points made by the author 1. 2. 3. 4. 5. Response to the article:
- 77. Reading #5 – Licence to Text Main idea of the article: Information presented: List at least five points made by the author 1. 2. 3. 4. 5.
- 78. Response to the article: Reading #6 – The Truth about Video Games and Gun Violence Main idea of the article: Information presented: List at least five points made by the author 1. 2. 3. 4. 5.
- 79. Response to the article: Adapted from Dushkin Online Annual Editions Test Your Knowledge Form http://www.dushkin.com/online/ Chapter 12 IT Strategy and Balanced Scorecard Prepared by Dr. Derek Sedlack, South University Copyright © 2015 John Wiley & Sons, Inc. All rights reserved. Learning Objectives Aligning IT with Business Strategy Balanced Scorecard IT Sourcing and Cloud Strategy
- 80. IT Strategy and Strategic Planning Process IT Strategy and Strategic Planning Process Value Drivers Enhance the value of a product or service to consumers, creating value for the company (such as advanced IT, reliability, and brand reputation). Three general types of Business Value Drivers: Operational Shorter-term factors Financial Medium-term factors Sustainability Long-term factors Chapter 12 Copyright © 2015 John Wiley & Sons, Inc. All rights reserved. IT Strategy and Strategic Planning Process IT Strategic Planning A systematic process for determining what a business should become and how it can best achieve that goal. Reactive Approaches Fail Fail to align IT to real business needs.
- 81. and, as a result Fail to deliver value to the business. Chapter 12 Copyright © 2015 John Wiley & Sons, Inc. All rights reserved. IT Strategy and Strategic Planning Process IT Strategies Support the Business Strategy Four IT Strategic Plan Objectives: Improve management’s understanding of IT opportunities and limitations Assess current performance Identify capacity and human resource requirements Clarify the level of investment required Chapter 12 Copyright © 2015 John Wiley & Sons, Inc. All rights reserved. IT Strategy and Strategic Planning Process IT Deployment Strategies In-house development Systems are developed or other IT work is done in-house, possibly with the help of consulting companies or vendors. Sourcing Onshore: sourced to consulting companies or vendors that are within the same country. Offshoring: work sourced to other countries. Chapter 12 Copyright © 2015 John Wiley & Sons, Inc. All rights reserved. IT Strategy and Strategic Planning Process
- 82. Chapter 12 Figure 12.2 IT strategic planning process. Copyright © 2015 John Wiley & Sons, Inc. All rights reserved. IT Strategy and Strategic Planning Process IT Steering Committee Set the direction Links corporate strategy with the IT strategy, Allocate scarce resources Approves the allocation of resources for and within the information systems organization including outsourcing policy. Make staffing decisions Key IT personnel decisions involve a consultation and approval process made by the committee, including outsourcing decisions. Communicate and provide feedback Information regarding IT activities should flow freely. Set and evaluate performance metrics Establish performance measures for the IT department and see they are met. Chapter 12 Copyright © 2015 John Wiley & Sons, Inc. All rights reserved. IT Strategy and Strategic Planning Process Governance Formally established statements that direct the policies regarding IT alignment with organizational goals and allocation of resources. Long-range IT plan (Strategic IT plan) What IT should do to achieve the goals, objectives, and strategic position of the firm and how this will be achieved.
- 83. The overall direction, requirements, and sourcing of resources. Time frames are set for three to five years into the future. Chapter 12 Copyright © 2015 John Wiley & Sons, Inc. All rights reserved. IT Strategy and Strategic Planning Process Medium-range IT plan Identifies general project plans in terms of the specific requirements and sourcing of resources as well as the project portfolio. Tactical Plan (Short-range) Details budgets and schedules for current-year projects and activities. Chapter 12 Copyright © 2015 John Wiley & Sons, Inc. All rights reserved. IT Strategy and Strategic Planning Process Project Portfolio Lists major resource projects that are consistent with the long- range plan. Applications Portfolio A list of major, approved information system projects that are also consistent with the long-range plan. Chapter 12 Copyright © 2015 John Wiley & Sons, Inc. All rights reserved. IT Strategy and Strategic Planning Process What are value drivers?
- 84. What are the three categories of value drivers? Why do reactive approaches to IT investments fail? What is onshore sourcing? What is the goal of IT–business alignment? Why is IT strategic planning revisited on a regular basis? What are the functions of a steering committee? Describe the IT strategic planning process. Chapter 12 Copyright © 2015 John Wiley & Sons, Inc. All rights reserved. Suggested Answers: 1. Value drivers enhance the value of a product or service to consumers, creating value for the company. Advanced IT, reliability, and brand reputation are examples. 2. Operational (shorter-term factors that impact cash flow and the cash generation ability through increased efficiency or growth), Financial (medium-term factors that minimize the cost of capital incurred by the company to finance operations), and Sustainability (long-term survival factors; factors that enable a business to continue functioning consistently and optimally for a long time.) 3. Two of the biggest risks and concerns of top management are (1) failing to align IT to real business needs and, as a result, (2) failing to deliver value to the business. Reactive IT investments tend to be patches that rarely align with the business strategy. 4. Work or development outsourced to consulting companies or vendors that are within the same country is referred to as onshore sourcing.
- 85. 5. Answers may vary. IT–business alignment means how closely an organization’s IT strategy is interwoven with and driving its overall business strategy. The goal of IT strategic alignment is to ensure that IS priorities, decisions, and projects are consistent with the needs of the entire business. Failure to properly align IT with the organizational strategy can result in large investments in systems that have a low payoff, or not investing in systems that potentially have a high payoff. 6. The business and IT strategic plans are evaluated and adjusted annually to keep pace with rapid changes in the industry. Because organizational goals change over time, it is not sufficient to develop a long-term IT strategy and not re- examine the strategy on a regular basis. For this reason, IT planning is an ongoing process. The IT planning process results in a formal IT strategy or a reassessment each year or each quarter of the existing portfolio of IT resources. 7. The steering committee is a team of managers and staff representing various business units that establish IT priorities and ensure the IT department is meeting the needs of the enterprise. The steering committee’s major tasks are: Set the direction. In linking the corporate strategy with the IT strategy, planning is the key activity. Allocate scarce resources. The committee approves the allocation of resources for and within the information systems organization. This includes outsourcing policy. Make staffing decisions. Key IT personnel decisions involve a consultation-and-approval process made by the committee, including outsourcing decisions. Communicate and provide feedback. Information regarding IT activities should flow freely. Set and evaluate performance metrics. The committee should establish performance measures for the IT department and see that they are met. This includes the initiation of SLAs.
- 86. The success of steering committees largely depends on the establishment of IT governance, formally established statements that direct the policies regarding IT alignment with organizational goals and allocation of resources. 8. Figure 12.2 shows the IT strategic planning process. The entire planning process begins with the creation of a strategic business plan. The long-range IT plan, sometimes referred to as the strategic IT plan, is then based on the strategic business plan. The IT strategic plan starts with the IT vision and strategy, which defines the future concept of what IT should do to achieve the goals, objectives, and strategic position of the firm and how this will be achieved. The overall direction, requirements, and sourcing—either outsourcing or insourcing— of resources, such as infrastructure, application services, data services, security services, IT governance, and management architecture; budget; activities; and timeframes are set for three to five years into the future. The planning process continues by addressing lower-level activities with a shorter time frame. The next level down is a medium-term IT plan, which identifies general project plans in terms of the specific requirements and sourcing of resources as well as the project portfolio. The project portfolio lists major resource projects, including infrastructure, application services, data services, and security services that are consistent with the long-range plan. Some companies may define their portfolio in terms of applications. The applications portfolio is a list of major, approved information system projects that are also consistent with the long-range plan. Expectations for sourcing of resources in the project or applications portfolio should be driven by the business strategy. Since some of these projects will take more than a year to complete, and others will not start in the current year, this plan extends over several years. The third level is a tactical plan, which details budgets and
- 87. schedules for current-year projects and activities. In reality, because of the rapid pace of change in technology and the environment, short-term plans may include major items not anticipated in the other plans. The planning process just described is currently practiced by many organizations. Specifics of the IT planning process, of course, vary among organizations. For example, not all organizations have a high-level IT steering committee. Project priorities may be determined by the IT director, by his or her superior, by company politics, or even on a first-come, first- served basis. The deliverables from the IT planning process should include the following: an evaluation of the strategic goals and directions of the organization and how IT is aligned; a new or revised IT vision and assessment of the state of the IT division; a statement of the strategies, objectives, and policies for the IT division; and the overall direction, requirements, and sourcing of resources. 12 Copyright © 2015 John Wiley & Sons, Inc. All rights reserved. Learning Objectives Aligning IT with Business Strategy Balanced Scorecard IT Sourcing and Cloud Strategy
- 88. IT Strategy and Strategic Planning Process IT Business Alignment Improvement Activities Commitment to IT planning by senior management. CIO is a member of senior management. Understanding IT and corporate planning. Shared culture and good communication. Multilevel links. Chapter 12 Aligning IT with Business Strategy Copyright © 2015 John Wiley & Sons, Inc. All rights reserved. Strength of CIO & C-Suite Relationship Influences Performance Achieve better results. Adapt quickly. Think together. Act together. More aligned on strategy. Chapter 12 Aligning IT with Business Strategy Copyright © 2015 John Wiley & Sons, Inc. All rights reserved.
- 89. CIO Skillset Political savvy Influence, leadership, and power Relationship management Resourcefulness Strategic planning Doing what it takes Leading employees Chapter 12 Aligning IT with Business Strategy Copyright © 2015 John Wiley & Sons, Inc. All rights reserved. IT/Business Alignment CIO drives business change through the use of digital technology, not just supporting business, but introducing profitable new lines of business. Even older organizations, considered traditional and slow- moving, can become agile, even innovative through technology. Chapter 12 Aligning IT with Business Strategy Copyright © 2015 John Wiley & Sons, Inc. All rights reserved. How can IT–business alignment be improved? How does strong collaboration among the CIO and other chief- level officers influence performance? What skills are important to a CIO’s success? How did the CIO of CBA contribute to the bank’s competitiveness? Chapter 12 Aligning IT with Business Strategy
- 90. Copyright © 2015 John Wiley & Sons, Inc. All rights reserved. Suggested Answers: 1. Alignment is a complex management activity, and its complexity increases as the pace of global competition and technological change increases. IT–business alignment can be improved by focusing on the following activities: Commitment to IT planning by senior management. Senior management commitment to IT planning is essential to success. CIO is a member of senior management. The key to achieving IT-business alignment is for the CIO to attain strategic influence. Rather than being narrow technologists, CIOs must be both business and technology savvy. Understanding IT and corporate planning. A prerequisite for effective IT–business alignment for the CIO is to understand business planning and for the CEO and business planners to understand their company's IT planning. Shared culture and good communication. The CIO must understand and buy into the corporate culture so that IS planning does not occur in isolation. Frequent, open, and effective communication is essential to ensure a shared culture and keep everyone aware of planning activities and business dynamics. Multi-level links. Links between business and IT plans should be made at the strategic, tactical, and operational levels. 2. According to PwC’s 5th annual Digital IQ global survey, compared to less collaborative companies, strong collaborators: Achieve better results. They are four times more likely to be top performers than those with less collaborative teams. IT initiatives are more likely to be on time, on budget, and within project scope. Adapt quickly. They adapt quickly to market changes to maintain an advantage over competitors.
- 91. Think together. IT and business leaders share the same understanding of the corporate strategy and the costs needed to implement the strategic road map. They view their CEO as a champion of IT and understand IT risks that may impact the business. Act together. They have explicit processes in place to link the IT road map to the corporate strategy. They invest more aggressively in social, mobile, cloud, and analytics and map IT to strategic initiatives like new product and service development and market share growth. More aligned on strategy. In a majority of strong collaborators (82 percent), the CEO is a champion of IT and actively involves IT in the strategic and operational plans, compared with 54 percent for less collaborative companies. In addition, strong relationships support more frequent and frank conversations about problems and collaborative problem solving. Too many IT projects fail because foundational issues are not dealt with candidly and fast enough. The Digital IQ study clearly shows that strong executive leadership and collaboration are crucial to building lasting value from IT. 3. Skills of CIOs needed to improve IT–business alignment and governance include: Political savvy. Effectively understand managers, workers, and their priorities and use that knowledge to influence others to support organizational objectives. Influence, leadership, and power. Inspire a shared vision and influence subordinates and superiors. Relationship management. Build and maintain working relationships with co-workers and those external to the organization. Negotiate problem solutions without alienating those impacted. Understand others and get their cooperation in non-authority relationships. Resourcefulness. Think strategically and make good decisions under pressure. Can set up complex work systems and engage in flexible problem resolution.
- 92. Strategic planning. Capable of developing long-term objectives and strategies and translating vision into realistic business strategies. Doing what it takes. Persevering in the face of obstacles. Leading employees. Delegating work to employees effectively; broadening employee opportunities; and interacting fairly with employees. 4. Kaching is the mobile, social, and NFC payments apps from CBA. With the success of Kaching, CBA’s CIO Michael Harte had not just supported business activities, he had introduced a profitable new line of business (LeMay, 2013). By leading with mobile, social, NFC technology, CBA has become an innovative financial institution. 18 Copyright © 2015 John Wiley & Sons, Inc. All rights reserved. Learning Objectives Aligning IT with Business Strategy Balanced Scorecard IT Sourcing and Cloud Strategy IT Strategy and Strategic Planning Process
- 93. Balanced Scorecard Old Approach to Business Lagging Indicators P&L, Cash Flow, Balance Sheets Confirm what has happened. Evaluate outcomes and achievements. Represent history, not ideal for managing day-to-day operations and planning. Multidimensional Approach to Business Leading indicators Predict future events to identify opportunities. Chapter 12 Copyright © 2015 John Wiley & Sons, Inc. All rights reserved. Balanced Scorecard Chapter 12 Figure 12.3 Balanced Scorecard (BSC) uses four metrics to measure performance. Copyright © 2015 John Wiley & Sons, Inc. All rights reserved. Balanced Scorecard Balanced Approach Metrics Financial
- 94. Revenue, earnings, asset utilization Customer Market share, Brand image, price-value relationship Business processes Cycle times, cost per process/transaction Innovation, learning and growth Employee skills, IT capabilities, R&D Chapter 12 Copyright © 2015 John Wiley & Sons, Inc. All rights reserved. Balanced Scorecard IT & Business Strategy Alignment through BSC Clarify and update strategy Align IT strategy with business strategy Link strategic objective to long-term goals and annual budgets Chapter 12 Copyright © 2015 John Wiley & Sons, Inc. All rights reserved. Balanced Scorecard Chapter 12 The BSC methodology process. Copyright © 2015 John Wiley & Sons, Inc. All rights reserved. Identify performance metrics Select meaningful objectives Select effective measures and targets
- 95. Revise actions Collect, analyze, and data with targets Implement necessary data collection tools Alignment Balanced Scorecard How did the BSC approach differ from previous measurement approaches? How does the BSC approach “balance” performance measurements? What are the four BSC metrics? Give an example of each BSC metric.
- 96. How does BSC align IT strategy with business strategy? Chapter 12 Copyright © 2015 John Wiley & Sons, Inc. All rights reserved. Suggested Answers: 1. Prior to the BSC concept, the typical business objective could be summed up simply as to make a profit. Performance metrics were based on: P&L (profit and loss) reports: revenue, expenses, net profit Cash flow statements: enough cash to pay its current liabilities Balance sheets that reflected the overall status of finances at a certain date These financial metrics are lagging indicators because they quantify past performance. As such, they represent historical information and are not ideal tools for managing day-to-day operations and planning. What was novel about BSC in the 1990s was that it measured a company’s performance using a multidimensional approach of leading indicators as well as lagging indicators. 2. The BSC method is “balanced” because it does not rely solely on traditional financial measures. Instead, it balances financial measures with three forward-looking nonfinancial measures. 3. Financial. To succeed financially, how should we appear to our investors and shareholders? Customer. To achieve our vision, how should we provide value to our customers? Business processes. To satisfy our shareholders and customers, what business processes must we focus on and excel at? Innovation, learning, and growth. To achieve our vision, how
- 97. will we sustain our ability to innovate, learn, change, and improve? 4. Answers may vary. Metric or Indicator Examples of Measurement Criteria Financial • Revenue and revenue growth rates • Earnings and cash flow • Asset utilization Customer • Market share • Customer acquisition, retention, loyalty • Customer relationships, satisfaction, likes, recommendations, loyalty • Brand image, reputation • Price–value relationship Business • Cycle times, defect rate processes • Production throughput, productivity rates • Cost per process • Cost per transaction Innovation, • Employee skills, morale, turnover, capacity for change learning and • IT capabilities growth • Employee motivation • R&D • Percentage of revenue from new products/services 5. BSC can be used to translate strategic plans and mission statements into a set of objectives and performance metrics that can be quantified and measured. BSC is used to clarify and update the strategy, align the IT strategy with the business strategy, and link strategic objectives to long-term goals and annual budgets. The astute student may realize that the balanced scorecard can
- 98. be applied to link KPIs of IT to business goals to determine the impact on the business. The focus for the assessment could be, for example, the project portfolio or the applications portfolio. The balanced scorecard can be used to assess the IT project portfolio by listing projects along the vertical dimension, and specific measures, critical to what the organization needs to track, horizontally. 25 Copyright © 2015 John Wiley & Sons, Inc. All rights reserved. Learning Objectives Aligning IT with Business Strategy Balanced Scorecard IT Sourcing and Cloud Strategy IT Strategy and Strategic Planning Process
- 99. IT Sourcing and Cloud Strategy Cloud Strategy and Services Cloud Strategy Short for cloud computing IT strategy. Edge Service Term that refers to a cloud service. Tactical Adoption Approach Incremental deployment resulting in apps and services, patched to create end-to-end business processes. Chapter 12 Copyright © 2015 John Wiley & Sons, Inc. All rights reserved. IT Sourcing and Cloud Strategy Cloud Complexity Extensibility The ability to get data into and out of the cloud service. Migration Issues Cybersecurity, privacy, data availability, and service accessibility. Newer Challenges Cloud integration with on-premises resources, extensibility, and reliability. Chapter 12 Copyright © 2015 John Wiley & Sons, Inc. All rights reserved. IT Sourcing and Cloud Strategy Sourcing Driving Factors Generate revenue Increase efficiency Agile enough to respond to market changes Focus on core competency
- 100. Cut operational costs More accepted IT strategy Cloud and SaaS have been proven Move IT from capital to recurring operating expenditure Chapter 12 Copyright © 2015 John Wiley & Sons, Inc. All rights reserved. IT Sourcing and Cloud Strategy Outsourcing Risks Shirking The vendor deliberately underperforms while claiming full payment. Poaching The vendor develops a strategic application for a client and then uses it for other clients. Opportunistic repricing Client enters into a long-term contract with a vendor, the vendor changes financial terms at some point or overcharges for unanticipated enhancements and contract extensions. Chapter 12 Copyright © 2015 John Wiley & Sons, Inc. All rights reserved. IT Sourcing and Cloud Strategy Work Not Readily Offshored Work that has not been routinized. Work that if offshored would result in the client company losing too much control over critical operations. Situations in which offshoring would place the client company at too great a risk to its data security, data privacy, or intellectual property and proprietary information. Business activities that rely on an uncommon combination of
- 101. specific application domain knowledge and IT knowledge in order to do the work properly. Chapter 12 Copyright © 2015 John Wiley & Sons, Inc. All rights reserved. IT Sourcing and Cloud Strategy Outsourcing Lifecycle Chapter 12 Copyright © 2015 John Wiley & Sons, Inc. All rights reserved. Strategy Reassessment Selection Negotiation Implementation Oversight Management Build Completion Change
- 102. Exit IT Sourcing and Cloud Strategy Vendor Selection Criteria Experience with very similar systems of similar size, scope, and requirements; experience with the ITs that are needed,
- 103. integrating those ITs into the existing infrastructure and the customer’s industry. Financial and qualified personnel stability. A vendor’s reputation impacts its stability. Chapter 12 Copyright © 2015 John Wiley & Sons, Inc. All rights reserved. IT Sourcing and Cloud Strategy Focus On Value Not Costs Costs undermine goals. Close relationships are mutually beneficial. Both sides are best served viewing relationship over simple transaction. Before Signing… Do a trial run. Create SLAs. Chapter 12 Copyright © 2015 John Wiley & Sons, Inc. All rights reserved. IT Sourcing and Cloud Strategy What contributes to the complexity of a cloud strategy? How does tactical adoption of cloud services differ from a coordinated cloud strategy? What are the major reasons for sourcing? What types of work are not readily outsourced offshore? When selecting a vendor, what two criteria need to be assessed? What is the risk of an overemphasis on cost when selecting or dealing with an IT vendor? What needs to be done before signing a contract with an IT vendor? Chapter 12
- 104. Copyright © 2015 John Wiley & Sons, Inc. All rights reserved. Suggested Answers: 1. While the concept of cloud is simple, an enterprise’s cloud strategy tends to be quite complex. Cloud is being adopted across more of the enterprise, but mostly in addition to on- premises systems—not as full replacements for them. Hybrid solutions create integration challenges. Cloud services—also referred to as edge services—have to integrate back to core internal systems. 2. Tactical adoption is a short-sighted approach, deploying cloud services incrementally, resulting in apps and services that are patched together to create end-to-end business processes. 3. Enterprises choose outsourcing for several reasons: To generate revenue To increase efficiency To be agile enough to respond to changes in the marketplace To focus on core competency To cut operational costs Because offshoring has become a more accepted IT strategy Because cloud computing and SaaS have proven to be effective IT strategies To move IT investment from a capital expenditure to a recurring operational expenditure To differentiate from competitors—while reducing the burden on the IT organization 4. Based on case studies, the types of work that are not readily offshored include the following: Work that has not been routinized Work that if offshored would result in the client company losing too much control over critical operations
- 105. Situations in which offshoring would place the client company at too great a risk to its data security, data privacy, or intellectual property and proprietary information Business activities that rely on an uncommon combination of specific application-domain knowledge and IT knowledge in order to do the work properly. 5. When selecting a vendor, two criteria to assess first are experience and stability: Experience with very similar systems of similar size, scope, and requirements. Experience with the ITs that are needed, integrating those ITs into the existing infrastructure and the customer’s industry. Financial and qualified personnel stability. A vendor’s reputation impacts its stability. 6. Many corporate customers lose out on the potential benefit of close relationships by an overemphasis on costs instead of value. Ideally, a customer/vendor relationship is a mutually beneficial partnership, and both sides are best served by treating it as such. 7. Vendors often buy hardware or software from other vendors. In order to avoid problems with the primary IT vendor, check secondary suppliers as well. Ask the primary vendor how they will deliver on their promises if the secondary vendors go out of business or otherwise end their relationship. Vendors may offer the option to test their products or services in a pilot study or a small portion of the business to verify that it fits the company’s needs. If the vendor relationship adds value on a small scale, then the system can be rolled out on a larger scale. If the vendor cannot meet the requirements, then the company avoids a failure. Before entering into any service contract with an IT vendor, get a promise of service in writing. By making both parties aware
- 106. of their responsibilities and when they may be held liable for failing to live up to those responsibilities, a strong SLA can help prevent many of the disruptions and dangers that can come with sourcing or migrating to the cloud. The provisions and parameters of the contract are the only protections a company has when terms are not met or the arrangement is terminated. No contract should be signed without a thorough legal review. SLAs are designed to protect the service provider, not the customer, unless the customer takes an informed and active role in the provisions and parameters. There is no template SLA and each cloud solution vendor is unique. Certainly, if a vendor’s SLA is light on details, this alone may be an indicator that the vendor is light on accountability. Additionally, if a sourcing or cloud vendor refuses to improve its SLAs or negotiate vital points, then that vendor should not be considered. 35