Water’s Journey Through the Shale Gas Drilling and Production Processes
Selenium Poster
1. Introduction
The Mancos Shale formations found in the Mesa County area in the
form of sedimentary rock, generate high selenium concentrations
and as a result, selenium loading in water bodies throughout the
region. Selenium is oxidized into Se 6+ and Se 4+ during erosion. It
is through agricultural practices, an important industry in the valley,
that selenium-rich soil is disturbed and oxygenated. This oxidized
form of selenium is readily transported by irrigation into the
groundwater and tributaries to the Colorado and Gunnison Rivers as
well as in the rivers themselves. High selenium levels are then
potentially found in the water bodies running through the area.
According to a 1984-2008 study performed by the U.S. Geological
Survey (USGS), selenium levels found in waterways of the Gunnison
and Colorado Rivers and some tributaries located in Mesa County
are above the 4.6 µg/L Colorado water quality standard based on the
criteria of 5 µg/L set by the Environmental Protection Agency (EPA).
The goal of this study is to measure selenium concentrations and
loadings in the Gunnison River, Colorado River and selected
tributaries in the Grand Valley. As a result, more information on the
selenium concentrations and loading in the Grand Valley will be
produced and available for evaluation in correlation to information
provided in past studies.
Methods
Water Sample Collection
Colorado and Gunnison Rivers: A stream gage was utilized
to attain river discharge measurements. Four water samples
were collected using a Van Dorn bottle along a transect set on
the top of two bridges, one across the Colorado near 32 Road in
Clifton and one across the Gunnison near Colorado 141 near
Whitewater. These four samples were analyzed for pH and
conductivity individually and combined to create a composite
sample for lab analysis.
Tributaries: The depth and width of each tributary was
measured, along with flow using a Global Flow Probe at evenly
spaced intervals along the transect. These measurements were
used to calculate stream discharge. The tributaries were waded
to collect four water samples, analysed for pH and conductivity,
then mixed into a composite sample for lab analysis.
Sample Analysis
Half of each of the samples was filtered in order to have one
filtered and one non-filtered sample. All of the samples were
then acidified to a pH <2.0, reduced to Se 4+ by adding HCl and
heating to 90℃. The samples were analyzed using an
inductively-coupled plasma atomic emission spectrometer (ICP-
AES) to detect the selenium levels present in each sample.
Selenium loading were then calculated and determined.
Discussion
Groundwater is the primary source of water in the tributaries when
they are not being used for irrigation. Water in the tributaries has
more contact time with the Mancos Shale causing high selenium
concentrations to be found before irrigation begins. The high
concentrations of selenium may become diluted enough to reduce
the selenium concentrations below Colorado water quality standards
after irrigation begins. This will cause the crops to be exposed to
high amounts of selenium at the beginning of the irrigation season.
Small amounts of selenium are taken up through plant roots and the
majority is either flushed back into the groundwater or flows into the
rivers through base flow and surface runoff.
The Colorado and Gunnison have high discharges, but also have
enough water within them to dilute the concentrations coming from
the tributaries. This phenomenon results in much lower levels of
selenium found in the rivers, while on the other hand, the tributaries
have a low discharge as well as lower amounts of water, but
increased contact with the surrounding soil. At the time of sampling,
the baseflow in the tributaries was primarily groundwater previously
used for irrigation and in contact with selenium rich soils for long
periods of time. This resulted in high selenium concentrations but
low selenium loadings. The out of compliance concentrations will
remain during the non-irrigation season however, posing a threat to
aquatic life and their predatory birds.
Reducing the source will reduce the concentrations of selenium in
the tributaries. The tributaries can run through wetlands to provide
an environment in which the harmful form of selenium precipitates
out in a low oxygen environment to allow the less soluble and less
harmful form selenium to be trapped within the soil. Farming
practices could be tailored to reduce the release of selenium from
the Mancos Shale. The tributaries could be lined with an
impermeable layer to prevent groundwater from entering the system.
None of these options are economically realistic at this time.
The tributaries are diluted by Gunnison and Colorado Rivers and
thus the reason the rivers are not affected by the tributaries high
concentrations. At this time, the rivers meet EPA criteria and no
action needs taken to meet compliance. Tributaries may meet or
may be closer to compliance with the Colorado water quality
standard when diluted by water added to the base flow during
irrigation season, but needs to be tested.
Results
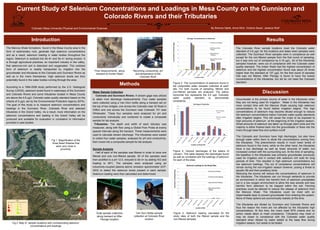
The Colorado River sample locations meet the Colorado water
standard of 4.6 µg/L for the locations and dates when samples were
collected. The Gunnison River samples were in compliance as well
except for the non-filtered sample from the first round of sampling,
but it was only out of compliance by 0.16 µg/L. All of the tributaries
sampled however, were out of compliance with the Colorado water
quality standard. The Indian Wash had the highest concentration of
selenium and the highest concentration found was about 25 times
higher than the standard at 137 µg/L for the first round of samples
that was not filtered. After Persigo is found to have the lowest
concentrations of the tributaries, but stil do not meet the Colorado
standard.
Current Study of Selenium Concentrations and Loadings in Mesa County on the Gunnison and
Colorado Rivers and their Tributaries
By Brenna Hjelle, Anna Rich, Victoria Sauer, Jessica WolfColorado Mesa University Physical and Environmental Sciences
Fig 2. Map of sample locations with corresponding selenium
concentrations and loadings
Fig 2. Use of Van Dorn
Bottle.
Fig1 Sample collection
Figure 5. Selenium loading calculated for the
study sites of both the filtered sample and the
non-filtered samples.
Figure 4. Various discharges of the waters of
concern. This table displays the discharges found
as well as correlated with the loadings of selenium
for each of the sites
Figure 3. The concentrations of selenium found in
the composites water samples collected at each
site. For both rounds of sampling, filtered and
non-filtered samples are analyzed. The yellow
horizontal line represents the 4.6 ug/L Colorado
water quality standard to demonstrate
compliance.
Flow measurements along
transect at Hunter Wash
Recording conductivity, pH
and temperature at the
Colorado River
Grab sample collection
along transect at After
Persigo location
Van Dorn Bottle sample
collection at Colorado River
location
Fig 1. Magnification of the
three Reed Washes that
were very close in
proximity.