Landsat Imagery Reveals Glacier Retreat in Peruvian Andes
•
0 likes•987 views

This document describes a study analyzing glacier area changes in the Nevados Caullaraju and Pastoruri regions of Peru between 1984-2011 using Landsat imagery and ancillary data. Historical Landsat 5 TM images from the dry season were processed to estimate clean and debris-covered glacier areas over time. Normalized difference snow index (NDSI) thresholding was used to delineate clean glaciers, but debris-covered areas were difficult to identify. The results found a significant decrease in glaciated area of 3.3 km2 per decade, consistent with ground-based data. However, errors in estimating total area were around 30% due to challenges in identifying debris-covered glaciers with optical remote sensing alone.
Recommended

Recommended
More Related Content
What's hot
What's hot (20)
Similar to Landsat Imagery Reveals Glacier Retreat in Peruvian Andes
Similar to Landsat Imagery Reveals Glacier Retreat in Peruvian Andes (20)
More from InfoAndina CONDESAN
More from InfoAndina CONDESAN (20)
Landsat Imagery Reveals Glacier Retreat in Peruvian Andes
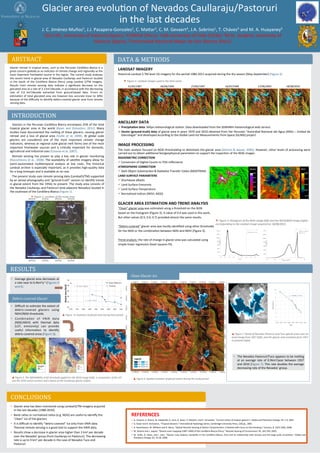
- 1. LANDSAT IMAGERY Historical Landsat-‐5 TM level 1G imagery for the period 1984-‐2011 acquired during the dry season (May-‐September) (Figure 2). ANCILLARY DATA Ø Precipita7on data: Milpo meteorological staJon. Data downloaded from the SEMANHI meteorological web service. Ø Vector (ground-‐truth) data of glacial area in years 1970 and 2010 obtained from the Peruvian “Autoridad Nacional del Agua (ANA) – Unidad de Glaciología” and developed according to the Global Land Ice Measurements from Space (GLIMS) project. IMAGE PROCESSING The main analysis focused on NDSI thresholding to delimitate the glacier area (Silverio & Jaquet, 2005). However, other levels of processing were carried out to obtain addiJonal bio/geophysical parameters to support the inspecJon of the NDSI images. RADIOMETRIC CORRECTION ü Conversion of Digital Counts to TOA reflectance ATMOSPHERIC CORRECTION ü Dark Object SubstracJon & RadiaJve Transfer Codes (MODTRAN) LAND SURFACE PARAMETERS ü Shortwave albedo ü Land Surface Emissivity ü Land Surface Temperature ü Normalized Indices (NDVI, NDSI) GLACIER AREA ESTIMATION AND TREND ANALYSIS “Clean” glacier area was esJmated using a threshold on the NDSI based on the histogram (Figure 3). A value of 0.4 was used in this work, But other values (0.5, 0.6, 0.7) provided almost the same results. “Debris-‐covered” glacier area was hardly idenJfied using other thresholds On the NDSI or the combinaJon between NDSI and NDVI (Figure 3). Trend analysis: the rate of change in glacier area was calculated using simple linear regression (least squares fit). Glacier area evoluJon of Nevados Caullaraju/Pastoruri in the last decades J. C. Jiménez-‐Muñoz1, J.J. Pasapera-‐Gonzales2, C. Majar3, C. M. Gevaert4, J.A. Sobrino1, T. Chávez5 and M. A. Huayaney5 1GCU-‐IPL, University of Valencia (Spain); 2CONIDA (Peru); 3LAB-‐University of Chile (Chile); 4M.Sc. Student, University of Valencia (Spain); 5Universidad Nacional Mayor de San Marcos (Perú) ABSTRACT Glacier retreat in tropical areas, such as the Peruvian Cordillera Blanca is a great concern globally as an indicator of climate change and regionally as the most important freshwater source in the region. The current study analyses the recent trend in glacial area of Nevados Caullaraju and Pastoruri located in the South of the Cordillera Blanca (Peru) using Landsat 5/TM imagery. Results from remote sensing data indicate a significant decrease on the glaciated area at a rate of 3.3 km2/decade, in accordance with the decreasing rate of 3.9 km2/decade extracted from ground-‐based data. Errors on esJmaJon of total glaciated area are however less accurate (near to 30%) because of the difficulty to idenJfy debris-‐covered glacier area from remote sensing data. INTRODUCTION Glaciers in the Peruvian Cordillera Blanca encompass 25% of the total tropical glacier area in the world (Kaser and Osmaston, 2011). Many studies have documented the melJng of these glaciers, causing glacier retreat and a loss of glacial area (Vuille et al, 2008). At global scale glaciers are considered one of the most important climate change indicators, whereas at regional scale glacial melt forms one of the most important freshwater sources and is criJcally important for domesJc, agricultural and industrial uses (Casassa et al, 2007). Remote sensing has proven to play a key role in glacier monitoring (Racoviteanu et al., 2008). The availability of satellite imagery allow for (semi-‐)automated mulJtemporal analysis at low costs. The historical Landsat archive is especially important, as it provides high-‐quality data for a long Jmespan and is available at no cost. The present study uses remote sensing data (Landsat5/TM) supported by an aereal photography and “ground-‐truth” vectors to idenJfy trends in glacial extent from the 1950s to present. The study area consists of the Nevados Caullaraju and Pastoruri (and adjacent Nevados) located in the southeast of the Cordillera Blanca (Figure 1). RESULTS CONCLUSIONS • Glacier area has been monitored using Landsat5/TM imagery acquired in the last decades (1980-‐2010). • Band raJos or normalized raJos (e.g. NDSI) are useful to idenJfy the “clean” ice of the glaciers. • It is difficult to idenJfy “debris-‐covered” ice only from VNIR data. Thermal remote sensing is a good tool to support the VNIR data. • Results show a decrease in glacier area higher than 3 km2 per decade over the Nevados’ group (from Caullaraju to Pastoruri). The decreasing rate is up to 9 km2 per decade in the case of Nevados Tuco and Pastoruri. p Figure 5: The NDVIxNDSI≥-‐0.02 threshold applied to the 2010 image (leA), a comparison of the LST and the 2010 vector (center) and a detail of the Caullaraju glacier (right). ‚ Figure 1: LocaKon of the study area. DATA & METHODS REFERENCES ü G. Casassa, A. Rivera, W. Haeberlib, G. Jone, G. Kaser, P. Ribstein, and C. Schneider, “Current status of Andean glaciers,” Global and Planetary Change, 59, 1-‐9, 2007. ü G. Kaser and H. Osmaston, “Tropical Glaciers;” InternaJonal Hydrology Series, Cambridge University Press, 228 pp., 2001. ü A. Racoviteanu, M. Williams and R. Barry, "OpJcal Remote Sensing of Glacier CharacterisJcs: A Review with Focus on the Himalaya," Sensors, 8, 3355-‐3383, 2008. ü W. Silverio and J. Jaquet, "Glacial cover mapping (1987-‐1996) of the Cordillera Blanca (Peru)," Remote Sensing of Environment, 95, 342-‐350, 2005. ü M. Vuille, G. Kaser, and I. Juen, “Glacier mass balance variability in the Cordillera Blanca, Peru and its relaJonship with climate and the large-‐scale circulaJon,” Global and Planetary Change, 63, 14-‐28, 2008. ‚ Figure 2: Landsat images used in the Kme series 31/05/1987 06/06/1995 27/06/1997 16/07/1998 17/06/2005 18/08/2010 ‚ Figure 3: Histogram of the NDSI image (leA) and the NDVIxNDSI image (right) corresponding to the Landsat image acquired on 18/08/2010. • Average glacial area decreases at a rate near to 0.4km2y-‐1 (Figures 4 and 6). • Difficult to esJmate the extent of debris-‐covered glaciers using NDVI/NDSI thresholds. • CombinaJon of VNIR data (NDSI,NDVI) with thermal data (LST, emissivity) can provide useful informaJon to idenJfy debris-‐covered areas (Figure 5). p Figure 7: Detail of Nevados Pastoruri and Tuco glacial areas over an areal image from 1957 (leA), and the glaciar area evoluKon from 1957 to present (right) p Figure 4: EvoluKon of glacial area during Kme period #* #* Brazil Peru Bolivia Colombia Ecuador LimaLima HuarazHuaraz 65°0'0"W 65°0'0"W 70°0'0"W 70°0'0"W 75°0'0"W 75°0'0"W 80°0'0"W 80°0'0"W 0°0'0" 0°0'0" 5°0'0"S 5°0'0"S 10°0'0"S 10°0'0"S 15°0'0"S 15°0'0"S ± 0 500 1,000250 Km Caullaraju Jenhuaracra Pastoruri Tuco Rajutuna Santon 0 2000 4000 6000 8000 10000 12000 14000 -‐0.8 -‐0.6 -‐0.4 -‐0.2 0 0.2 0.4 0.6 0.8 1 Frequency NDSI Clean glacier ice 0 2000 4000 6000 8000 10000 12000 14000 -‐0.4 -‐0.3 -‐0.2 -‐0.1 0 0.1 Frequency NDVI x NDSI Debris-‐covered glacier ice y = -‐0.0989x + 203.25 2 3 4 5 6 7 8 9 10 1950 1960 1970 1980 1990 2000 2010 2020 Area (km2) Year • The Nevados Pastoruri/Tuco appears to be melJng at an average rate of 0.9km2/year between 1957 and 2010 (Figure 7). This rate doubles the average decreasing rate of the Nevados’ group. p Figure 6: SpaKal evoluKon of glacial extent during the study period Debris-‐covered Glacier Clean Glacier Ice y = -‐0.3934x + 802.84 y = -‐0.3332x + 688.52 10 15 20 25 30 35 1970 1975 1980 1985 1990 1995 2000 2005 2010 Glacial area (km2) Nuevo NDSI>0.4 Vectores LST 30°C -10°C NDVIxNDSI 0.03 -0.25 77°9'0"W 77°9'0"W 77°10'0"W 77°10'0"W 77°11'0"W 77°11'0"W 77°12'0"W 77°12'0"W 77°13'0"W 77°13'0"W 77°14'0"W 77°14'0"W 77°15'0"W 77°15'0"W 77°16'0"W 77°16'0"W 77°17'0"W 77°17'0"W 77°18'0"W 77°18'0"W 9°54'0"S 9°54'0"S 9°55'0"S 9°55'0"S 9°56'0"S 9°56'0"S 9°57'0"S 9°57'0"S 9°58'0"S 9°58'0"S 9°59'0"S 9°59'0"S 10°0'0"S 10°0'0"S 10°1'0"S 10°1'0"S 10°2'0"S 10°2'0"S ± Legend 2010 2005 1998 1997 1995 1987