SlideShare a Scribd company logo
1 of 30
Monitoring the
hydrologic cycle in
the Sierra Nevada
mountains
Photo © Roger J. Wyan Photography
What is the hydrological cycle?
Why do scientists measure the hydrological cycle?
Who we are and where are we located?
How do we calculate the water balance for a tree?
We measure
Collecting and retrieving data.
Effect of increased density of the forest and forest
treatments on water cycle.
What is the hydrologic cycle?
The hydrologic or water cycle is the movement of water
on, above, below, and through the earth’s surface.
Biological
Property
Transpiration
Photosynthesis
Chemical
Property
Precipitation
Dissolution
Physical
Property
Condensation
Evaporation
Energy
Energy transfers
through the water
cycle
Processor Properties of Water
(Adapted from Ripl and Hilmann, 2000)
“Water: the Bloodstream
of the Biosphere”
Why do scientists measure the
hydrologic cycle?
 Weather forecasting
 Water use forecasting
 Understand climate trends
 Flood preparation
 Hydrologic modeling
Why is it important for scientists to
measure the hydrologic cycle?
Who We Are: The Southern Sierra
Critical Zone Observatory
 Professors, students and
staff from over 9 different
universities and institutions
 Main site is located 10 mi E
of Shaver Lake
 Second site in Sequoia
National Park
 3 additional flux tower sites
at different elevations
Image courtesy SSCZO
The Southern Sierra Critical Zone
Observatory
 The Critical Zone lies between rock and sky...
where water, atmosphere, ecosystems, and soils
interact. It is essential to life on Earth, including food
production and water quality. (NSF 2005)
 The SSCZO is one of 10 observatories throughout
the US
 We focus on how the CZ interacts with water
 Key goal: to predict how water budgets and
vegetation will respond to climate change, land
management and disturbance.
4 measurement stations located west to east transect at approx.
800 m elevation intervals beginning at 405 m.
All the sites were on soil developed from granitic parent material,
and had vegetation that had not been disturbed recently.
Four Critical Zone measurement stations in
and around the Upper Kings River basin
. .. .
Illustrated map courtesy Lynn Sullivan
From Goulden et al., 2012
Water Budget
Precipitation (P) =
Evapotranspiration (ET) +
Runoff (Q) +
Recharge (R) +
Change in Storage (ΔS) (can be soil moisture or
groundwater)
P = ET + Q + R + S
P  ET + Q + S
Note: in granitic mountains, such as the Sierra
Nevada, R & ΔSgroundwater are often very small
Precipitation (P)Tree transpiration (T)
Evaporation from soil (E)
Runoff (Q)
Deep percolation (R)
Which are the
stores & which
are the fluxes?
Rainfall Partitioning
Tree image courtesy SSCZO
Groundwater
Atmosphere
Soil Moisture
Infiltration/Recharge (R)
Precipitation
Evapotranspiration
Sublimation
Infiltration
Reservoirs
Runoff
Can one scale up from a
single tree to estimate the
water balance of a forest?
Measuring Streamflow
Flumes make the stream
fit into a known shape.
 Runoff is the movement of water over the land
surface.
 Stream flow is the flow of surface water runoff
contained in a stream channel.
Water depth sensors measure
the height of water.
Photos courtesy SSCZO and USFS
Tipping Bucket
rain gauge
measures liquid
and solid
precipitation
Precipitation measurements
Precipitation is the general
name given for any form of
condensed water that falls to
Earth’s surface.
Snow depth sensors
use sound to record
snow depth
Snow pillow records
weight of snow
Photos courtesy SSCZO and USFS
Measuring
evapotranspiration
 The movement of water from the
liquid phase to the gas phase occurs
by evaporation and/or
transpiration.
 Evaporation is the change of water
from a liquid to a gas by heating.
 Transpiration is water released from
plants.
 Combined, this process is called
evapotranspiration.
Sap flow
Flux tower instruments
Photo © Roger J. Wyan Photography
Photo courtesy SSCZO
Measuring evapotranspiration
The eddy-covariance
flux tower measures
water vapor from the
surrounding forest.
The tower measures:
- wind speed and
direction
- CO2 and H2O gas
concentrations
- air temperature
- relative humidity
- solar radiation
The flux tower
extends high
above the
surrounding forest.
Photo © Roger J. Wyan Photography
Visualizing tree's
heartbeat: A sap-flux
meter monitors a
Critical Zone Tree.
Photo courtesy SSCZO
Measuring soil moisture
Water that does not flow to the
stream channel moves through
the soil and/or rock through a
process called infiltration. This
water is known as groundwater.
Soil moisture sensors
buried at different
depths underground.
A series of soil moisture
sensors buried underground
to understand water uptake
by tree roots.
Photo courtesy SSCZO
Image courtesy SSCZO
Weather stations
This weather station
is used to measure:
- air temperature
- wind speed
- relative humidity
- solar radiation
- precipitation
- snow depth
Peak snow
depth
many years
ago
Photo courtesy SSCZO
Collecting and retrieving data
 An immense amount of data are collected each
year.
 Instruments are located in remote areas, making
it hard to collect data on foot during the winter
Data stored on a
datalogger and can be
downloaded with a laptop
From Kerkez et al., 2012 Photo © Roger J. Wyan Photography
Collecting and retrieving data
The wireless embedded sensor network (WSN) was
developed to make it easier to collect data remotely.
Cell phone on the
flux tower can be
called to retrieve
data.
Small radios send data from one node to the next,
and end at the base station at the flux tower.
Photo © Roger J. Wyan Photography
From Kerkez et al., 2012
Powering instruments
A series of solar
panels and
batteries power all
the instruments
within the basin.
Photo courtesy SSCZO
Photo © Roger J. Wyan Photography
Explore a tree root model by P. Hartsough: https://youtu.be/L9F-QgQb2YY
Fun with Trees:
One large healthy tree can lift up
to 4,000 liters of water from the
ground and release it into the air.
A tree can absorb up to 48 pounds
of carbon dioxide per year and
sequester 1 ton of carbon dioxide
by the time it is 40 years old.
One large tree can provide a day's
supply of oxygen for up to four
people.
By late summer, trees
transpire more water
than we can measure in
the soil. Perhaps there is
a deeper rooting depth.
Excavate the tree to
discover the root system.
Image courtesy SSCZO
TRANSPIRATION
Image courtesy OpenStax
TRANSPIRATION
Stoma open, transpiration
draws water outside the leaf
Roothairs
Water uptake in roots
Cohesion (H-bonds) and
adhesion (to cell walls) in
the xylem draw the water to
the leaves
WaterPotentialGradient
Outside air
Ψ= -10 to -100 MPa
Root xylem
ψ=-0.6MPa
Soil
ψ = -0.3MPa
Trunk xylem ψ=-
0.8MPa
Leaf (cell wall)
Ψ= -1Mpa
Leaf (air spaces)
Ψ= -7MPa
Negative ψ (high)
More negative ψ (low)
Ψ = water potential (units = Pressure)
Image courtesy SSCZO
Sierra National forests have
had a tradition of fire
suppression for the last 100
years.
What might be some of the consequences of fire
suppression?
FOREST HISTORY
Photo by Eric Knapp, USFS
THINNED UNIT WITH CONTROL IN BACKGROUND
STANISLAUS-TUOLUMNE EXPERIMENTAL FOREST
How much water is being
lost due to excess tree
canopies?
How much moisture
is getting caught in
the canopy and
evaporating into the
air?
Photos by Matthew Meadows
Summary
 Water balance is accounting for the partitioning of
precipitation into various fluxes and stores.
 Water accounting can be done on any time step; we
often do it on an annual time step.
 Soil moisture is a store important for tree growth.
 We can do a water balance on a tree (sapflux) or a
forest (flux tower).
 Scaling up from a point measurement involves
making assumptions about spatial patterns.
 Sierra Nevada forests are overgrown.
Complex-forested terrain surrounding P301, with
patchy snow.
Photo by Matthew Meadows

More Related Content

What's hot

Solar ghosts: Weighing the evidence for sunspot cycles in fossil trees
Solar ghosts: Weighing the evidence for sunspot cycles in fossil treesSolar ghosts: Weighing the evidence for sunspot cycles in fossil trees
Solar ghosts: Weighing the evidence for sunspot cycles in fossil treesScott St. George
 
Solar radiation and evapotranspiration
Solar radiation and evapotranspirationSolar radiation and evapotranspiration
Solar radiation and evapotranspirationOmer M. Ahmed
 
The "Year Without A Summer" was not a year without a ring
The "Year Without A Summer" was not a year without a ringThe "Year Without A Summer" was not a year without a ring
The "Year Without A Summer" was not a year without a ringScott St. George
 
Irrigation of Controlled Environment Crops - Nutrients & Stress
Irrigation of Controlled Environment Crops - Nutrients & StressIrrigation of Controlled Environment Crops - Nutrients & Stress
Irrigation of Controlled Environment Crops - Nutrients & StressMETER Group, Inc. USA
 
IonE Frontiers, Through The Trees
IonE Frontiers, Through The TreesIonE Frontiers, Through The Trees
IonE Frontiers, Through The TreesScott St. George
 
Ecological rainfall infrastructure: investment in trees for sustainable devel...
Ecological rainfall infrastructure: investment in trees for sustainable devel...Ecological rainfall infrastructure: investment in trees for sustainable devel...
Ecological rainfall infrastructure: investment in trees for sustainable devel...World Agroforestry (ICRAF)
 
Decadal variability in tree rings
Decadal variability in tree ringsDecadal variability in tree rings
Decadal variability in tree ringsScott St. George
 
Irwin Prairie gw flow regime and drainage pp
Irwin Prairie gw flow regime and drainage ppIrwin Prairie gw flow regime and drainage pp
Irwin Prairie gw flow regime and drainage ppJared Rogers
 
Large-scale dendrochronology and low-frequency climate variability
Large-scale dendrochronology and low-frequency climate variabilityLarge-scale dendrochronology and low-frequency climate variability
Large-scale dendrochronology and low-frequency climate variabilityScott St. George
 
Irrigation Management: Plant-Water Relations and Atmospheric Demand
Irrigation Management: Plant-Water Relations and Atmospheric DemandIrrigation Management: Plant-Water Relations and Atmospheric Demand
Irrigation Management: Plant-Water Relations and Atmospheric DemandMETER Group, Inc. USA
 
The decadal character of northern California's winter precipitation
The decadal character of northern California's winter precipitationThe decadal character of northern California's winter precipitation
The decadal character of northern California's winter precipitationScott St. George
 
Evaporation and transpiration for hydrology subject
Evaporation and transpiration for hydrology subjectEvaporation and transpiration for hydrology subject
Evaporation and transpiration for hydrology subjectMuhammad Sultan
 
Soil Electrical Conductivity: Managing Salts for Sustained High Yields
Soil Electrical Conductivity: Managing Salts for Sustained High YieldsSoil Electrical Conductivity: Managing Salts for Sustained High Yields
Soil Electrical Conductivity: Managing Salts for Sustained High YieldsMETER Group, Inc. USA
 
Examining the coupled effects of land use and climate change ver 1
Examining the coupled effects of land use and climate change ver 1Examining the coupled effects of land use and climate change ver 1
Examining the coupled effects of land use and climate change ver 1World Agroforestry (ICRAF)
 
Hydrology%20 Intro[1]
Hydrology%20 Intro[1]Hydrology%20 Intro[1]
Hydrology%20 Intro[1]mcirillo
 

What's hot (19)

Solar ghosts: Weighing the evidence for sunspot cycles in fossil trees
Solar ghosts: Weighing the evidence for sunspot cycles in fossil treesSolar ghosts: Weighing the evidence for sunspot cycles in fossil trees
Solar ghosts: Weighing the evidence for sunspot cycles in fossil trees
 
Solar radiation and evapotranspiration
Solar radiation and evapotranspirationSolar radiation and evapotranspiration
Solar radiation and evapotranspiration
 
The "Year Without A Summer" was not a year without a ring
The "Year Without A Summer" was not a year without a ringThe "Year Without A Summer" was not a year without a ring
The "Year Without A Summer" was not a year without a ring
 
Irrigation of Controlled Environment Crops - Nutrients & Stress
Irrigation of Controlled Environment Crops - Nutrients & StressIrrigation of Controlled Environment Crops - Nutrients & Stress
Irrigation of Controlled Environment Crops - Nutrients & Stress
 
IonE Frontiers, Through The Trees
IonE Frontiers, Through The TreesIonE Frontiers, Through The Trees
IonE Frontiers, Through The Trees
 
Ecological rainfall infrastructure: investment in trees for sustainable devel...
Ecological rainfall infrastructure: investment in trees for sustainable devel...Ecological rainfall infrastructure: investment in trees for sustainable devel...
Ecological rainfall infrastructure: investment in trees for sustainable devel...
 
Decadal variability in tree rings
Decadal variability in tree ringsDecadal variability in tree rings
Decadal variability in tree rings
 
Irwin Prairie gw flow regime and drainage pp
Irwin Prairie gw flow regime and drainage ppIrwin Prairie gw flow regime and drainage pp
Irwin Prairie gw flow regime and drainage pp
 
Large-scale dendrochronology and low-frequency climate variability
Large-scale dendrochronology and low-frequency climate variabilityLarge-scale dendrochronology and low-frequency climate variability
Large-scale dendrochronology and low-frequency climate variability
 
Irrigation Management: Plant-Water Relations and Atmospheric Demand
Irrigation Management: Plant-Water Relations and Atmospheric DemandIrrigation Management: Plant-Water Relations and Atmospheric Demand
Irrigation Management: Plant-Water Relations and Atmospheric Demand
 
1 introduction to hydrology
1   introduction to hydrology1   introduction to hydrology
1 introduction to hydrology
 
5.2.1 Lecture - Spatial Scales
5.2.1 Lecture - Spatial Scales5.2.1 Lecture - Spatial Scales
5.2.1 Lecture - Spatial Scales
 
The decadal character of northern California's winter precipitation
The decadal character of northern California's winter precipitationThe decadal character of northern California's winter precipitation
The decadal character of northern California's winter precipitation
 
Evaluating the effect of pasture type and grasing intensity
Evaluating the effect of pasture type and grasing intensityEvaluating the effect of pasture type and grasing intensity
Evaluating the effect of pasture type and grasing intensity
 
Evaporation and transpiration for hydrology subject
Evaporation and transpiration for hydrology subjectEvaporation and transpiration for hydrology subject
Evaporation and transpiration for hydrology subject
 
Soil Electrical Conductivity: Managing Salts for Sustained High Yields
Soil Electrical Conductivity: Managing Salts for Sustained High YieldsSoil Electrical Conductivity: Managing Salts for Sustained High Yields
Soil Electrical Conductivity: Managing Salts for Sustained High Yields
 
Examining the coupled effects of land use and climate change ver 1
Examining the coupled effects of land use and climate change ver 1Examining the coupled effects of land use and climate change ver 1
Examining the coupled effects of land use and climate change ver 1
 
Hydrology%20 Intro[1]
Hydrology%20 Intro[1]Hydrology%20 Intro[1]
Hydrology%20 Intro[1]
 
Evaluation of evapotranspiration
Evaluation of evapotranspirationEvaluation of evapotranspiration
Evaluation of evapotranspiration
 

Similar to 5.1.1 Lecture - Forest Water Budgets

Eops 2017 7_24
Eops 2017 7_24Eops 2017 7_24
Eops 2017 7_24EOPS EOPS
 
Chapter 4 groundwater hydrology
Chapter 4 groundwater hydrologyChapter 4 groundwater hydrology
Chapter 4 groundwater hydrologyMohammed Salahat
 
Hydrologic Cycle
Hydrologic  CycleHydrologic  Cycle
Hydrologic Cycletnewberry
 
Chapter4groundwaterhydrology 130630055824-phpapp02
Chapter4groundwaterhydrology 130630055824-phpapp02Chapter4groundwaterhydrology 130630055824-phpapp02
Chapter4groundwaterhydrology 130630055824-phpapp02Cleophas Rwemera
 
Eops 2017 8_28
Eops 2017 8_28Eops 2017 8_28
Eops 2017 8_28EOPS EOPS
 
NISAR NASA-ISRO Synthetic Aperture Radar (NISAR) Drought and Groundwater With...
NISAR NASA-ISRO Synthetic Aperture Radar (NISAR) Drought and Groundwater With...NISAR NASA-ISRO Synthetic Aperture Radar (NISAR) Drought and Groundwater With...
NISAR NASA-ISRO Synthetic Aperture Radar (NISAR) Drought and Groundwater With...Dr. Pankaj Dhussa
 
EOPS_2018_11_06.pdf
EOPS_2018_11_06.pdfEOPS_2018_11_06.pdf
EOPS_2018_11_06.pdfEOPS EOPS
 
5.1.2 Lecture - Waterbudgets for Sierra Nevada catchments
5.1.2 Lecture - Waterbudgets for Sierra Nevada catchments5.1.2 Lecture - Waterbudgets for Sierra Nevada catchments
5.1.2 Lecture - Waterbudgets for Sierra Nevada catchmentsSERC at Carleton College
 
EOPS_2019_03_26.pdf
EOPS_2019_03_26.pdfEOPS_2019_03_26.pdf
EOPS_2019_03_26.pdfEOPS EOPS
 
Hydrosphere Presentation
Hydrosphere PresentationHydrosphere Presentation
Hydrosphere Presentation090966
 
Hydrosphere Presentation
Hydrosphere PresentationHydrosphere Presentation
Hydrosphere Presentation090966
 
diapositivas de introduccion a la hidrología y balance hidrológico
diapositivas de introduccion a la hidrología y balance hidrológicodiapositivas de introduccion a la hidrología y balance hidrológico
diapositivas de introduccion a la hidrología y balance hidrológicoterezamusolini453
 
A typicla hydrological report for engineering projects
A typicla hydrological report for engineering projects A typicla hydrological report for engineering projects
A typicla hydrological report for engineering projects Arkan Hamza Gardi
 
The hydrological-cycle
The hydrological-cycleThe hydrological-cycle
The hydrological-cyclePawan Kushwah
 
Eops 2016 11_22
Eops 2016 11_22Eops 2016 11_22
Eops 2016 11_22EOPS EOPS
 
Chapter2hydrologiccycle 130630055458-phpapp02
Chapter2hydrologiccycle 130630055458-phpapp02Chapter2hydrologiccycle 130630055458-phpapp02
Chapter2hydrologiccycle 130630055458-phpapp02Cleophas Rwemera
 
Fall bulletin 2007 ~ save the redwoods league
Fall bulletin 2007 ~ save the redwoods leagueFall bulletin 2007 ~ save the redwoods league
Fall bulletin 2007 ~ save the redwoods league6D45520z848622K444
 

Similar to 5.1.1 Lecture - Forest Water Budgets (20)

The water cycle
The water cycleThe water cycle
The water cycle
 
Eops 2017 7_24
Eops 2017 7_24Eops 2017 7_24
Eops 2017 7_24
 
Chapter 4 groundwater hydrology
Chapter 4 groundwater hydrologyChapter 4 groundwater hydrology
Chapter 4 groundwater hydrology
 
Hydrologic Cycle
Hydrologic  CycleHydrologic  Cycle
Hydrologic Cycle
 
Chapter4groundwaterhydrology 130630055824-phpapp02
Chapter4groundwaterhydrology 130630055824-phpapp02Chapter4groundwaterhydrology 130630055824-phpapp02
Chapter4groundwaterhydrology 130630055824-phpapp02
 
Water education ppt
Water education pptWater education ppt
Water education ppt
 
Eops 2017 8_28
Eops 2017 8_28Eops 2017 8_28
Eops 2017 8_28
 
NISAR NASA-ISRO Synthetic Aperture Radar (NISAR) Drought and Groundwater With...
NISAR NASA-ISRO Synthetic Aperture Radar (NISAR) Drought and Groundwater With...NISAR NASA-ISRO Synthetic Aperture Radar (NISAR) Drought and Groundwater With...
NISAR NASA-ISRO Synthetic Aperture Radar (NISAR) Drought and Groundwater With...
 
EOPS_2018_11_06.pdf
EOPS_2018_11_06.pdfEOPS_2018_11_06.pdf
EOPS_2018_11_06.pdf
 
Water Chapter 1 Fetter - Applied Hydrogeology
Water Chapter 1 Fetter - Applied Hydrogeology Water Chapter 1 Fetter - Applied Hydrogeology
Water Chapter 1 Fetter - Applied Hydrogeology
 
5.1.2 Lecture - Waterbudgets for Sierra Nevada catchments
5.1.2 Lecture - Waterbudgets for Sierra Nevada catchments5.1.2 Lecture - Waterbudgets for Sierra Nevada catchments
5.1.2 Lecture - Waterbudgets for Sierra Nevada catchments
 
EOPS_2019_03_26.pdf
EOPS_2019_03_26.pdfEOPS_2019_03_26.pdf
EOPS_2019_03_26.pdf
 
Hydrosphere Presentation
Hydrosphere PresentationHydrosphere Presentation
Hydrosphere Presentation
 
Hydrosphere Presentation
Hydrosphere PresentationHydrosphere Presentation
Hydrosphere Presentation
 
diapositivas de introduccion a la hidrología y balance hidrológico
diapositivas de introduccion a la hidrología y balance hidrológicodiapositivas de introduccion a la hidrología y balance hidrológico
diapositivas de introduccion a la hidrología y balance hidrológico
 
A typicla hydrological report for engineering projects
A typicla hydrological report for engineering projects A typicla hydrological report for engineering projects
A typicla hydrological report for engineering projects
 
The hydrological-cycle
The hydrological-cycleThe hydrological-cycle
The hydrological-cycle
 
Eops 2016 11_22
Eops 2016 11_22Eops 2016 11_22
Eops 2016 11_22
 
Chapter2hydrologiccycle 130630055458-phpapp02
Chapter2hydrologiccycle 130630055458-phpapp02Chapter2hydrologiccycle 130630055458-phpapp02
Chapter2hydrologiccycle 130630055458-phpapp02
 
Fall bulletin 2007 ~ save the redwoods league
Fall bulletin 2007 ~ save the redwoods leagueFall bulletin 2007 ~ save the redwoods league
Fall bulletin 2007 ~ save the redwoods league
 

More from SERC at Carleton College

StatVignette03_Sig.Figs_v04_07_15_2020.pptx
StatVignette03_Sig.Figs_v04_07_15_2020.pptxStatVignette03_Sig.Figs_v04_07_15_2020.pptx
StatVignette03_Sig.Figs_v04_07_15_2020.pptxSERC at Carleton College
 
Cretaceous Coatlines and Modern Voting Patterns Presentation
Cretaceous Coatlines and Modern Voting Patterns PresentationCretaceous Coatlines and Modern Voting Patterns Presentation
Cretaceous Coatlines and Modern Voting Patterns PresentationSERC at Carleton College
 
Presentation: Unit 1 Introduction to the hydrological cycle
Presentation: Unit 1 Introduction to the hydrological cyclePresentation: Unit 1 Introduction to the hydrological cycle
Presentation: Unit 1 Introduction to the hydrological cycleSERC at Carleton College
 
KSKL_Chapter 4_ Chem Properties of Soils.pptx
KSKL_Chapter 4_ Chem Properties of Soils.pptxKSKL_Chapter 4_ Chem Properties of Soils.pptx
KSKL_Chapter 4_ Chem Properties of Soils.pptxSERC at Carleton College
 
Presentation: Unit 3 background information
Presentation: Unit 3 background informationPresentation: Unit 3 background information
Presentation: Unit 3 background informationSERC at Carleton College
 
Presentation: Unit 2 Measuring Groundwater Background Information
Presentation: Unit 2 Measuring Groundwater Background InformationPresentation: Unit 2 Measuring Groundwater Background Information
Presentation: Unit 2 Measuring Groundwater Background InformationSERC at Carleton College
 

More from SERC at Carleton College (20)

StatVignette03_Sig.Figs_v04_07_15_2020.pptx
StatVignette03_Sig.Figs_v04_07_15_2020.pptxStatVignette03_Sig.Figs_v04_07_15_2020.pptx
StatVignette03_Sig.Figs_v04_07_15_2020.pptx
 
StatVignette06_HypTesting.pptx
StatVignette06_HypTesting.pptxStatVignette06_HypTesting.pptx
StatVignette06_HypTesting.pptx
 
Unit 1 (optional slides)
Unit 1 (optional slides)Unit 1 (optional slides)
Unit 1 (optional slides)
 
Cretaceous Coatlines and Modern Voting Patterns Presentation
Cretaceous Coatlines and Modern Voting Patterns PresentationCretaceous Coatlines and Modern Voting Patterns Presentation
Cretaceous Coatlines and Modern Voting Patterns Presentation
 
Climate and Biomes PPT 2
Climate and Biomes PPT 2Climate and Biomes PPT 2
Climate and Biomes PPT 2
 
weather tracking ppt
weather tracking pptweather tracking ppt
weather tracking ppt
 
Presentation: Unit 1 Introduction to the hydrological cycle
Presentation: Unit 1 Introduction to the hydrological cyclePresentation: Unit 1 Introduction to the hydrological cycle
Presentation: Unit 1 Introduction to the hydrological cycle
 
StatVignette05_M3_v02_10_21_2020.pptx
StatVignette05_M3_v02_10_21_2020.pptxStatVignette05_M3_v02_10_21_2020.pptx
StatVignette05_M3_v02_10_21_2020.pptx
 
KSKL chapter 8 PPT
KSKL chapter 8 PPTKSKL chapter 8 PPT
KSKL chapter 8 PPT
 
KSKL chap 5 PPT
KSKL chap 5 PPTKSKL chap 5 PPT
KSKL chap 5 PPT
 
KSKL_Chapter 4_ Chem Properties of Soils.pptx
KSKL_Chapter 4_ Chem Properties of Soils.pptxKSKL_Chapter 4_ Chem Properties of Soils.pptx
KSKL_Chapter 4_ Chem Properties of Soils.pptx
 
Degraded Soil Images.pptx
Degraded Soil Images.pptxDegraded Soil Images.pptx
Degraded Soil Images.pptx
 
Educators PPT file chapter 7
Educators PPT file chapter 7Educators PPT file chapter 7
Educators PPT file chapter 7
 
Educators PPT file chapter 2
Educators PPT file chapter 2Educators PPT file chapter 2
Educators PPT file chapter 2
 
Educators PPT file chapter 6
Educators PPT file chapter 6Educators PPT file chapter 6
Educators PPT file chapter 6
 
Educators PPT chapter 3
Educators PPT chapter 3Educators PPT chapter 3
Educators PPT chapter 3
 
Unit 4 background presentation
Unit 4 background presentationUnit 4 background presentation
Unit 4 background presentation
 
Presentation: Unit 3 background information
Presentation: Unit 3 background informationPresentation: Unit 3 background information
Presentation: Unit 3 background information
 
Presentation: Unit 2 Measuring Groundwater Background Information
Presentation: Unit 2 Measuring Groundwater Background InformationPresentation: Unit 2 Measuring Groundwater Background Information
Presentation: Unit 2 Measuring Groundwater Background Information
 
Introduction to GPS presentation
Introduction to GPS presentationIntroduction to GPS presentation
Introduction to GPS presentation
 

5.1.1 Lecture - Forest Water Budgets

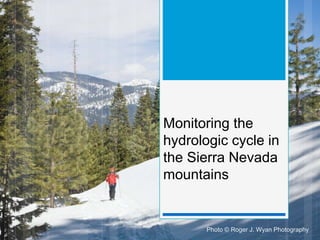
  • 1. Monitoring the hydrologic cycle in the Sierra Nevada mountains Photo © Roger J. Wyan Photography
  • 2. What is the hydrological cycle? Why do scientists measure the hydrological cycle? Who we are and where are we located? How do we calculate the water balance for a tree? We measure Collecting and retrieving data. Effect of increased density of the forest and forest treatments on water cycle.
  • 3. What is the hydrologic cycle? The hydrologic or water cycle is the movement of water on, above, below, and through the earth’s surface.
  • 4. Biological Property Transpiration Photosynthesis Chemical Property Precipitation Dissolution Physical Property Condensation Evaporation Energy Energy transfers through the water cycle Processor Properties of Water (Adapted from Ripl and Hilmann, 2000) “Water: the Bloodstream of the Biosphere”
  • 5. Why do scientists measure the hydrologic cycle?  Weather forecasting  Water use forecasting  Understand climate trends  Flood preparation  Hydrologic modeling Why is it important for scientists to measure the hydrologic cycle?
  • 6. Who We Are: The Southern Sierra Critical Zone Observatory  Professors, students and staff from over 9 different universities and institutions  Main site is located 10 mi E of Shaver Lake  Second site in Sequoia National Park  3 additional flux tower sites at different elevations Image courtesy SSCZO
  • 7. The Southern Sierra Critical Zone Observatory  The Critical Zone lies between rock and sky... where water, atmosphere, ecosystems, and soils interact. It is essential to life on Earth, including food production and water quality. (NSF 2005)  The SSCZO is one of 10 observatories throughout the US  We focus on how the CZ interacts with water  Key goal: to predict how water budgets and vegetation will respond to climate change, land management and disturbance.
  • 8. 4 measurement stations located west to east transect at approx. 800 m elevation intervals beginning at 405 m. All the sites were on soil developed from granitic parent material, and had vegetation that had not been disturbed recently. Four Critical Zone measurement stations in and around the Upper Kings River basin . .. . Illustrated map courtesy Lynn Sullivan From Goulden et al., 2012
  • 9. Water Budget Precipitation (P) = Evapotranspiration (ET) + Runoff (Q) + Recharge (R) + Change in Storage (ΔS) (can be soil moisture or groundwater) P = ET + Q + R + S P  ET + Q + S Note: in granitic mountains, such as the Sierra Nevada, R & ΔSgroundwater are often very small
  • 10. Precipitation (P)Tree transpiration (T) Evaporation from soil (E) Runoff (Q) Deep percolation (R) Which are the stores & which are the fluxes? Rainfall Partitioning Tree image courtesy SSCZO Groundwater Atmosphere Soil Moisture Infiltration/Recharge (R)
  • 11. Precipitation Evapotranspiration Sublimation Infiltration Reservoirs Runoff Can one scale up from a single tree to estimate the water balance of a forest?
  • 12. Measuring Streamflow Flumes make the stream fit into a known shape.  Runoff is the movement of water over the land surface.  Stream flow is the flow of surface water runoff contained in a stream channel. Water depth sensors measure the height of water. Photos courtesy SSCZO and USFS
  • 13. Tipping Bucket rain gauge measures liquid and solid precipitation Precipitation measurements Precipitation is the general name given for any form of condensed water that falls to Earth’s surface. Snow depth sensors use sound to record snow depth Snow pillow records weight of snow Photos courtesy SSCZO and USFS
  • 14. Measuring evapotranspiration  The movement of water from the liquid phase to the gas phase occurs by evaporation and/or transpiration.  Evaporation is the change of water from a liquid to a gas by heating.  Transpiration is water released from plants.  Combined, this process is called evapotranspiration. Sap flow Flux tower instruments Photo © Roger J. Wyan Photography Photo courtesy SSCZO
  • 15. Measuring evapotranspiration The eddy-covariance flux tower measures water vapor from the surrounding forest. The tower measures: - wind speed and direction - CO2 and H2O gas concentrations - air temperature - relative humidity - solar radiation The flux tower extends high above the surrounding forest. Photo © Roger J. Wyan Photography
  • 16. Visualizing tree's heartbeat: A sap-flux meter monitors a Critical Zone Tree. Photo courtesy SSCZO
  • 17. Measuring soil moisture Water that does not flow to the stream channel moves through the soil and/or rock through a process called infiltration. This water is known as groundwater. Soil moisture sensors buried at different depths underground. A series of soil moisture sensors buried underground to understand water uptake by tree roots. Photo courtesy SSCZO Image courtesy SSCZO
  • 18. Weather stations This weather station is used to measure: - air temperature - wind speed - relative humidity - solar radiation - precipitation - snow depth Peak snow depth many years ago Photo courtesy SSCZO
  • 19. Collecting and retrieving data  An immense amount of data are collected each year.  Instruments are located in remote areas, making it hard to collect data on foot during the winter Data stored on a datalogger and can be downloaded with a laptop From Kerkez et al., 2012 Photo © Roger J. Wyan Photography
  • 20. Collecting and retrieving data The wireless embedded sensor network (WSN) was developed to make it easier to collect data remotely. Cell phone on the flux tower can be called to retrieve data. Small radios send data from one node to the next, and end at the base station at the flux tower. Photo © Roger J. Wyan Photography From Kerkez et al., 2012
  • 21. Powering instruments A series of solar panels and batteries power all the instruments within the basin. Photo courtesy SSCZO Photo courtesy SSCZO Photo © Roger J. Wyan Photography
  • 22. Explore a tree root model by P. Hartsough: https://youtu.be/L9F-QgQb2YY Fun with Trees: One large healthy tree can lift up to 4,000 liters of water from the ground and release it into the air. A tree can absorb up to 48 pounds of carbon dioxide per year and sequester 1 ton of carbon dioxide by the time it is 40 years old. One large tree can provide a day's supply of oxygen for up to four people. By late summer, trees transpire more water than we can measure in the soil. Perhaps there is a deeper rooting depth. Excavate the tree to discover the root system. Image courtesy SSCZO
  • 24. TRANSPIRATION Stoma open, transpiration draws water outside the leaf Roothairs Water uptake in roots Cohesion (H-bonds) and adhesion (to cell walls) in the xylem draw the water to the leaves WaterPotentialGradient Outside air Ψ= -10 to -100 MPa Root xylem ψ=-0.6MPa Soil ψ = -0.3MPa Trunk xylem ψ=- 0.8MPa Leaf (cell wall) Ψ= -1Mpa Leaf (air spaces) Ψ= -7MPa Negative ψ (high) More negative ψ (low) Ψ = water potential (units = Pressure) Image courtesy SSCZO
  • 25. Sierra National forests have had a tradition of fire suppression for the last 100 years. What might be some of the consequences of fire suppression? FOREST HISTORY
  • 26. Photo by Eric Knapp, USFS THINNED UNIT WITH CONTROL IN BACKGROUND STANISLAUS-TUOLUMNE EXPERIMENTAL FOREST
  • 27. How much water is being lost due to excess tree canopies? How much moisture is getting caught in the canopy and evaporating into the air? Photos by Matthew Meadows
  • 28.
  • 29. Summary  Water balance is accounting for the partitioning of precipitation into various fluxes and stores.  Water accounting can be done on any time step; we often do it on an annual time step.  Soil moisture is a store important for tree growth.  We can do a water balance on a tree (sapflux) or a forest (flux tower).  Scaling up from a point measurement involves making assumptions about spatial patterns.  Sierra Nevada forests are overgrown.
  • 30. Complex-forested terrain surrounding P301, with patchy snow. Photo by Matthew Meadows

Editor's Notes

  1. Photo Credit: Roger J Wyan Photography http://www.rogerwyan.com
  2. BACKGROUND FOR INSTRUCTOR Why are forests so important when studying the hydrologic cycle? 1. SCALE. Forest occupy about 1/3 of the earth's land area. 2. LEAVES. Tree leaves account for > 2/3 of the leaf area of land plants; therefore, they play a very important role in terrestrial hydrology. Leaves also can impact local humidity levels. 3. ROOTS. Extensive root systems stabilize soil. They affect water movement in soil through the capillary process. 4. VASCULAR SYSTEM. This system creates a soil-plant-atmosphere continuum moving large amounts of water from the soil though the plant and into the atmosphere. 5. CANOPY. Intercepts precipitation
  3. To understand the hydrologic cycle, one must think about “pools” and “fluxes”.  A movement of water through the different spheres of the earths systems: atmosphere, biosphere, hydrosphere, and lithosphere. A pool within the water cycle refers to any storage area for water in any form.  Pools include: oceans, lakes, rivers, streams, marshes, bays, ice sheets, glaciers, clouds, and ground water.  Fluxes are the transfer processes that are involved in the cycle.  Evaporation and precipitation are the major transfer processes that move water from the surface to the atmosphere (evaporation) and from the atmosphere to the surface (precipitation).  Whereas evaporation converts liquid water into water vapor, condensation is the opposite process.  Water vapor in the atmosphere condenses to form liquid water within clouds and eventually becomes precipitation.  Surface runoff moves water across land, while infiltration and percolation moves water down into the soil.  Transpiration is evaporation of water from plant surfaces; it moves soil water back into the atmosphere.  The volume of the reservoirs remain constant. Residence time = volume of reservoir/total flux Solar energy drives the hydrologic cycle, and physical processes are the most important ones in this cycle.  However, water does cycle through the biological community.  Organisms gain the water they need from the food they eat and/or from water available in their environment.  Water leaves living things either in biomass, in wastes, or as water vapor as evaporation occurs.  Check out this reference and animated water cycle http://online.wvu.edu/Faculty/demo/Module_2/hydrologic.html A fun water cycle site http://www.discoverwater.org/water-cycle/ and more games here http://www.discoverwater.org/meet-bridger/
  4. Physical, chemical, biology properties transfer Solar Energy through the water cycle like cogs in a wheel. Sun from openclipart.org ‘Water is the basis of our nature: the most important liquor of life is the most precious agent also to mankind. No wonder that this mysterious agent is compared to blood. Ubiquitous and appearing in the form of vapour, of a liquid and as frozen ice, forming the most wonderful crystals.” ‘Water, the bloodstream of the biosphere, determines the sustainability of living systems. The essential role of water is expanded in a conceptual model of energy dissipation, based on the water balance of whole landscapes. In this model, the underlying role of water phase changes—and their energy-dissipative properties—in the function and the self-organized development of natural systems is explicitly recognized. The energy-dissipating processes regulate the ecological dynamics within the Earth’s biosphere, in such a way that the development of natural systems is never allowed to proceed in an undirected or random way. A fundamental characteristic of self-organized development in natural systems is the increasing role of cyclic processes while loss processes are correspondingly reduced. This gives a coincidental increase in system efficiency, which is the basis of growing stability and sustainability. Growing sustainability can be seen as an increase of ecological efficiency, which is applicable at all levels up to whole landscapes. Criteria for necessary changes in society and for the design of the measures that are necessary to restore sustainable landscapes and waters are derived.” “Water is the basis of our nature: the most important liquor of life is the most precious agent also to mankind. No wonder that this mysterious agent is compared to blood. Ubiquitous and appearing in the form of vapour, of a liquid and as frozen ice, forming the most wonderful crystals.” Resonate
  5. Forest thinning for fire and water management
  6. Goulden, M. L., R. G. Anderson, R. C. Bales, A. E. Kelly, M. Meadows, and G. C. Winston (2012), Evapotranspiration along an elevation gradient in California's Sierra Nevada, J. Geophys. Res., 117, G03028, doi:10.1029/2012JG002027. Color Map on Right: False color Landsat 5 Thematic Mapper image for September 4, 2011 (red is band 5, green is band 4, blue is band 3). The scale bar is km, and the blue polygon is the Upper Kings River watershed. Pine Flat Reservoir is near the southwestern edge of the watershed and the city of Fresno is in the southwestern corner of the image. The straight white lines connect the locations of the eddy covariance sites. The inset graph shows the elevation profiles along the segments of the eddy covariance transect.
  7. Yet the exercise also wishes us to discuss soil characteristics https://water.usgs.gov/edu/watercycleinfiltration.html Anywhere in the world, a portion of the water that falls as rain and snow infiltrates into the subsurface soil and rock. How much infiltrates depends greatly on a number of factors. Infiltration of precipitation falling on the ice cap of Greenland might be very small, whereas, as this picture of a stream disappearing into a cave in southern Georgia, USA shows, a stream can act as a direct funnel right into groundwater! Some water that infiltrates will remain in the shallow soil layer, where it will gradually move vertically and horizontally through the soil and subsurface material. Eventually, it might enter a stream by seepage into the stream bank. Some of the water may infiltrate deeper, recharging groundwater aquifers. If the aquifers are porous enough to allow water to move freely through it, people can drill wells into the aquifer and use the water for their purposes. Water may travel long distances or remain in groundwater storage for long periods before returning to the surface or seeping into other water bodies, such as streams and the oceans. Factors affecting infiltration Precipitation: The greatest factor controlling infiltration is the amount and characteristics (intensity, duration, etc.) of precipitation that falls as rain or snow. Precipitation that infiltrates into the ground often seeps into streambeds over an extended period of time, thus a stream will often continue to flow when it hasn't rained for a long time and where there is no direct runoff from recent precipitation. Soil characteristics: Some soils, such as clays, absorb less water at a slower rate than sandy soils. Soils absorbing less water result in more runoff overland into streams. Soil saturation: Like a wet sponge, soil already saturated from previous rainfall can't absorb much more ... thus more rainfall will become surface runoff. Land cover: Some land covers have a great impact on infiltration and rainfall runoff. Vegetation can slow the movement of runoff, allowing more time for it to seep into the ground. Impervious surfaces, such as parking lots, roads, and developments, act as a "fast lane" for rainfall - right into storm drains that drain directly into streams. Agriculture and the tillage of land also changes the infiltration patterns of a landscape. Water that, in natural conditions, infiltrated directly into soil now runs off into streams. Slope of the land: Water falling on steeply-sloped land runs off more quickly and infiltrates less than water falling on flat land. Evapotranspiration: Some infiltration stays near the land surface, which is where plants put down their roots. Plants need this shallow groundwater to grow, and, by the process of evapotranspiration, water is moved back into the atmosphere.
  8. Sun and tree images from openclipart.org. Think of a forest instead of a single tree. Can we scale up? Trees radiate heat. They are warmer that the snow. There is increased sublimation in denser forests. Furthermore snow melts out early around a tree trunk, but can last weeks or months longer away from the canopy or ion a shady spot nearby. Think about the annual cycle, most of the precipitation coming as snow, it melting, infiltrating and creating runoff which fill our reservoirs, providing water for agriculture (irrigation), domestic & industrial use & environmental flows (water in rivers for ecosystems)
  9. Embedded sensor networks of snow-pingers instruments which measure the distance from a solid surface - the top of the surface of the snow to the ground. These sensors are located at various locations in the catchment. They measure how much snow are being melted from (or added to) surfaces of the ground during the course of the water/snow season. The ultrasonic depth sensor measures distance by “pinging” the surface with an ultrasonic pulse. The time required for that pulse to return is used to calculate distance traveled to the target surface and back. An air temperature sensor connects the measurement to account for changes in air density. Distance to target (m) = 0.5 [ time(s) * Sound (m*s-1) ] where Sound is the speed of sound, corrected for air temperature Knowing the distance to the bare ground surface, the snow depth is determined as follows: distance to ground-distance to snow=snow depth
  10. http://www.rogerwyan.com
  11. Heat-pulse methods date back to the work of Huber (1932) who first conceived the idea of using heat as a tracer of sap flow. Later, Marshall (1958) developed a theoretical framework for heat-pulse, based on a set of analytical solutions to the following heat flow equation, to read more check out this website http://www.tranzflo.co.nz/index_files/Page416.htm. PLEASE NOTE SAP FLOW DATA is provided to the students in terms of water depth/unit area. This website located in our CZO network is much more informative and offers an improved understanding of how tree transpiration varies across the critical zone (CZ). It will help to explain the formulas and how the vertical water flux modulates the soil moisture balance which in turn influences the subsurface biogeochemical and landscape evolution process across the CZ. http://cals.arizona.edu/research/papuga/docs/CZO_SapFlowFactSheet.pdf http://sapflowtool.com/SapFlowToolManual.html#GettingStarted http://www.sciencedirect.com/science/article/pii/S0168192313003134 Agricultural and Forest Meteorology Volume 187, 15 April 2014, Pages 72–82 Forest transpiration from sap flux density measurements in a Southeastern Coastal Plain riparian buffer system (Bosch et al, 2014) Sap flux density, groundwater, and climatic data are collected to determine transpiration rates for different tree species and their relationship to potential ET rates and hydrologic and environmental conditions. The data indicate that transpiration within regional buffers uses a disproportionate amount of water on a per area basis compared to upland land covers, an important consideration when examining overall water consumption in regional watersheds. While the data indicate decreasing transpiration as a function of decreasing vadose zone soil water, no clear relationship to proximity to groundwater was observed. While landscape position did not consistently impact tree transpiration, vadose zone soil water does appear to influence transpiration rates. The lack of a consistent groundwater effect may have been due to an accessible water table even under declining groundwater conditions.
  12. Snow melts out early around a tree trunk, but can last for weeks or months away from the tree canopy or in a shady spot nearby. At our study sites, sensors are arrayed around different tree species: under the canopy, at the edge of the canopy, and outside the canopy.
  13. Kerkez, B., S. D. Glaser, R. C. Bales, and M. W. Meadows (2012), Design and performance of a wireless sensor network for catchment-scale snow and soil moisture measurements, Water Resour. Res., 48, W09515, doi:10.1029/2011WR011214.
  14. Kerkez, B., S. D. Glaser, R. C. Bales, and M. W. Meadows (2012), Design and performance of a wireless sensor network for catchment-scale snow and soil moisture measurements, Water Resour. Res., 48, W09515, doi:10.1029/2011WR011214.
  15. One large, healthy tree can lift up to 4,000 litres of water from the ground and release it into the air A tree can absorb as much as 48 pounds of carbon dioxide per year and can sequester 1 ton of carbon dioxide by the time it reaches 40 years old. One large tree can provide a day's supply of oxygen for up to four people.
  16. Image Citation: OpenStax, Transport of Water and Solutes in Plants. OpenStax CNX. May 10, 2013 http://cnx.org/contents/e5aabc6f-71d9-40d5-99f0-0fb2d8d47317@5.
  17. The foreground is a thinned forest – back to the early 1900’s tree density. The background is a current forest with about 5-6 times the number of stems, but only twice the biomass (i.e. many smaller trees) – basically a forest where fire suppression has been practiced for the last 100 years.
  18. Photos by Matt Meadows, c. 2012. Upper left: Gridded snow survey at Providence for peak snow. Dr Pete Hartsough taking snow water equivalent measurements. Grad student Estelle Eumont holding the scale. Lower Right: Pete Hartsough collects snow for isotopic analysis
  19. The size of the gaps between trees affect the energy balance and the amount of snow that is collected and stored.
  20. This is a photo of part of the SSCZO. It has patches of dense vegetation and open areas. It was thinned in 2012 as part of the Kings River Experimental Watershed management plan.; post thinning treatments (prescribed fire treatments have not happened as of fall 2016. http://www.fs.fed.us/psw/topics/water/kingsriver/