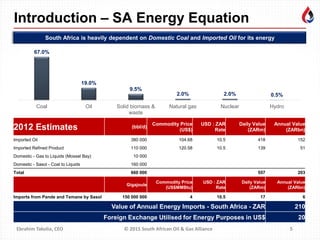
August 1, 2011
The Customer Driven Retailer
Grounded in Insights, Fueled by Data and Analytics
Ebrahim Takolia
3 November 2015
Attracting investment for developing the
potential of servicing the oil & gas industry
• Investment and infrastructure upgrades in motion to develop capacity
• Creating platforms and a competitive environment to meet the
requirements of oil & gas maritime sector
Saudi Arabia,
50%
Nigeria, 24%
Angola, 14%
Ghana, 5% Other,
7%
2Ebrahim Takolia, CEO © 2015 South African Oil & Gas Alliance
South Africa Imports ~378,000 bbl/d of oil and ~110,000 bbl/d of refined products
Location Company
Production Capacity
(bbl/d)
Crude Oil Distillation
NATREF - Oil Sasolburg Sasol 88 000
SAPREF - Oil Durban Shell & BP 169 000
Enref - Oil Durban Engen 118 000
Chevref - Oil Cape Town Chevron 110 000
Crude Oil Refinery Capacity 485 000
Source: Oil & Gas Journal 2014
Crude Oil Imports
• In 2012, South Africa imported 378,000 bbl/d of crude oil, according to the South
African Revenue Service.
• South Africa imports crude oil mostly from OPEC countries. From January to
November 2013, half of South Africa's crude oil imports were from Saudi Arabia,
followed by Nigeria (24%), Angola (14%), Ghana (5%), and small volumes from
various producers (7%).
Refined Products
• In 2012, South Africa imported 110,000 bbl/d of petroleum products, according to the
South African Revenue Service.
Refined Products
• The second-largest crude oil distillation capacity in Africa at 485,000 bbl/d
• New, tighter fuel standards will require upgrades at all refineries. However, because
of low returns on investment, refinery operators are hesitant to upgrade their facilities.
Furthermore, tariffs on refined product pipelines recently increased, as the
government needed the additional funds to finance the construction costs for a new
multi-fuel pipeline between Durban and Johannesburg, which will replace the existing
aging infrastructure and increase pipeline capacity. The new fuel standards, coupled
with the increase in pipeline tariffs, may raise refiners' operational costs.
South Africa Oil Today
Source: US Energy Information Administration
South Africa
Production /
Reserves
Share of
World
Global
Ranking
Oil Production (barrels per
day) – 2012
191 000 0.22% 43
Proven Oil Reserves
(million barrels) - 2012
15 0.001% 86
South Africa, Key Oil Statistics
Introduction – SA Oil by Numbers
Saudi Arabia,
50%
Nigeria, 24%
Angola, 14%
Ghana, 5% Other,
7%
3Ebrahim Takolia, CEO © 2015 South African Oil & Gas Alliance
South Africa Imports ~378,000 bbl/d of oil and ~110,000 bbl/d of refined products
Location Company
Production Capacity
(bbl/d)
Crude Oil Distillation
NATREF - Oil Sasolburg Sasol 88 000
SAPREF - Oil Durban Shell & BP 169 000
Enref - Oil Durban Engen 118 000
Chevref - Oil Cape Town Chevron 110 000
Crude Oil Refinery Capacity 485 000
Source: Oil & Gas Journal 2014
Crude Oil Imports
• In 2012, South Africa imported 378,000 bbl/d of crude oil, according to the South
African Revenue Service.
• South Africa imports crude oil mostly from OPEC countries. From January to
November 2013, half of South Africa's crude oil imports were from Saudi Arabia,
followed by Nigeria (24%), Angola (14%), Ghana (5%), and small volumes from
various producers (7%).
Refined Products
• In 2012, South Africa imported 110,000 bbl/d of petroleum products, according to the
South African Revenue Service.
Refined Products
• The second-largest crude oil distillation capacity in Africa at 485,000 bbl/d
• New, tighter fuel standards will require upgrades at all refineries. However, because
of low returns on investment, refinery operators are hesitant to upgrade their facilities.
Furthermore, tariffs on refined product pipelines recently increased, as the
government needed the additional funds to finance the construction costs for a new
multi-fuel pipeline between Durban and Johannesburg, which will replace the existing
aging infrastructure and increase pipeline capacity. The new fuel standards, coupled
with the increase in pipeline tariffs, may raise refiners' operational costs.
South Africa Oil Today
Source: US Energy Information Administration
South Africa
Production /
Reserves
Share of
World
Global
Ranking
Oil Production (barrels per
day) – 2012
191 000 0.22% 43
Proven Oil Reserves
(million barrels) - 2012
15 0.001% 86
South Africa, Key Oil Statistics
Introduction – SA Oil by Numbers
0.00
1.00
2.00
3.00
4.00
5.00
6.00
7.00
2001 2003 2004 2006 2008 2009 2010 2011
4Ebrahim Takolia, CEO © 2015 South African Oil & Gas Alliance
• Gas has been used in South African cities for
more than hundred years e.g. the supply of gas
in Johannesburg started in 1892 and was
generated by coal gasification (town gas).
• Gas is supplied by pipeline from Sasol and is
composed mainly of methane and hydrogen.
• Egoli gas has a 1200 km gas pipeline network
in greater Johannesburg and distributes gas
mainly to industry, but also to households.
• Gas is piped to South Africa through a 865 km
long pipeline with a capacity of 4.7 billion m3
per year, from the Pande and Tamane gas
fields in Mozambique to Secunda.
• PetroSA is exploiting gas from offshore fields
near Mossel Bay and converts this into liquid
fuels – GTL production capacity is 45,000 bbl/d
but currently 10,000 bb/d is being produced.
• LPG demand and supply is ~ 600 000 tonnes.
Source: Fossil Fuel Foundation
South Africa Natural Gas Today
Although demand is growing, Natural Gas accounts for just 2% of South Africa’s primary energy supply
South Africa, Natural Gas Consumption (Billion Cubic Metres)
3.31
1.27
4.59
Imports* Local
Production
Total
South Africa,
2011
* Mozambique
South Africa
Production /
Reserves
Share of
World
Global
Ranking
Gas Production (cubic
metres per year) - 2011
1 270 000 000 0.038% 62
Proven Gas Reserves
(‘000 cubic metres) - 2012
453 068 800 0.0002% 100
South Africa, Key Natural Gas Statistics
Introduction – Gas by Numbers
5Ebrahim Takolia, CEO © 2015 South African Oil & Gas Alliance
South Africa is heavily dependent on Domestic Coal and Imported Oil for its energy
2012 Estimates (bbl/d)
Commodity Price
(US$)
USD : ZAR
Rate
Daily Value
(ZARm)
Annual Value
(ZARbn)
Imported Oil 380 000 104.68 10.5 418 152
Imported Refined Product 110 000 120.58 10.5 139 51
Domestic - Gas to Liquids (Mossel Bay) 10 000
Domestic - Sasol - Coal to Liquids 160 000
Total 660 000 557 203
Gigajoule
Commodity Price
(US$MMBtu)
USD : ZAR
Rate
Daily Value
(ZARm)
Annual Value
(ZARbn)
Imports from Pande and Temane by Sasol 150 000 000 4 10.5 17 6
Value of Annual Energy Imports - South Africa - ZAR 210
Foreign Exchange Utilised for Energy Purposes in US$ 20
67.0%
19.0%
9.5%
2.0% 2.0% 0.5%
Coal Oil Solid biomass &
waste
Natural gas Nuclear Hydro
Introduction – SA Energy Equation
6Ebrahim Takolia, CEO © 2015 South African Oil & Gas Alliance
Africa Energy Statistics 2035
• Energy demand is projected to grow by 88% between
today and 2035, much faster than the global average of
37%.
• Fossil fuels account for 87% of demand in 2035, with natural
gas (+101%) and oil (+66%) and coal (+64%) all
expanding.
• Oil remains the dominant fuel accounting for 37% of energy
demand, followed by gas (29%) and coal (20%).
BP Energy Outlook 2035
Country and regional insights - Africa
Oil & Gas Developments – Africa
Africa Oil & Gas
Reserves
Source: ey.com
Nigeria
op(12), gp(9),
or(11), gr(8)
Angola
op(16), gp(67),
or(18), gr(43)
E Guinea
op(35), gp(47),
or(38), gr(67)
Congo Rep
op(39), gp(64),
or(37), gr(56)
Gabon
op(41), gp(79),
or(31), gr(72)
South Africa
op(43), gp(63), or(85),
gr(101)
Cameroon
op(56), gp(87)
or (58)
Cote de Iviore
op(60), gp(59),
or(70), gr(70)
DRC
op(77)
or(61)
Ghana
op(87), or(26), gr(75)
Mozambique gp(52),
gr(51)
Tanzania
gp(65), gr(83)
Uganda
or(43)
Produced by Ebrahim Takolia from various sources, notably
Wikipedia, July 2013
Rwanda
gr(63)
Zambia
op(109)
Benin
or(91)
Namibia
gr(61)
Kenya
Oil Production World Rank op ( ) Natural Gas Production World Rank gp ( )
Proven oil Reserves World Rank or ( ) Proven natural gas Reserves World Rank gr ( )
OIL
GAS
7
Regional snapshot of offshore exploration developments in Southern Africa
Map depicting the
relative size of
Africa compared to
countries
Africa
~32 million km2
East Africa
~10 million km2
East Africa – A New Frontier for Oil & Gas
8
Horn of Africa
Ethiopia
Eritrea
Djibouti
Somalia
Nile Valley
Egypt
Sudan
South Sudan
African Great Lakes
Uganda
Rwanda
Burundi
Kenya
Tanzania
Southeast Africa
Mozambique
Malawi
Zambia
Zimbabwe
Madagascar
Increased Exploration in East Africa
Ebrahim Takolia, CEO © 2015 South African Oil & Gas Alliance 9
2000 2014
The balance for oil & gas reserves potential is shifting
from West to East Africa
Oil & Gas
Exploration
East Africa – Oil & Gas Potential
Ebrahim Takolia, CEO © 2015 South African Oil & Gas Alliance
Oil Production
World Rank op ( )
Natural Gas
Production World
Rank gp ( )
Proven oil
Reserves World
Rank or ( )
Proven natural
gas Reserves
World Rank gr ( )
Egypt
op(28), gp(14),
or(27), gr(21)
Sudan
op(52),
or(34), gr(57)
South Sudan
Unranked
Eritrea
Unranked
Ethiopia
or(99), gr(73)
Djibouti
Unranked
Somalia
op(111), gr(89)
Kenya
Unranked
Tanzania
gp(66), gr(83)
Madagascar
Unranked
Mozambique
gp(53), gr(51)
Uganda
or(44)
Rwanda
gr(63)
Burundi
Unranked
Zambia
op(109
Zimbabwe
Unranked
Malawi
Unranked
10
East Africa – No.3 Region for Gas?
Rank Country/Region Date of Information TCF
World 6 612
1 Russia 12 June 2013 est. 1 716
2 Iran 12 June 2013 est. 1 186
3 Qatar 12 June 2013 est. 886
4 Turkmenistan 12 June 2013 est. 618
5 United States 12 December 2013 334
6 Saudi Arabia 1 January 2012 est. 289
7 Venezuela 19 July 2011 195
8 Nigeria 1 January 2010 est. 185
9 Algeria 1 January 2010 est. 159
10 Australia 1 January 2012 est. 135
Based on initial
findings, East
Africa as a region
(Mozambique,
Tanzania and
Kenya), could
rank No.3 as an
area for Global
Gas Reserves
3?
Ebrahim Takolia, CEO © 2015 South African Oil & Gas Alliance 11
Tin
Zaouatene
Tamar
Poseidon
Vesuvio
Aruanã
Wahoo
Miran West
Shaikan
Baikalovskoye
Tiber
Perla
Guará
Iara
Corcovado
Abaré Oeste
Iguaçu
Jupiter
Tsentralnaya
Nimblefoot
Gro
Discoveries with expected 2P resources >250 mmboe
Leda
Satis
KG-22
NC7-D
Tweneboa
Windjammer
Antelope
West Yurkharovskoye
North Veninskoye
Bounty
Buffalo-Giraffe
2008-2009 Gas discovery
2008-2009 oil discovery
Barquentine
Lagosta
Mamba
Chaza
Chewa
Offshore East Africa has become a proven gas province!
Kentish Knock
Briseis
Glencoe
2009-2012 E. Africa Gas discovery
Conventional Plays only
East Africa – An Exploration Hotspot
Ebrahim Takolia, CEO © 2015 South African Oil & Gas Alliance
Source; Deloitte, Wood Mackenzie
12
Oil & Gas Value Chain
Rig and
Ship
Repair
Welding
Scaffolding
Pressure
Vessels
Engineering
Services
Fabrication
Construction
Logistics
Storage
Marketing
Crude Oil Value Chain
Exploration Transportation Refining
• Geophysical
Evaluation & Design
• Field Development
• Drilling Operations
• Bringing the
oil to the
surface
• Gathering
and
transporting
– pipelines,
tankers,
trucks
• Fractionation of
crude oil into
petroleum
products
• Product Blending
• Retailing
• Trading
UPSTREAM MIDSTREAM
Oilfield Services
• Contract Drilling
• Drilling Related Services & Techniques
• Production & Maintenance
Production
DOWNSTREAM
End UsersExploration Processing
Transportation
& Storage
• 3D Seismic
• Geophysical Evaluation
& Design
• Drilling Operations
• Bringing the gas to
the surface
• Field Development
• Continuing drilling
operations
• Gathering &
Processing
• Fractionation
• Transportation
(pipelines)
• Storage
• Liquefaction (for
tanker transport)
• Industrials
• Power
Generation
• Utilities –
Residential and
Commercial
loads
UPSTREAM
Gasfield Services
• Contract Drilling
• Drilling Related Services & Techniques
• Production & Maintenance
Production
DOWNSTREAM
Natural Gas Value Chain
MIDSTREAM
Ebrahim Takolia, CEO © 2015 South African Oil & Gas Alliance 13
Infrastructure Investment Potential (1)
Activity Year 14 15 16 17 18 19 20 21 22 23
SA Offshore
SA Onshore
Africa Onshore & Offshore
Refineries
Terminals
Mozambique – Palma Bay, LNG
Planning | Local Participation | Infrastructure | Skills
14Ebrahim Takolia, CEO © 2015 South African Oil & Gas Alliance
Ebrahim Takolia, CEO © 2015 South African Oil & Gas Alliance
• Refineries: Sub-Saharan Africa is under-invested in refining capacity relative to the rest of the world.
• Offshore exploration: additional activity in East Africa.
• Local Africa demand: economic development in Africa will spur demand for natural gas.
15
Infrastructure Investment Potential (2)
Ebrahim Takolia, CEO © 2015 South African Oil & Gas Alliance
Sub-Saharan Africa - the
next 20 years
Over the next 20 years
Sub-Saharan Africa will
see significant changes in
the upstream and
midstream sectors of the
oil and gas value chain.
Included in this section is
an examination of current
Oil & Gas activity and an
assessment of proposed
future Oil & Gas activity
over the next 20 years.
16
Infrastructure Investment Potential (3)
Infrastructure Investment Constraints
Project
conception
Engineering
Financing
Government Approvals
Construction
Startup
Africa - 7 Year Average delay
“Financing has to be patient enough to outlast electoral cycles.”
17
Platforms for Success
• Policies
• Prioritise oil & gas
• Promote incentives
• Promote domestic markets
• Laws
• Fit-for-purpose laws
• Regulations
• Ensure fast and smooth implementation of laws. No “creep”
• Limited, intolerant of corruption, confusion and delay
• Procedures
• Clear, transparent and streamlined
• Appeals process for indecision or sub-optimal decisions
• Personnel
• Experienced people with expertise and understanding of
infrastructure investment and its character and requirements
18
DISCLAIMER
Ebrahim Takolia, CEO © 2015 South African Oil & Gas Alliance 19
Disclaimer
The material in this presentation has been prepared by The South African Oil & Gas Alliance (SAOGA) and is based on information
available at the date of this presentation.
This information is given in summary form and does not purport to be complete. Information in this presentation, including forecast
information, should not be considered as advice or a recommendation.
Before acting on any information you should consider the appropriateness of the and the risk of adverse or unanticipated market,
financial or political developments.
This presentation may contain forward looking statements including statements regarding our intent, belief or current expectations
with respect to oil and gas industry businesses and operations, market conditions, results of operation and financial condition,
capital adequacy, specific provisions and risk management practices.
Readers are cautioned not to place undue reliance on these forward looking statements. SAOGA does not undertake any
obligation to publicly release the result of any revisions to these forward looking statements to reflect events or circumstances after
the date hereof to reflect the occurrence of unanticipated events.
While due care has been used in the preparation of forecast information, actual results may vary in a materially positive or negative
manner. Forecasts and hypothetical examples are subject to uncertainty and contingencies outside SAOGA’s control.
Past performance is not a reliable indication of future performance.
Ebrahim Takolia
Chief Executive Officer
9th Floor| ConventionTower | Heerengracht | Foreshore | Cape Town8001
T +27 21 425 8840 | C +27 82 304 3133 | F +27 86 218 0845
etakolia@saoga.org.za | www.saoga.org.za
“Serving the interests of industry and members in the upstream & midstream oil & gas sectors.”

Attracting investment for developing the potential of servicing the oil and gas industry

  • 1.
    August 1, 2011 TheCustomer Driven Retailer Grounded in Insights, Fueled by Data and Analytics Ebrahim Takolia 3 November 2015 Attracting investment for developing the potential of servicing the oil & gas industry • Investment and infrastructure upgrades in motion to develop capacity • Creating platforms and a competitive environment to meet the requirements of oil & gas maritime sector
  • 2.
    Saudi Arabia, 50% Nigeria, 24% Angola,14% Ghana, 5% Other, 7% 2Ebrahim Takolia, CEO © 2015 South African Oil & Gas Alliance South Africa Imports ~378,000 bbl/d of oil and ~110,000 bbl/d of refined products Location Company Production Capacity (bbl/d) Crude Oil Distillation NATREF - Oil Sasolburg Sasol 88 000 SAPREF - Oil Durban Shell & BP 169 000 Enref - Oil Durban Engen 118 000 Chevref - Oil Cape Town Chevron 110 000 Crude Oil Refinery Capacity 485 000 Source: Oil & Gas Journal 2014 Crude Oil Imports • In 2012, South Africa imported 378,000 bbl/d of crude oil, according to the South African Revenue Service. • South Africa imports crude oil mostly from OPEC countries. From January to November 2013, half of South Africa's crude oil imports were from Saudi Arabia, followed by Nigeria (24%), Angola (14%), Ghana (5%), and small volumes from various producers (7%). Refined Products • In 2012, South Africa imported 110,000 bbl/d of petroleum products, according to the South African Revenue Service. Refined Products • The second-largest crude oil distillation capacity in Africa at 485,000 bbl/d • New, tighter fuel standards will require upgrades at all refineries. However, because of low returns on investment, refinery operators are hesitant to upgrade their facilities. Furthermore, tariffs on refined product pipelines recently increased, as the government needed the additional funds to finance the construction costs for a new multi-fuel pipeline between Durban and Johannesburg, which will replace the existing aging infrastructure and increase pipeline capacity. The new fuel standards, coupled with the increase in pipeline tariffs, may raise refiners' operational costs. South Africa Oil Today Source: US Energy Information Administration South Africa Production / Reserves Share of World Global Ranking Oil Production (barrels per day) – 2012 191 000 0.22% 43 Proven Oil Reserves (million barrels) - 2012 15 0.001% 86 South Africa, Key Oil Statistics Introduction – SA Oil by Numbers
  • 3.
    Saudi Arabia, 50% Nigeria, 24% Angola,14% Ghana, 5% Other, 7% 3Ebrahim Takolia, CEO © 2015 South African Oil & Gas Alliance South Africa Imports ~378,000 bbl/d of oil and ~110,000 bbl/d of refined products Location Company Production Capacity (bbl/d) Crude Oil Distillation NATREF - Oil Sasolburg Sasol 88 000 SAPREF - Oil Durban Shell & BP 169 000 Enref - Oil Durban Engen 118 000 Chevref - Oil Cape Town Chevron 110 000 Crude Oil Refinery Capacity 485 000 Source: Oil & Gas Journal 2014 Crude Oil Imports • In 2012, South Africa imported 378,000 bbl/d of crude oil, according to the South African Revenue Service. • South Africa imports crude oil mostly from OPEC countries. From January to November 2013, half of South Africa's crude oil imports were from Saudi Arabia, followed by Nigeria (24%), Angola (14%), Ghana (5%), and small volumes from various producers (7%). Refined Products • In 2012, South Africa imported 110,000 bbl/d of petroleum products, according to the South African Revenue Service. Refined Products • The second-largest crude oil distillation capacity in Africa at 485,000 bbl/d • New, tighter fuel standards will require upgrades at all refineries. However, because of low returns on investment, refinery operators are hesitant to upgrade their facilities. Furthermore, tariffs on refined product pipelines recently increased, as the government needed the additional funds to finance the construction costs for a new multi-fuel pipeline between Durban and Johannesburg, which will replace the existing aging infrastructure and increase pipeline capacity. The new fuel standards, coupled with the increase in pipeline tariffs, may raise refiners' operational costs. South Africa Oil Today Source: US Energy Information Administration South Africa Production / Reserves Share of World Global Ranking Oil Production (barrels per day) – 2012 191 000 0.22% 43 Proven Oil Reserves (million barrels) - 2012 15 0.001% 86 South Africa, Key Oil Statistics Introduction – SA Oil by Numbers
  • 4.
    0.00 1.00 2.00 3.00 4.00 5.00 6.00 7.00 2001 2003 20042006 2008 2009 2010 2011 4Ebrahim Takolia, CEO © 2015 South African Oil & Gas Alliance • Gas has been used in South African cities for more than hundred years e.g. the supply of gas in Johannesburg started in 1892 and was generated by coal gasification (town gas). • Gas is supplied by pipeline from Sasol and is composed mainly of methane and hydrogen. • Egoli gas has a 1200 km gas pipeline network in greater Johannesburg and distributes gas mainly to industry, but also to households. • Gas is piped to South Africa through a 865 km long pipeline with a capacity of 4.7 billion m3 per year, from the Pande and Tamane gas fields in Mozambique to Secunda. • PetroSA is exploiting gas from offshore fields near Mossel Bay and converts this into liquid fuels – GTL production capacity is 45,000 bbl/d but currently 10,000 bb/d is being produced. • LPG demand and supply is ~ 600 000 tonnes. Source: Fossil Fuel Foundation South Africa Natural Gas Today Although demand is growing, Natural Gas accounts for just 2% of South Africa’s primary energy supply South Africa, Natural Gas Consumption (Billion Cubic Metres) 3.31 1.27 4.59 Imports* Local Production Total South Africa, 2011 * Mozambique South Africa Production / Reserves Share of World Global Ranking Gas Production (cubic metres per year) - 2011 1 270 000 000 0.038% 62 Proven Gas Reserves (‘000 cubic metres) - 2012 453 068 800 0.0002% 100 South Africa, Key Natural Gas Statistics Introduction – Gas by Numbers
  • 5.
    5Ebrahim Takolia, CEO© 2015 South African Oil & Gas Alliance South Africa is heavily dependent on Domestic Coal and Imported Oil for its energy 2012 Estimates (bbl/d) Commodity Price (US$) USD : ZAR Rate Daily Value (ZARm) Annual Value (ZARbn) Imported Oil 380 000 104.68 10.5 418 152 Imported Refined Product 110 000 120.58 10.5 139 51 Domestic - Gas to Liquids (Mossel Bay) 10 000 Domestic - Sasol - Coal to Liquids 160 000 Total 660 000 557 203 Gigajoule Commodity Price (US$MMBtu) USD : ZAR Rate Daily Value (ZARm) Annual Value (ZARbn) Imports from Pande and Temane by Sasol 150 000 000 4 10.5 17 6 Value of Annual Energy Imports - South Africa - ZAR 210 Foreign Exchange Utilised for Energy Purposes in US$ 20 67.0% 19.0% 9.5% 2.0% 2.0% 0.5% Coal Oil Solid biomass & waste Natural gas Nuclear Hydro Introduction – SA Energy Equation
  • 6.
    6Ebrahim Takolia, CEO© 2015 South African Oil & Gas Alliance Africa Energy Statistics 2035 • Energy demand is projected to grow by 88% between today and 2035, much faster than the global average of 37%. • Fossil fuels account for 87% of demand in 2035, with natural gas (+101%) and oil (+66%) and coal (+64%) all expanding. • Oil remains the dominant fuel accounting for 37% of energy demand, followed by gas (29%) and coal (20%). BP Energy Outlook 2035 Country and regional insights - Africa
  • 7.
    Oil & GasDevelopments – Africa Africa Oil & Gas Reserves Source: ey.com Nigeria op(12), gp(9), or(11), gr(8) Angola op(16), gp(67), or(18), gr(43) E Guinea op(35), gp(47), or(38), gr(67) Congo Rep op(39), gp(64), or(37), gr(56) Gabon op(41), gp(79), or(31), gr(72) South Africa op(43), gp(63), or(85), gr(101) Cameroon op(56), gp(87) or (58) Cote de Iviore op(60), gp(59), or(70), gr(70) DRC op(77) or(61) Ghana op(87), or(26), gr(75) Mozambique gp(52), gr(51) Tanzania gp(65), gr(83) Uganda or(43) Produced by Ebrahim Takolia from various sources, notably Wikipedia, July 2013 Rwanda gr(63) Zambia op(109) Benin or(91) Namibia gr(61) Kenya Oil Production World Rank op ( ) Natural Gas Production World Rank gp ( ) Proven oil Reserves World Rank or ( ) Proven natural gas Reserves World Rank gr ( ) OIL GAS 7 Regional snapshot of offshore exploration developments in Southern Africa
  • 8.
    Map depicting the relativesize of Africa compared to countries Africa ~32 million km2 East Africa ~10 million km2 East Africa – A New Frontier for Oil & Gas 8 Horn of Africa Ethiopia Eritrea Djibouti Somalia Nile Valley Egypt Sudan South Sudan African Great Lakes Uganda Rwanda Burundi Kenya Tanzania Southeast Africa Mozambique Malawi Zambia Zimbabwe Madagascar
  • 9.
    Increased Exploration inEast Africa Ebrahim Takolia, CEO © 2015 South African Oil & Gas Alliance 9 2000 2014 The balance for oil & gas reserves potential is shifting from West to East Africa Oil & Gas Exploration
  • 10.
    East Africa –Oil & Gas Potential Ebrahim Takolia, CEO © 2015 South African Oil & Gas Alliance Oil Production World Rank op ( ) Natural Gas Production World Rank gp ( ) Proven oil Reserves World Rank or ( ) Proven natural gas Reserves World Rank gr ( ) Egypt op(28), gp(14), or(27), gr(21) Sudan op(52), or(34), gr(57) South Sudan Unranked Eritrea Unranked Ethiopia or(99), gr(73) Djibouti Unranked Somalia op(111), gr(89) Kenya Unranked Tanzania gp(66), gr(83) Madagascar Unranked Mozambique gp(53), gr(51) Uganda or(44) Rwanda gr(63) Burundi Unranked Zambia op(109 Zimbabwe Unranked Malawi Unranked 10
  • 11.
    East Africa –No.3 Region for Gas? Rank Country/Region Date of Information TCF World 6 612 1 Russia 12 June 2013 est. 1 716 2 Iran 12 June 2013 est. 1 186 3 Qatar 12 June 2013 est. 886 4 Turkmenistan 12 June 2013 est. 618 5 United States 12 December 2013 334 6 Saudi Arabia 1 January 2012 est. 289 7 Venezuela 19 July 2011 195 8 Nigeria 1 January 2010 est. 185 9 Algeria 1 January 2010 est. 159 10 Australia 1 January 2012 est. 135 Based on initial findings, East Africa as a region (Mozambique, Tanzania and Kenya), could rank No.3 as an area for Global Gas Reserves 3? Ebrahim Takolia, CEO © 2015 South African Oil & Gas Alliance 11
  • 12.
    Tin Zaouatene Tamar Poseidon Vesuvio Aruanã Wahoo Miran West Shaikan Baikalovskoye Tiber Perla Guará Iara Corcovado Abaré Oeste Iguaçu Jupiter Tsentralnaya Nimblefoot Gro Discoverieswith expected 2P resources >250 mmboe Leda Satis KG-22 NC7-D Tweneboa Windjammer Antelope West Yurkharovskoye North Veninskoye Bounty Buffalo-Giraffe 2008-2009 Gas discovery 2008-2009 oil discovery Barquentine Lagosta Mamba Chaza Chewa Offshore East Africa has become a proven gas province! Kentish Knock Briseis Glencoe 2009-2012 E. Africa Gas discovery Conventional Plays only East Africa – An Exploration Hotspot Ebrahim Takolia, CEO © 2015 South African Oil & Gas Alliance Source; Deloitte, Wood Mackenzie 12
  • 13.
    Oil & GasValue Chain Rig and Ship Repair Welding Scaffolding Pressure Vessels Engineering Services Fabrication Construction Logistics Storage Marketing Crude Oil Value Chain Exploration Transportation Refining • Geophysical Evaluation & Design • Field Development • Drilling Operations • Bringing the oil to the surface • Gathering and transporting – pipelines, tankers, trucks • Fractionation of crude oil into petroleum products • Product Blending • Retailing • Trading UPSTREAM MIDSTREAM Oilfield Services • Contract Drilling • Drilling Related Services & Techniques • Production & Maintenance Production DOWNSTREAM End UsersExploration Processing Transportation & Storage • 3D Seismic • Geophysical Evaluation & Design • Drilling Operations • Bringing the gas to the surface • Field Development • Continuing drilling operations • Gathering & Processing • Fractionation • Transportation (pipelines) • Storage • Liquefaction (for tanker transport) • Industrials • Power Generation • Utilities – Residential and Commercial loads UPSTREAM Gasfield Services • Contract Drilling • Drilling Related Services & Techniques • Production & Maintenance Production DOWNSTREAM Natural Gas Value Chain MIDSTREAM Ebrahim Takolia, CEO © 2015 South African Oil & Gas Alliance 13
  • 14.
    Infrastructure Investment Potential(1) Activity Year 14 15 16 17 18 19 20 21 22 23 SA Offshore SA Onshore Africa Onshore & Offshore Refineries Terminals Mozambique – Palma Bay, LNG Planning | Local Participation | Infrastructure | Skills 14Ebrahim Takolia, CEO © 2015 South African Oil & Gas Alliance
  • 15.
    Ebrahim Takolia, CEO© 2015 South African Oil & Gas Alliance • Refineries: Sub-Saharan Africa is under-invested in refining capacity relative to the rest of the world. • Offshore exploration: additional activity in East Africa. • Local Africa demand: economic development in Africa will spur demand for natural gas. 15 Infrastructure Investment Potential (2)
  • 16.
    Ebrahim Takolia, CEO© 2015 South African Oil & Gas Alliance Sub-Saharan Africa - the next 20 years Over the next 20 years Sub-Saharan Africa will see significant changes in the upstream and midstream sectors of the oil and gas value chain. Included in this section is an examination of current Oil & Gas activity and an assessment of proposed future Oil & Gas activity over the next 20 years. 16 Infrastructure Investment Potential (3)
  • 17.
    Infrastructure Investment Constraints Project conception Engineering Financing GovernmentApprovals Construction Startup Africa - 7 Year Average delay “Financing has to be patient enough to outlast electoral cycles.” 17
  • 18.
    Platforms for Success •Policies • Prioritise oil & gas • Promote incentives • Promote domestic markets • Laws • Fit-for-purpose laws • Regulations • Ensure fast and smooth implementation of laws. No “creep” • Limited, intolerant of corruption, confusion and delay • Procedures • Clear, transparent and streamlined • Appeals process for indecision or sub-optimal decisions • Personnel • Experienced people with expertise and understanding of infrastructure investment and its character and requirements 18
  • 19.
    DISCLAIMER Ebrahim Takolia, CEO© 2015 South African Oil & Gas Alliance 19 Disclaimer The material in this presentation has been prepared by The South African Oil & Gas Alliance (SAOGA) and is based on information available at the date of this presentation. This information is given in summary form and does not purport to be complete. Information in this presentation, including forecast information, should not be considered as advice or a recommendation. Before acting on any information you should consider the appropriateness of the and the risk of adverse or unanticipated market, financial or political developments. This presentation may contain forward looking statements including statements regarding our intent, belief or current expectations with respect to oil and gas industry businesses and operations, market conditions, results of operation and financial condition, capital adequacy, specific provisions and risk management practices. Readers are cautioned not to place undue reliance on these forward looking statements. SAOGA does not undertake any obligation to publicly release the result of any revisions to these forward looking statements to reflect events or circumstances after the date hereof to reflect the occurrence of unanticipated events. While due care has been used in the preparation of forecast information, actual results may vary in a materially positive or negative manner. Forecasts and hypothetical examples are subject to uncertainty and contingencies outside SAOGA’s control. Past performance is not a reliable indication of future performance. Ebrahim Takolia Chief Executive Officer 9th Floor| ConventionTower | Heerengracht | Foreshore | Cape Town8001 T +27 21 425 8840 | C +27 82 304 3133 | F +27 86 218 0845 etakolia@saoga.org.za | www.saoga.org.za “Serving the interests of industry and members in the upstream & midstream oil & gas sectors.”