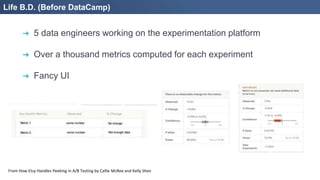
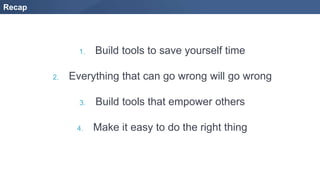
1. The document discusses building an A/B testing analytics system with R and Shiny. It describes lessons learned like building tools to save time, anticipating problems, empowering others with accessible tools, and making it easy to follow best practices.
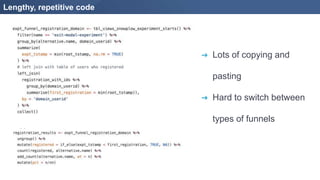
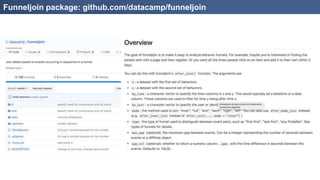
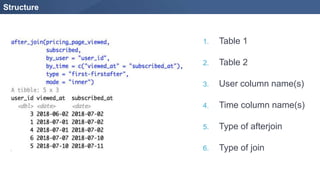
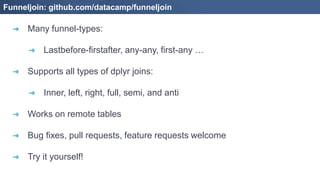
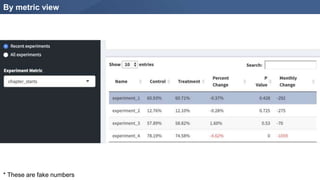
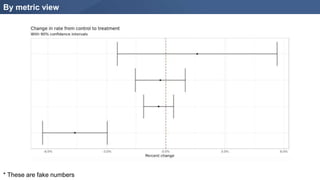
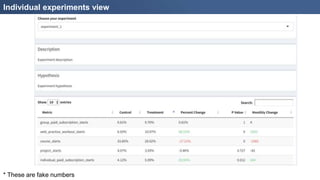
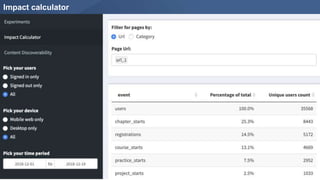
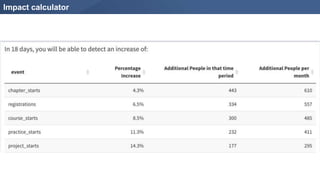
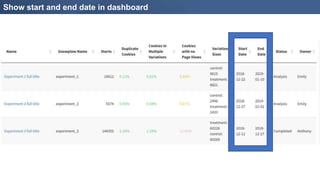
2. Tools developed include the funneljoin package to analyze user journeys, a dashboard to visualize experiment metrics, and an impact calculator to estimate detectable effects.
3. The system helped improve an experimentation process that previously lacked infrastructure by automating analyses and encouraging appropriate experiment design.