SlideShare a Scribd company logo
1 of 25
Download to read offline
Siena Galaxy Atlas 2020
John Moustakas1
, Dustin Lang2
, Arjun Dey3
, Stéphanie Juneau3
, Aaron Meisner3
, Adam D. Myers4
,
Edward F. Schlafly5
, David J. Schlegel6
, Francisco Valdes3
, Benjamin A. Weaver3
, and Rongpu Zhou6
1
Department of Physics and Astronomy, Siena College, 515 Loudon Road, Loudonville, NY 12110, USA; jmoustakas@siena.edu
2
Perimeter Institute for Theoretical Physics, 31 Caroline Street North, Waterloo, ON N2L 2Y5, Canada
3
NSF’s NOIRLab, 950 N. Cherry Avenue, Tucson, AZ 85719, USA
4
Department of Physics and Astronomy, University of Wyoming, Laramie, WY 82071, USA
5
Space Telescope Science Institute, 3700 San Martin Drive, Baltimore, MD 21218, USA
6
Lawrence Berkeley National Laboratory, 1 Cyclotron Road, Berkeley, CA 94720, USA
Received 2023 July 10; revised 2023 August 23; accepted 2023 August 24; published 2023 October 18
Abstract
We present the 2020 version of the Siena Galaxy Atlas (SGA-2020), a multiwavelength optical and infrared
imaging atlas of 383,620 nearby galaxies. The SGA-2020 uses optical grz imaging over ≈20,000 deg2
from the
Dark Energy Spectroscopic Instrument (DESI) Legacy Imaging Surveys Data Release 9 and infrared imaging in
four bands (spanning 3.4–22 μm) from the 6 year unWISE coadds; it is more than 95% complete for galaxies larger
than R(26) ≈ 25″ and r < 18 measured at the 26 mag arcsec−2
isophote in the r band. The atlas delivers precise
coordinates, multiwavelength mosaics, azimuthally averaged optical surface-brightness profiles, model images and
photometry, and additional ancillary metadata for the full sample. Coupled with existing and forthcoming optical
spectroscopy from the DESI, the SGA-2020 will facilitate new detailed studies of the star formation and mass
assembly histories of nearby galaxies; enable precise measurements of the local velocity field via the Tully–Fisher
and fundamental plane relations; serve as a reference sample of lasting legacy value for time-domain and
multimessenger astronomical events; and more.
Unified Astronomy Thesaurus concepts: Galaxy photometry (611); Celestial objects catalogs (212)
1. Introduction
1.1. Scientific Context
Although a broad theoretical framework exists for under-
standing the physics of galaxy formation, many key questions
remain unanswered. In this framework, the star formation and
stellar mass assembly histories of galaxies are intimately linked
to the hierarchical buildup of dark matter halos, modulated by a
time-varying interplay between internal (secular) and external
(environmental) processes (e.g., Kennicutt 1998; Kormendy &
Kennicutt 2004; Blanton & Moustakas 2009; Somerville &
Davé 2015; Naab & Ostriker 2017; Wechsler & Tinker 2018).
Identifying these physical processes and their relative
importance—as a function of cosmic time—remains one of
the foremost outstanding problems in observational cosmology.
Some of the most pressing outstanding questions include the
following:
1. How and why does star formation in galaxies cease? Why
do low-mass galaxies exhibit more extended star
formation histories than massive galaxies?
2. What is the nature of inside-out galaxy formation—did
galaxies start growing earlier in their inner parts, did they
end star formation earlier in those parts, or both?
3. How does feedback from active galactic nuclei, super-
novae, stellar winds, and other effects regulate star
formation?
4. What was the relative impact of mergers versus secular
processes on the structure of present-day galaxies,
including their bulges, bars, spirals, rings, warps, shells,
and pseudobulges?
5. How are all these detailed processes affected by the
relationship between galaxies and their host dark matter
halo—for example, whether they are central or satellite
galaxies?
Investigating these and related questions requires an accurate
and detailed view of the present-day galaxy population—the
population we can potentially understand the best. In particular,
the galaxies that are near enough or intrinsically large enough
in terms of their apparent angular diameter to be spatially well
resolved can be studied in significantly greater detail than more
distant, spatially unresolved galaxies.7
For example, in typical
ground-based optical imaging, the galaxies with isophotal
diameters larger than ≈10″–20″ can be used to study the
properties of their disk and spheroidal components as separate,
distinct features; to identify bars, rings, disk asymmetries, and
other dynamical structures; to discover and characterize their
low surface-brightness features such as stellar streams, tidal
tails, and outer envelopes; to unveil faint, low-mass satellites;
and much more.
Because of their unique and high-impact scientific potential,
the compilations or atlases of large, nearby galaxies have a
long, rich heritage in astronomy. In 1774, nearly 150 yr before
observations confirmed that the Milky Way was just one of
many “island universes,” Charles Messier published his
Catalogue des Nébuleuses et des Amas d’Étoiles, which
includes 40 (now-famous) galaxies among a full catalog of
110 objects. Subsequently, building on the naked-eye
The Astrophysical Journal Supplement Series, 269:3 (25pp), 2023 November https://doi.org/10.3847/1538-4365/acfaa2
© 2023. The Author(s). Published by the American Astronomical Society.
Original content from this work may be used under the terms
of the Creative Commons Attribution 4.0 licence. Any further
distribution of this work must maintain attribution to the author(s) and the title
of the work, journal citation and DOI.
7
We differentiate here between dwarf galaxies in the Local Group whose
individual stars can be resolved (Mateo 1998), and galaxies, which are near or
large enough to be spatially resolved into components (e.g., bulge versus disk),
but which must still be studied via their integrated light.
1
surveying effort of William Herschel and his sister Caroline
and son John (Herschel 1786, 1864), John Louis Emil Dreyer
spent more than two decades assembling the New General
Catalogue of Nebulae and Clusters of Stars (NGC) and the
Index Catalogues (IC), a sample of approximately 15,000
Galactic and extragalactic objects whose designations are still
in wide-spread use today (Dreyer 1888, 1912). The NGC, IC,
and other early catalogs laid the foundation for several
important galaxy atlases published in the second half of the
20th century covering most of the sky. These atlases used
photographic imaging from the Palomar Observatory Sky
Survey in the 1950s and 1960s (Minkowski & Abell 1963;
Reid & Djorgovski 1993) and the UK Schmidt Southern Sky
Survey in the 1970s (Cannon 1979), and include the following:
the Catalogue of Galaxies and of Clusters of Galaxies
(Zwicky et al. 1968); the Uppsala General Catalog of Galaxies
(UGC) and its Addendum (Nilson 1973, 1974); the
Morphological Catalog of Galaxies (Vorontsov-Velyaminov
& Krasnogorskaya 1974); the ESO/Uppsala Survey of the
ESO (B) Atlas (ESO; Lauberts 1982); the Principal Galaxies
Catalogue (PGC; Paturel et al. 1989); among others.
Eventually, data from these and other catalogs were assembled
into the indispensable Third Reference Catalog of Bright
Galaxies (RC3; de Vaucouleurs et al. 1991; Corwin et al.
1994). The RC3 contains extensive information on 23,011
nearby galaxies and is purportedly complete for galaxies
with Bt,Vega < 15.5, ( ) > ¢
D 25 1 , and v < 15,000 km s−1
(z < 5 × 10⁻⁵
), although it does include a number of objects
outside these limits that are of special interest.8
The advent of wide-area (>103
deg2
), multiwavelength
imaging surveys has produced the next-generation atlases of
large angular-diameter galaxies in the ultraviolet and infrared,
including the the Two Micron All Sky Survey (2MASS) Large
Galaxy Atlas (Jarrett et al. 2003), the NASA–Sloan Atlas
(NSA; Blanton et al. 2005, 2011), the Galaxy Evolution
Explorer (GALEX) Ultraviolet Atlas of Nearby Galaxies (Gil
de Paz et al. 2007), the Spitzer Survey of Stellar Structure in
Galaxies (Sheth et al. 2010), the z = 0 Multiwavelength Galaxy
Synthesis (Leroy et al. 2019), and the Wide-Field Infrared
Survey Explorer (WISE) Extended Source Catalog of the 100
Largest Galaxies (Jarrett et al. 2019). However, with the
exception of the NSA, the optical sizes, shapes, and total
magnitudes for the objects in these atlases are based on the
photographic-plate measurements published in the RC3. The
NSA, meanwhile, delivers new optical measurements of nearby
(z < 0.05) galaxies using ≈8000 deg2
of ugriz imaging from
the Sloan Digital Sky Survey (SDSS; York et al. 2000), but is
30% incomplete at r  14 (Wake et al. 2017).9
1.2. The Need for a New Large-galaxy Atlas
With the historical context in mind, several recent
developments motivate a renewed effort to assemble a uniform
data set of large angular-diameter galaxies. First, three new
ground-based optical imaging surveys jointly called the Dark
Energy Spectroscopic Instrument (DESI) Legacy Imaging
Surveys (hereafter, the Legacy Surveys) have delivered deep
imaging in g, r, and z over ≈20,000 deg2
of the extragalactic
(i.e., low Galactic extinction) sky (Dey et al. 2019; D. J.
Schlegel et al. 2023, in preparation). These data provide
exquisite photometric and astrometric precision and reach
1–2 mag deeper than either SDSS or Pan-STARRS1 (Cham-
bers et al. 2016). In addition, the development of the state-of-
the-art image modeling code The Tractor provides a
computationally tractable means of working with multiband,
multipass, variable-seeing imaging, enabling dedicated studies
of large angular-diameter galaxies (Lang et al. 2016; D. Lang
et al. 2023, in preparation).
Second, in 2021 May, the DESI Survey began a 5 year
program (2021–2026) to obtain precise spectroscopic redshifts
for an unprecedented sample of more than 40 million galaxies
and 10 million stars over the ≈14,000 deg2
Legacy Surveys
footprint accessible from the 4 m Mayall Telescope at Kitt Peak
National Observatory (KPNO; DESI Collaboration et al.
2016a, 2016b; Abareshi et al. 2022). As part of this effort,
the DESI Bright Galaxy Survey (BGS) is obtaining spectra and
redshifts for a statistically complete sample of >10 million
galaxies brighter than r = 20.175 (Hahn et al. 2023). A high-
quality photometric catalog of the largest angular-diameter
galaxies over the DESI footprint is needed to ensure the BGS
has high completeness and does not suffer from the
photometric shredding and spectroscopic incompleteness of
the SDSS at bright magnitudes (Wake et al. 2017).
To address these and other needs, we present the 2020
version of the Siena Galaxy Atlas (SGA), SGA-2020, an
optical and infrared imaging atlas of nearly 4 × 10⁵
galaxies
approximately limited to an angular diameter of 25″ at the
26 mag arcsec−2
isophote for galaxies brighter than r ≈ 18 over
the 20,000 deg2
footprint of the DESI Legacy Imaging Surveys
Data Release 9 (LS/DR9; Dey et al. 2019; D. J. Schlegel et al.
2023, in preparation; see Figure 1). The SGA-2020 delivers
precise coordinates, multiwavelength mosaics, azimuthally
averaged optical surface-brightness and color profiles, model
images and photometry, and additional metadata for the full
sample.10
Notably, for many of the largest (e.g., NGC/IC/
Messier) galaxies in the sky, especially outside the SDSS
imaging footprint, the SGA-2020 delivers the first reliable
measurements of the optical positions, shapes, and sizes of
large galaxies since the RC3 was published more than
30 yr ago.
By combining existing (archival) spectroscopic redshifts
with forthcoming DESI spectroscopy, the SGA-2020 will spur
a renewed effort to tackle several outstanding problems in
extragalactic astrophysics, particularly the interplay between
galaxy formation and dark matter halo assembly. It will also
support studies of time-domain and multimessenger astronom-
ical events, which are often hampered by incomplete or
heterogeneous catalogs of large, nearby galaxies, which are
most likely to host the electromagnetic counterparts of
gravitational wave events (Gehrels et al. 2016; Abbott et al.
2020) and other classes of transients. Moreover, within the
≈14,000 deg2
DESI footprint, the SGA-2020 is ensuring high
photometric completeness for the BGS, and is facilitating high-
impact ancillary science through a variety of secondary
targeting programs (DESI Collaboration et al. 2023a;
8
D(25) represents the diameter of the galaxy at the -
25 mag arcsec 2 isophote
in the optical and is a well-established and historically important measure of the
“size” of a galaxy popularized by the RC3.
9
Note that the incompleteness in the SDSS Main Survey (Strauss et al. 2002)
impacts all other SDSS galaxy catalogs such as Simard et al. (2011), Meert
et al. (2015). The NSA mitigates this incompleteness to some degree by
utilizing redshifts from other surveys, but a nonnegligible fraction of the
largest, brightest galaxies in the local universe are still missed.
10
https://sga.legacysurvey.org
2
The Astrophysical Journal Supplement Series, 269:3 (25pp), 2023 November Moustakas et al.
Myers et al. 2023). For example, the DESI Peculiar Velocity
Survey will place precise new constraints on the growth rate of
large-scale structure by measuring the Tully–Fisher and
fundamental-plane scaling relations (Tully & Fisher 1977;
Djorgovski & Davis 1987) from SGA-2020 targets at z < 0.15
(Saulder et al. 2023). And finally, the SGA-2020 will help
engage the broader public with visually striking color mosaics
of large, well-resolved, nearby galaxies, enabling a myriad of
educational and public-outreach activities.
We organize the remainder of the paper in the following
way: In Section 2, we define the SGA-2020 parent sample and
describe the procedure we use to define the final sample of
galaxies and their associated (angular) group membership. In
Section 3, we describe our photometric analysis, including how
we construct the custom multiwavelength mosaics, model the
two-dimensional images of each galaxy, and measure their
azimuthally averaged surface-brightness and color profiles. Of
particular interest for some readers may be Section 3.3, where
we validate our surface-brightness profiles and summarize the
principal SGA-2020 data products. In Section 4, we quantify
the completeness of the SGA and review how it improves upon
existing large-galaxy catalogs, and in Section 5, we highlight
some of the exciting potential scientific applications of the
SGA-2020. Finally, Section 6 summarizes the main results of
this paper and outlines some of the improvements we intend to
include in the next version of the SGA.
Note that, unless otherwise indicated, all magnitudes are on
the AB magnitude system (Oke & Schild 1970) and have not
been corrected for foreground Galactic extinction. We report all
fluxes in units of “nanomaggies,” where 1 nanomaggie is the
(linear) flux density of an object with an AB magnitude of
22.5.11
Figure 1. Optical mosaics of 42 galaxies from the SGA-2020 sorted by increasing angular diameter from the top left to the bottom right. Galaxies are chosen randomly
from a uniform (flat) probability distribution in angular diameter. The horizontal white bar in the lower left corner of each panel represents ¢
1 , and the mosaic cutouts
range from ¢
3.2 to ¢
13.4. This figure illustrates the tremendous range of galaxy types, sizes, colors, and surface-brightness profiles, internal structure, and environments
of the galaxies in the SGA.
11
https://www.legacysurvey.org/dr9/description/#photometry
3
The Astrophysical Journal Supplement Series, 269:3 (25pp), 2023 November Moustakas et al.
2. Parent Sample and Group Catalog
2.1. Building the Parent Sample
Many of the largest, highest-surface-brightness galaxies in
the sky have been famously known for a long time and are part
of many of the legacy (photographic-plate) large-galaxy
catalogs discussed in Section 1 (e.g., RC3). More recently,
fainter, lower surface-brightness (but still “large,” spatially
resolved) galaxies have been cataloged by modern, wide-area
optical and near-infrared imaging surveys like the SDSS,
2MASS (Skrutskie et al. 2006), and Pan-STARRS1 (Chambers
et al. 2016). For the first version of the SGA, we opt to build
upon this body of previous work by beginning from these and
other catalogs of “known” large angular-diameter galaxies (but
see the discussion in Section 6).
Fortunately, several user-oriented databases exist, which
curate the positions, sizes, magnitudes, redshifts, and other
information on millions of extragalactic sources cataloged by
different surveys, including SIMBAD (Wenger et al. 2000), the
NASA Extragalactic Database (NED; Helou et al. 1991), and
HyperLeda (Makarov et al. 2014). After some experimentation,
we opt to construct the initial SGA-2020 parent sample using
the HyperLeda12
extragalactic database. HyperLeda includes
extensive metadata on nearly all known large angular-diameter
galaxies, building on the heritage of the RC3 and earlier large-
galaxy atlases. In addition, an effort has been made by the
HyperLeda team to homogenize the angular diameters,
magnitudes, and other observed properties of the galaxies that
have been ingested into the database from a wide range of
different surveys and catalogs (Paturel et al. 1997; Makarov
et al. 2014). This procedure imposes some uniformity on our
parent sample, although we show in Section 3.3 the significant
value of computing the geometry (diameter, position angle, and
ellipticity) and photometry of galaxies consistently and using
modern (deep, wide-area) optical imaging.
With these ideas in mind, we query the HyperLeda
extragalactic database for galaxies with angular diameter
DL(25) > 12″ ( ¢
0.2), where DL(25) is the major-axis diameter
of the galaxy at the 25 mag arcsec−2
surface-brightness
isophote in the optical (typically the Johnson–Morgan B band;
see Appendix A for additional details). Our query results in an
initial parent sample of 1,436,176 galaxies.
Using visual inspection and a variety of quantitative and
qualitative tests, we cull this initial sample by applying the
following additional cuts: first, we remove the Large and Small
Magellanic Clouds and the Sagittarius Dwarf Galaxy from the
sample by imposing a maximum angular diameter of
( ) < ¢
D 25 180
L . These galaxies span such a large projected
angular size on the sky (many degrees) that their inclusion is
outside the scope of the SGA (but see Jarrett et al. 2019). After
removing these objects, the largest angular-diameter galaxies
that remain are NGC 0224 = M31 and NGC 0598 = M33
whose DL(25) diameters are ¢
178 and ¢
62 , respectively.
Furthermore, we limit the sample on the lower end to
DL(25) > 20″, which removes roughly 900,000 galaxies
(approximately 65% of the initial sample). We implement this
cut because we find that the fraction of sources with incorrect
(usually overestimated) diameters in HyperLeda increases
rapidly below this limit. Moreover, we find that galaxies
smaller than DL(25) ≈ 20″ are well modeled by Tractor as
part of the standard photometric pipeline used in LS/DR9 (Dey
et al. 2019; D. J. Schlegel et al. 2023, in preparation).
Next, we remove approximately 3800 galaxies with no
magnitude estimate in HyperLeda (as selected by our query;
see Appendix A), which we find to be largely spurious, as well
as approximately 6500 objects with significantly overestimated
diameters (or spurious sources), which we identify via visual
inspection. Many of these cases are groupings of small galaxies
or stars along a line, which have been misinterpreted by
previous fitting algorithms as a single edge-on galaxy. In
addition, we remove approximately 1700 galaxies whose
primary galaxy identifier (in HyperLeda) is from either SDSS
or 2MASS and whose central coordinates place it inside the
elliptical aperture of another (non-SDSS and non-2MASS)
galaxy with DL(25) diameter greater than 30″. We find that in
the majority of cases these objects have grossly overestimated
diameters, presumably due to shredding by the 2MASS and
SDSS photometric pipelines. Figure 2 displays a gallery of
some of the most common types of sources we reject from our
initial parent sample using these cuts.
Now, to improve the completeness of the parent sample, we
supplement the initial HyperLeda catalog with sources drawn
from three additional catalogs, making sure to carefully handle
duplicate entries. First, we add a subset of the Local Group
dwarf galaxies from McConnachie (2012). From the original
sample of 93 galaxies in McConnachie (2012), we remove 47
that have such a low surface brightness and are so well resolved
that including them is beyond the scope of the current version
of the SGA.13
For reference, the median surface brightness of
these 47 systems is μV = 28.8 mag arcsec−2
, well below the
surface-brightness completeness limit of the SGA-2020 (see
Section 3.3). Furthermore, we remove the Fornax and Sculptor
dwarf galaxies, which are higher surface brightness
(μV = 25.1–25.5 mag arcsec−2
) but very well resolved into
stars and star clusters and too challenging to include in this
initial version of the SGA.
Next, we add 190 galaxies from the RC3 and OpenNGC14
catalogs which are missing from our initial HyperLeda sample.
Surprisingly, many of these systems are large and have high
average surface brightness; however, we suspect that an issue
with our database query (see Appendix A) may have
inadvertently excluded these sources from our initial catalog.
And finally, we use the Legacy Surveys Data Release 8 (DR8)
photometric catalogs to identify 2890 additional large-diameter
galaxies in the Legacy Surveys footprint.15
Specifically, after
applying a variety of catalog-level quality cuts and extensive
visual inspection, we include in our parent sample all objects
(not already in our sample) from DR8 with half-light radii
r50 > 14″ based on their Tractor model fits.
Our final parent sample contains 531,677 galaxies approxi-
mately limited to DL(25) > 20″ and spanning a wide range of
magnitude and surface brightness. In Figure 3, we show the
celestial distribution of this sample, and in Figure 4, we show
the range of apparent bt-band magnitude16
and angular
12
http://leda.univ-lyon1.fr/
13
For reference, we remove the following Local Group dwarfs: Andromeda I,
II, III, V, VII, IX, X, XI, XII, XIII, XIV, XV, XVI, XVII, XVIII, XIX, XX,
XXI, XXII, XXIII, XXIV, XXV, XXVI, XXVII, and XXIX; Antlia; Aquarius;
Bootes I and II; Canes Venatici I and II; Carina; Coma Berenices; Draco;
Hercules; Leo IV, V, and T; Pisces II; Sagittarius dSph; Segue I and II; Sextans
I; Ursa Major I and II; Ursa Minor; and Willman 1.
14
https://github.com/mattiaverga/OpenNGC
15
https://legacysurvey.org/dr8
16
http://leda.univ-lyon1.fr/leda/param/bt.html
4
The Astrophysical Journal Supplement Series, 269:3 (25pp), 2023 November Moustakas et al.
diameter spanned by the parent sample. We discuss the
completeness of the sample in Section 4.
2.2. Projected Group Catalog
Our approach for the SGA is to jointly analyze galaxies that
are relatively close to one another in terms of their projected (or
angular) separation in order to properly fit overlapping light
profiles. We emphasize that we do not require galaxies to be
physically associated, which would require knowledge of their
redshifts or physical separation. We build a simple group
catalog from the parent sample described in Section 2.1 using
the spheregroup friends-of-friends algorithm.17
We use a ¢
10
linking length, taking care to ensure that galaxies assigned to
the same group overlap within 2 times their circularized DL(25)
diameter.
Using this procedure, we identify 14,930 projected galaxy
groups with two members, 1585 groups with 3–5 members, 51
with 6–10 members, and just four groups with more than 10
members, including the center of the Coma Cluster, the Virgo
Cluster, and A3558 (although A3558 is outside the LS/DR9
imaging footprint; see Section 3.3). Notably, 496,255 objects
or 93% of the parent sample are isolated according to the
criteria used to build the group catalog.
For each galaxy group, we compute several quantities that we
refer to in subsequent sections of the paper (but see Appendix B
for the complete data model). GROUP_NAME is a unique group
name, which we construct from the name of the group’s largest
member (ranked by DL(25)) and the suffix _GROUP (e.g.,
NGC 4406_GROUP). For isolated galaxies, GROUP_NAME is
just the name of its only member (i.e., without the _GROUP
suffix). In addition, we compute GROUP_RA and GROUP_DEC to
be the DL(25)-weighted R.A. and decl., respectively, of all the
group members. Once again, for isolated systems, GROUP_RA
Figure 2. Gallery of common types of HyperLeda sources rejected while building the parent sample. In each panel, the horizontal white bar represents 30″. The top
row shows one spurious object and three examples of pairs or triples of stars or compact galaxies, which are recorded in HyperLeda as one “large” galaxy (represented
by the red ellipse). The middle row shows four examples of how bright stars and galaxies can lead to significantly overestimated galaxy diameters in HyperLeda. For
example, PGC 2500856 in the middle right panel is a blue star, which has been miscategorized by HyperLeda as a galaxy with a major-axis diameter of ≈54″
presumably due to the proximity of the nearby bright galaxy PGC 3087062, which appears in the final SGA-2020 catalog (blue ellipse). Finally, the bottom row shows
four examples of sources in HyperLeda, which are in fact photometric shreds or misidentified parts of a galaxy. In each case, the blue ellipse shows the correct parent
galaxy from the SGA-2020 while the red ellipse is the incorrect source from HyperLeda, which we remove from the parent sample (see Section 2.1). For example,
PGC 071502 and PGC 093084 are H II regions in ESO240-004 and NGC 1507, respectively, while SDSSJ211630.38+001817.7 is a foreground star in the body of
PGC 188224 with an incorrect angular diameter.
17
https://pydl.readthedocs.io/en/latest
5
The Astrophysical Journal Supplement Series, 269:3 (25pp), 2023 November Moustakas et al.
and GROUP_DEC are identical to the RA and DEC coordinates of
that galaxy (see Appendix B). Finally, we record our estimate of
the diameter of the group in the quantity GROUP_DIAMETER.
For isolated galaxies, GROUP_DIAMETER equals DL(25), but for
groups, we compute GROUP_DIAMETER to be the maximum
separation of all the pairs of group members plus their DL(25)
diameter (in arcminutes).
3. Photometric Analysis
3.1. Imaging Data
We build the SGA-2020 from the same optical and infrared
imaging data used to produce the Legacy Surveys DR9
(Dey et al. 2019; D. J. Schlegel et al. 2023, in preparation).18
Briefly, the optical data consist of grz imaging over
≈20,000 deg2
from a number of different surveys. In the
North Galactic Cap, we use data from the Beijing–Arizona Sky
Survey (BASS; Zou et al. 2017), which provides ≈5000 deg2
of gr imaging using the 90Prime Camera (Williams et al. 2004)
on the Steward Observatory Bok 2.3 m telescope at KPNO; and
data from the Mayall z-band Legacy Survey (MzLS), which
provides z-band imaging over the same ≈5000 deg2
footprint
as BASS using the Mosaic-3 camera (Dey et al. 2016) at the
KPNO Mayall 4 m telescope.
Figure 3. Distribution of 531,677 galaxies in the SGA-2020 parent sample in an equal-area Mollweide projection in equatorial coordinates, binned into 3.4 deg2
healpix pixels (Zonca et al. 2019). The dark gray curve represents the Galactic plane. Note the significant variations in galaxy surface density, which we attribute to
surface-brightness incompleteness and heterogeneity in the aggregate HyperLeda catalog.
Figure 4. Isophotal diameter, DL(25), vs. bt-band magnitude (left) and marginalized distribution of DL(25) (right) for the SGA-2020 parent sample. The black
contours, points, and histogram represent galaxies from HyperLeda, while the green points and histogram are galaxies from the supplemental catalogs we use to
increase the completeness of the sample (see Section 2.1). For reference, the contours enclose 50%, 75%, 95%, and 99.5% of the blue points. These figures show that,
by construction, the SGA-2020 parent sample is largely limited to DL(25) > 20″ ( ¢
0.333) but with a tail of galaxies with diameters as small as ≈10″ (» ¢
0.167), and it
includes galaxies as bright as bt,Vega ≈ 8.
18
https://www.legacysurvey.org/dr9
6
The Astrophysical Journal Supplement Series, 269:3 (25pp), 2023 November Moustakas et al.
In the South Galactic Cap (SGC) and in the North Galactic
Cap up to a decl. of approximately +32°, we use grz imaging
over ≈15,000 deg2
from roughly 50 distinct (but uniformly
processed) data sets obtained with the Dark Energy Camera
(DECam; Flaugher et al. 2015) at the Cerro Tololo Inter-
American Observatory 4 m Blanco telescope. Note that the
majority of this DECam imaging comes from the DECam
Legacy Survey (DECaLS; Dey et al. 2019) and the Dark
Energy Survey (DES; Dark Energy Survey Collaboration et al.
2016; Abbott et al. 2021).19
We supplement the optical data with all-sky infrared imaging
at 3.4–22 μm from WISE (Wright et al. 2010). Specifically, we
use the 6 yr WISE plus NEOWISE-Reactivation (NEOWISE-
R; Mainzer et al. 2014) image stacks in W1 (3.4 μm) and W2
(4.6 μm) from Meisner et al. (2021), and the W3 (12 μm) and
W4 (22 μm) unblurred image stacks from Lang (2014);
collectively, we refer to these custom image stacks as the
unWISE coadds.20
Note that in the SGA-2020 we produce
WISE image coadds for each galaxy (or galaxy group) in the
sample but do not measure the infrared surface-brightness
profiles; however, we intend to deliver the infrared (and
ultraviolet) surface-brightness profiles and integrated photo-
metry in a future version of the SGA (see Section 6).
3.2. Multiwavelength Mosaics and Surface-brightness Profiles
At this point in the analysis, we have multiband optical and
infrared imaging covering roughly half the sky (Section 3.1)
and an input parent catalog of central coordinates and system
diameters for more than half a million sources (Section 2.2).
The next steps are to build custom multiwavelength mosaics
centered on each of these positions (Section 3.2.1); model all
the sources in the field using The Tractor (Section 3.2.2);
and measure elliptical aperture photometry and azimuthally
averaged surface-brightness profiles (Section 3.2.3).
Before proceeding, we briefly summarize the principal
software products we use, as well as the relationship between
them. First, given an astrometrically and photometrically
calibrated image, inverse variance image, and knowledge of
the point-spread function (PSF), The Tractor21
uses the PSF
and a family of two-dimensional galaxy models to forward-
model the observed pixel-level data (Lang et al. 2016; Dey
et al. 2019; D. Lang et al. 2023, in preparation). One of the
principal advantages of The Tractor is that it handles
multiband, multi-CCD, variable-PSF imaging in a statistically
rigorous way, which is especially important when dealing with
the full range of optical and infrared (WISE) data from the
Legacy Surveys. In order to handle the imaging data, the
Legacy Surveys team has developed legacypipe,22
a
photometric pipeline that wraps The Tractor as its fitting
engine and conveniently handles many tasks related to this
imaging data set (Dey et al. 2019). Finally, for the SGA project
specifically, we have developed the SGA23
and legacyha-
los24
software products, which rely on some of the lower-
level legacypipe functionality (with Message Passing
Interface parallelization) but also include code to carry out
the nonparametric photometric analysis, which is one of the
cornerstone data products of the SGA-2020 (see Section 3.3).
3.2.1. Mosaics
Given the diameter of each system and its central coordinates
(GROUP_RA, GROUP_DEC, and GROUP_DIAMETER; see
Section 2.2), we first determine if LS/DR9 imaging exists in
all three grz bands over at least 90% of the area. If not, we
remove that system from further analysis (including, unfortu-
nately, NGC 0224 = M31, where we only have MzLS z-band
imaging). Then, for the remaining objects, we generate g-, r-,
and z-band mosaics with a size that depends on the group size:
for groups with GROUP_DIAMETER < 14′, we generate a
mosaic of diameter 3 × GROUP_DIAMETER; for groups with
14′ < GROUP_DIAMETER < 30′ , we generate a mosaic of
diameter 2 × GROUP_DIAMETER; and for NGC 0598 = M33,
whose GROUP_DIAMETER is > ¢
30 , we use a mosaic diameter
of 1.4 × GROUP_DIAMETER. We also choose the input imaging
according to the following criteria: we use the DECam imaging
(from DECaLS and DES) for all of the SGC, and for the North
Galactic Cap when GROUP_DEC < 32°
.375; and the BASS plus
MzLS imaging otherwise (see Section 4.1.3 of Myers
et al. 2023).
Our analysis begins with reduced and calibrated CCD-level
90Prime, Mosaic-3, and DECam imaging. These reduced data
are generated using the NOIRLab Community Pipeline (CP)
dedicated to each instrument (e.g., Valdes et al. 2014), together
with several custom data-reduction steps developed by the
Legacy Surveys team. We refer the reader to Dey et al. (2019)
and D. J. Schlegel et al. (2023, in preparation) for a detailed
description of these data-reduction procedures. Briefly, we use
Pan-STARRS1 PSF photometry (Chambers et al. 2016;
Finkbeiner et al. 2016) transformed to the natural filter system
of each instrument for photometric calibration25
and Gaia Data
Release 2 (Gaia Collaboration et al. 2018) stellar positions for
astrometry.26
The average photometric precision for bright (but
unsaturated) stars is better than ±10 mmag in grz over the full
footprint, and the astrometric precision is approximately
±0 030 for DECam and Mosaic-3 and ±0 12 mas for
90Prime (Dey et al. 2019).
Accurate large-galaxy photometry depends crucially on
robust and unbiased background-subtraction. For the SGA-
2020, we utilize the same background-subtracted images used
for LS/DR9. As we discuss below and in Section 3.3, however,
the sky-subtracted data do contain systematic errors, which we
intend to mitigate in future versions of the SGA (see the
discussion in Section 6).
First, the CP carefully masks astrophysical sources and then
subtracts the large-scale sky-pattern across the field of view
from each exposure using a low-order spline model derived
from robust statistics measured on the individual CCDs. We
note that the 90Prime, Mosaic-3, and DECam CCDs are
approximately ¢ ´ ¢
30 30 , 17 5 × 17 5, and ¢ ´ ¢
9 18 , respec-
tively, so the angular scale of this background model is much
larger than all but the largest galaxies in the SGA-2020. Next,
the CP subtracts the camera reflection pattern (or pupil ghost)
from the DECam and Mosaic-3 data and the fringe pattern from
the Mosaic-3 z-band and 90Prime r-band data. Telescope
19
See Dey et al. (2019) for a complete list of the DECam programs used.
20
http://unwise.me
21
https://github.com/dstndstn/tractor
22
https://github.com/legacysurvey/legacypipe
23
On GitHub: https://github.com/moustakas/SGA with version 0.1
deposited to Zenodo (Moustakas et al. 2023).
24
On GitHub: https://github.com/moustakas/legacyhalos with version 1.4
deposited to Zenodo (Moustakas & Lang 2023).
25
https://www.legacysurvey.org/dr9/description/#photometry
26
https://www.legacysurvey.org/dr9/description/#astrometry
7
The Astrophysical Journal Supplement Series, 269:3 (25pp), 2023 November Moustakas et al.
reflections from very bright stars are not removed. Next, the CP
aggressively subtracts the high-frequency pattern noise (caused
by a drifting amplifier bias level) present in the Mosaic-3
imaging. The pattern fitting was designed to preserve counts in
smaller galaxies and stars but, unfortunately, has a significant
effect on the low-surface-brightness outer envelopes of the
galaxies in our sample. This pattern-noise subtraction affects all
the MzLS imaging and causes galaxies to appear too green in
the grz color mosaics (see Appendix C). For DECam, we also
subtract a residual g-, r-, and z-band sky pattern and a z-band
fringe pattern from the data using median-scaled templates
derived from multiple exposures (in a given bandpass) within
one or more nights.27
Finally, we remove the spatially varying
sky-background on the smallest scales by dividing each CCD
into 512 pixel boxes, computing the robust median, and using
spline interpolation to build the final background map. During
this step, we mask pixels that lie within the elliptical aperture of
any galaxy in the SGA-2020 parent catalog (from Section 2.1),
as well as Gaia stars and other sources detected in each image.
Finally, with all the reduced data in-hand, we build the full-
field mosaic for each galaxy (or galaxy group) as the inverse-
variance weighted sum of all the available imaging (in each
bandpass) projected onto a tangent plane using Lanczos-3
(sinc) resampling. For the grz imaging, we adopt a constant
pixel scale of 0 262 pixel−1
, and for the unWISE mosaics, we
use 2 75 pixel−1
. The left panels of Figures 5 and 6 show, as
examples, the grz color mosaics for the isolated galaxy
NGC 5016 and PGC 193192, a member of the PGC 193199
Group, respectively.
3.2.2. Tractor Modeling and Masking
We use The Tractor to model all the sources in a given
mosaic, including the large angular-diameter galaxies of
interest. Note that all source detection and model fitting with
The Tractor takes place on these coadded images (triggered
by invoking the --fit-on-coadds option in legacy-
pipe), unlike for the standard DR9 processing in which all
model fitting is done using the unresampled CCD images
jointly (see Dey et al. 2019; D. J. Schlegel et al. 2023, in
preparation).
One issue is that The Tractor tends to fit the high-surface-
brightness central regions of large galaxies at the expense of
their outer envelopes, creating undesirable systematic residuals
in their outer parts. This problem occurs despite the larger
variance—smaller inverse variance—in the central parts from
source Poisson noise. Therefore, before fitting, we multiply the
optical inverse variance mosaics (I) by a factor of I I50 ,
where I50 is the median inverse variance of the whole mosaic.
This scaling tends to reduce I in the central part of the galaxy
and increase it in its outer regions, generally leading to better
modeling results.
In addition, we increase the threshold for detecting and
deblending sources by specifying --saddle-fraction 0.2
and --saddle-min 4.0 (the default values are 0.1 and 2.0,
respectively). The saddle-fraction parameter controls the
fractional peak height for identifying new sources around
existing sources, and saddle-min is the minimum required
saddle-point depth (in units of the standard deviation of pixel
values above the noise) from existing sources down to new
sources. We find these options necessary in order to prevent
excessive shredding and overfitting of the resolved galactic
structure in individual galaxies (e.g., H II regions). Finally, The
Tractor detects sources, creates a segmentation map, and then
uses the mean PSF of the coadd to compute the two-
dimensional, maximum-likelihood model of each source (fitting
all three grz bands simultaneously) from among the following
possibilities: PSF, REX, EXP, DEV, or SER.28
For reference, we
construct the PSF of the coadd as the inverse-variance weighted
average PSF of the individual pixelized PSFs contributing to
the coadd, which is sufficient given that the galaxies we are
interested in, DL(25)  20″, are significantly larger than the
optical image quality, PSFFWHM ≈ 1″–2″.
The middle left panels of Figures 5 and 6 show The
Tractor model image stack for NGC 5016 and the
PGC 193199 Group, respectively. Overall, the model is an
excellent description of the data, particularly for the small,
compact sources in the field. However, note how The
Tractor fits the (resolved) spiral arms in NGC 5016 as
elongated blue “galaxies,” and the extended outer envelopes of
the early-type galaxy models in the PGC 193199 Group
compared to the data. Despite these issues, The Tractor
models of the large galaxies in our sample are extremely useful
and complementary to the nonparametric photometric measure-
ments we carry out in Section 3.2.3.
Using The Tractor models, we next build an image mask,
which we use in Section 3.2.3. First, we read the maskbits29
bit-mask image produced as part of the pipeline, but only retain
the BRIGHT, MEDIUM, CLUSTER, ALLMASK_G, ALL-
MASK_R, and ALLMASK_Z bits. Hereafter, we refer to this
mask as the starmask. Next, we build a residual mask,
which accounts for statistically significant differences between
the data and the Tractor models. In detail, we flag all pixels
that deviate by more than 5σ (in any bandpass) from the
absolute value of the Gaussian-smoothed residual image, which
we construct by subtracting the model image from the data and
smoothing with a 2 pixel Gaussian kernel. This step obviously
masks all sources, including the large galaxies of interest, but
we restore those pixels in the next step. In addition, we
iteratively dilate the mask two times and mask the pixels along
the border of the mosaic with a border equal to 2% the size of
the mosaic.
Then, we iterate on each galaxy in the group from brightest
to faintest based on The Tractor r-band flux and carry out
the following steps: (1) For each galaxy, we construct the
model image from all Tractor sources in the field except the
galaxy of interest and subtract this model image from the data.
(2) We measure the mean elliptical geometry of the galaxy
(center, ellipticity, position angle, and approximate semimajor
axis length) based on the second moment of the light
distribution (hereafter, the ellipse moments) using a
modified version of Michele Cappellari’s mge.find_ga-
laxy30
algorithm (Cappellari 2002). When computing the
ellipse moments, we first median-filter the image with a
3 pixel boxcar to smooth out any small-scale galactic structure,
and we only use pixels with μr < 27 mag arcsec−2
. (3) Finally,
we combine the residual mask with the starmask (using
27
https://www.legacysurvey.org/dr9/sky
28
Briefly, REX is a round (ò = 0) exponential galaxy model with variable half-
light radius; EXP and DEV represent an exponential and de Vaucouleurs (1948)
galaxy profile, respectively; and SER is a Sersic (1968) galaxy model (see Dey
et al. 2019 and the LS/DR9 documentation for more details).
29
https://www.legacysurvey.org/dr9/bitmasks/#maskbits
30
http://www-astro.physics.ox.ac.uk/~mxc/software/#mge
8
The Astrophysical Journal Supplement Series, 269:3 (25pp), 2023 November Moustakas et al.
Boolean logic), but we unmask pixels belonging to the galaxy
based on the ellipse moments geometry using 1.5 times
the estimated semimajor axis of the galaxy.
Occasionally, the preceding algorithm fails in fields contain-
ing more than one galaxy if the central coordinates of one of
the galaxies are masked by a previous (brighter) system. We
consider a source to be impacted if any pixel in a 5 × 5 pixel
box centered on The Tractor position of the galaxy is
masked. In this case, we iteratively shrink the elliptical mask of
any of the previous galaxies until the central position of the
galaxy currently being analyzed is unmasked. We emphasize
that this algorithm is not perfect, particularly in very crowded
galactic fields like the center of the Coma Cluster, but we
intend to improve it in future versions of the SGA. Another
occasional failure mode is if the flux-weighted position of the
galaxy based on the ellipse moments differs by The
Tractor position by more than 10 pixels, which can happen
in crowded fields and near bright stars and unmasked image
artifacts; in this case, we revert to using The Tractor
coordinates and model geometry.
The bottom left panels of Figures 5 and 6 show the final
masked r-band image for NGC 5016 and PGC 193192,
respectively.
3.2.3. Surface-brightness Profiles
With the multiwavelength mosaics and per-galaxy image
masks in-hand, we next measure the surface-brightness profiles
Figure 5. Illustration of the key steps and data products of the SGA-2020 pipeline for one example galaxy, NGC 5016. The three panels on the left-hand side show
(top left) a color montage of the optical imaging; (middle left) a color montage of the corresponding Tractor model image; and (bottom left) the r-band image with
masked pixels zeroed out (white pixel values). The nested black ellipses in this panel correspond to nine surface-brightness levels between μr = 22 and
26 mag arcsec−2
in 0.5 mag arcsec−2
steps, with the solid blue isophote representing the outermost, R(26), size of the galaxy. The right-hand panels show (top right)
the azimuthally averaged g- (blue), r- (green), and z-band (red) surface-brightness profiles as a function of the semimajor axis; (middle right) the observed-frame g − r
(purple) and r − z (orange) color profiles; and (bottom right) the apparent brightness of NGC 5016 in g (filled blue squares), r (filled green circles), and z (filled red
triangles) measured within the same elliptical apertures shown in the lower left panel. The dashed- and solid-gray lines in the top right panel indicate, for reference, the
r-band half-light radius from Equation (2) and the R(26) radius, respectively, and the bottom right panel also shows the best-fitting curve-of-growth models
(independently fit to the photometric data in each bandpass) given by Equation (1). The legend in the lower right panel also provides the integrated (asymptotic) grz
magnitudes for this galaxy.
9
The Astrophysical Journal Supplement Series, 269:3 (25pp), 2023 November Moustakas et al.
and photometric curves of growth for each galaxy in the sample
using the standard ellipse-fitting and aperture photometry
techniques in photutils31
(Bradley 2023). We assume a
fixed elliptical geometry as a function of semimajor axis using
the ellipse moments measured in Section 3.2.2, and
robustly determine the surface brightness along each elliptical
path from the light-weighted central pixel to 2 times the
estimated semimajor axis of the galaxy in a 1 pixel (0 262)
interval. In detail, we measure the surface brightness (and the
uncertainty) using two σ clipping iterations, a 3σ clipping
threshold, and median-area integration.32
From the r-band surface-brightness profile, we also robustly
measure the size of the galaxy at nine equally spaced surface-
brightness thresholds between μr = 22 and 26 mag arcsec−2
. We
perform these measurements by fitting a linear model to the
surface-brightness profile converted to mag arcsec−2
versus r1/4
(which would be a straight line for a de Vaucouleurs galaxy
profile), but only consider measurements that are within
±1 mag arcsec−2
of the desired surface-brightness threshold.
To estimate the uncertainty in the resulting radius, we generate
30 Monte Carlo realizations of the surface-brightness profile and
use the standard deviation of the resulting distribution of radii.
We also measure the curve of growth in each bandpass using
the tools in photutils.aperture. Briefly, we integrate
the image and variance image in each bandpass using elliptical
apertures from the center of the galaxy to 2 times its estimated
semimajor axis (based on the ellipse moments), again
with a 1 pixel (0 262) interval.33
We fit the resulting curve of
growth, m(r), using the following empirical model:
⎜ ⎟
⎡
⎣
⎢
⎛
⎝
⎞
⎠
⎤
⎦
⎥
( ) ( )
a
= + +
a
-
m r m m
r
r
log 1 , 1
e
tot 0 1
0
2
Figure 6. Like Figure 5, but for PGC 193192, the second-largest member of the PGC 193199 Group.
31
https://photutils.readthedocs.io/en/stable
32
In other words, we use nclip=2, sclip=3, and integrmode=me-
dian, as documented in the photutils.isophote.Ellipse.fit_-
image method.
33
Unfortunately, our original elliptical aperture photometry had an
irrecoverable bug, so in the final release of the SGA-2020, we infer the
aperture photometry from the surface-brightness profiles; see Appendix C for
details.
10
The Astrophysical Journal Supplement Series, 269:3 (25pp), 2023 November Moustakas et al.
where mtot, m0, α1, α2, and r0 are constant parameters of the
model, and r is the semimajor axis in arcseconds. In our
analysis, we take the radius scale factor r0 = 10″ to be fixed
(which makes α1 dimensionless). Note that, in the limit
r → ∞ , mtot is the total, integrated magnitude. Using this
model, we infer the half-light semimajor axis length, r50,
analytically from the best-fitting model parameters:
⎜ ⎟
⎧
⎨
⎩
⎡
⎣
⎢
⎛
⎝
⎞
⎠
⎤
⎦
⎥
⎫
⎬
⎭
( )
( )
a
= - -
a
-
r r
m
1
exp
log 0.5
0.4
1 , 2
50 0
1
10
0
1 2
where r50 is measured in arcseconds, and m0 is in magnitudes.
3.3. Summary and Validation of SGA-2020 Data Products
The final SGA-2020 sample consists of 383,620 galaxies in
the ≈20,000 deg2
LS/DR9 imaging footprint. The final catalog
contains precise coordinates; multiwavelength mosaics; model
images and photometry from The Tractor; azimuthally
averaged optical surface-brightness profiles; aperture photo-
metry and radii; and extensive metadata for all galaxies in this
sample. In this section, we briefly highlight some of these
measurements; for a comprehensive description of the SGA-
2020 data products and how they can be accessed, see
Appendix B.
Figure 7 shows the celestial positions of the galaxies in the
SGA-2020 in an equal-area Mollweide projection. The curved
black line represents the Galactic plane, which divides the
sample into the North Galactic Cap and SGC imaging regions
of the LS/DR9 footprint (see Dey et al. 2019). The total area
subtended by the sample is 19,721 deg2
, covering nearly 50%
of the sky.
In Figure 8, we highlight a handful of the measured SGA-
2020 properties, as well as the relationships between them. In a
multivariate corner plot (Foreman-Mackey 2016), we show rR
(26), the r-band magnitude within R(26), where R(26) is
the semimajor axis at the 26 mag arcsec−2
isophote;
[ ( )]
( ) ( )
m p
á ñ º +
r R
2.5 log 26
r R R
, 26 26 10
2 , the average r-band
surface brightness within R(26); f is the galaxy position angle
(measured counterclockwise from north to east); and
ò ≡ 1 − b/a, the galaxy ellipticity, where b/a is the minor-to-
major axis ratio. Note the expected strong correlation between
R(26) and rR(26), and the anticorrelation between ò and 〈μ〉r,R
(26), which is due to the light in more edge-on galaxies being
attenuated more by the larger column of internal dust
attenuation (famously known as the Holmberg “transparency
test”; Holmberg 1958; Giovanelli et al. 1994).
In Figure 9, we compare some of the new geometrical
measurements in the SGA-2020 against the measurements
collated in HyperLeda. In panel (a), we plot Δdecl. versus
ΔR.A., the difference in equatorial coordinates. The overall
agreement in positions is very good; the median, mean, and
±1σ scatter are 0 3, 0 4, and ±0 5, respectively, although the
coordinates of individual (especially irregular and low-surface-
brightness) galaxies differ by up to tens of arcseconds. In
Figure 10, we show a randomly selected set of 20 galaxies
where the central coordinates in the SGA-2020 and HyperLeda
differ by more than 3″. Although reasonable algorithms may
disagree about the central positions of some galaxies due to
dust lanes or the lack of a prominant central bulge (e.g.,
NGC 4948 = IC 4156 and ESO293-034), it is clear that the
coordinates in the SGA-2020 for most of the examples
highlighted in Figure 10 are more accurate in measuring the
centroid of galaxies with bright cores and the center of light for
more diffuse systems, even for very large, well-known galaxies
like NGC 4636 = UGC 07878, and NGC 3521 = UGC 06150.
Next, in Figure 9(b), we plot DL(25) (defined in Section 2.1)
versus D(25), the SGA-2020 major-axis diameter measured at
the 25 mag arcsec−2
isophote. Not unexpectedly, we find a
strong correlation between the two quantities, although D(25)
is ≈20% larger, on average, than DL(25), presumably due to
the deeper optical imaging used in the SGA-2020. Finally, in
Figures 9(c) and (d), we plot the correlation between position
angle, f, and ellipticity, ò, respectively, between HyperLeda
and the SGA-2020. For more than 95% of the sample, the
agreement between the two f and ò measurements are
excellent.
Figure 7. Distribution of 383,620 galaxies in the final SGA-2020 sample (to be compared with Figure 3, but note the different color-bar scales).
11
The Astrophysical Journal Supplement Series, 269:3 (25pp), 2023 November Moustakas et al.
In order to validate our measurements further, in Figure 11,
we compare the SGA-2020 coordinates and mean geometrical
measurements against the WISE Extended Source Catalog of
the 100 Largest Galaxies (hereafter, WXSC-100; Jarrett et al.
2019).34
Of the 104 galaxies in the WXSC-100 sample, 59 are
in the SGA-2020. Note that WISE imaging is less affected by
dust extinction and more sensitive to the underlying spatial
distribution of the older stellar population compared to our
optical imaging, so we do expect some differences in these
measurements.
Focusing on Figure 11(a) first, we find good overall
agreement in the central coordinates: the median, mean, and
±1σ scatter in the coordinate differences are 0 76, 2 3, and
±2 4, respectively, notably smaller than the ≈6″ FWHM
WISE W1 PSF (Wright et al. 2010). However, there are some
notable outliers, the three largest of which (NGC 0247,
NGC 2403, and NGC 4395) have been annotated in the
figure. Examining the optical and infrared mosaics of these
and other sources in this comparison sample, we find that
the differences are due to a combination of a lack of a
distinct bright center and, for a handful of cases, errors in the
SGA-2020. For example, both NGC 2403 and NGC 0247
are late-type spirals (Hubble type 6 or SABc; see de
Vaucouleurs et al. 1991) without a clear, bright nucleus, so
the differences are arguably defensible. On the other hand, for
NGC 4395 and a handful of other objects, the SGA-2020
central coordinates are likely incorrect (by up to ≈7″) relative
to those published in the WSXC-100 (see Section 6 for
additional discussion).
Turning next to Figure 11(b), we compare D(26) in the
SGA-2020 to 2 × RW1 in the WXSC-100; 2 times the radius
of the galaxy measured down to an isophotal level of
μW1,AB ≈ 25.7 mag arcsec−2
. We find the two sizes to be
reasonably well correlated, despite the differences in imaging
Figure 8. Multivariate distribution of a subset of measured SGA-2020 galaxy properties. From left to right along the bottom panels, we show rR(26), the r-band
magnitude within R(26), where R(26) is the semimajor axis at the 26 mag arcsec−2
isophote; 〈μr,R(26)〉, the mean surface brightness within R(26); f, the galaxy
position angle; and ò, the galaxy ellipticity. The contours enclose 50%, 75%, 95%, and 99.5% of the blue points and have been smoothed by a 0.8 pixel Gaussian
kernel.
34
https://vislab.idia.ac.za/research-wxsc
12
The Astrophysical Journal Supplement Series, 269:3 (25pp), 2023 November Moustakas et al.
effective wavelength, albeit divided into two broad sequences.
The sizes of the spirals (Hubble types 2 to 3—Sab to Sb) and
later generally follow the one-to-one relation (median
difference of −0.004 dex) with a scatter of 0.11 dex (±30%),
while the earlier-type, spheroidal galaxies (Hubbles types −5 to
1—E to Sa) are offset to larger sizes in the WXSC-100 by
−0.25 dex (≈70%) with a scatter of 0.16 dex (±50%). As
discussed by Jarrett et al. (2019), the WISE W1 band is very
sensitive to light from evolved stars down to low surface-
brightness levels (particularly due to its large pixels, 2 75), so
it is not surprising for the WSXC-100 (infrared) diameters to be
notably larger than the (optical, r-band) D(26) diameters in the
SGA-2020. Moreover, the extended, low-surface-brightness
envelopes of massive spheroidal galaxies are especially prone
to oversubtraction (e.g., Blanton et al. 2011; Bernardi et al.
2013), which may also be contributing to the systematically
smaller sizes of the early-type galaxies in the SGA-2020
relative to the WSXC-100 (see also Section 6).
Finally, in Figures 11(c) and (d), we compare the position
angles and ellipticities reported in the SGA-2020 and WXSC-
100 catalogs, respectively, and find very good agreement: the
mean differences are fSGA − fWXSC = 0°
.83 ± 7°
.7, and
òSGA − òWXSC = 0.017 ± 0.12.
4. Catalog Completeness
Quantifying the completeness of the SGA-2020 is difficult
because the parent sample is largely defined by HyperLeda (see
Section 2.1), which aggregates data from many different
surveys—each with their own potentially complicated selection
function—from the ultraviolet to the radio. This heterogeneity
can be clearly seen in Figure 7 as variations in the sample
surface density on both large and small angular scales and
between the North Galactic Cap and SGC. Indeed, as we
discuss in Section 6, one of the primary goals of the next
version of the SGA is to redefine the parent sample using the
Figure 9. Comparison of select observed properties reported in HyperLeda against the newly measured quantities in the SGA-2020. (a) Difference in central
coordinates; (b) DL(25) vs. D(25), the major-axis diameter measured at the 25 mag arcsec−2
isophote; (c) galaxy position angle, f; and (d) galaxy ellipticity,
ò ≡ 1 − b/a, where b/a is the minor-to-major axis ratio. In every panel, the contours enclose 50%, 75%, 95%, and 99.5% of the blue points and have been smoothed
by a 0.8 pixel Gaussian kernel. In panels (b), (c), and (d), the solid red line represents the one-to-one relation.
13
The Astrophysical Journal Supplement Series, 269:3 (25pp), 2023 November Moustakas et al.
Legacy Surveys imaging itself, in order to begin with a more
uniform and quantifiable selection function over the full area.
Nevertheless, we can still assess the SGA’s completeness by
comparing against existing catalogs that include large angular-
diameter galaxies.
We choose to characterize the completeness of the SGA-
2020 by comparing against HECATE (version 1.1; Kovlakas
et al. 2021).35
HECATE is an all-sky value-added catalog of
≈200,000 galaxies at z < 0.047 (200 Mpc), which contains a
breadth of both observed and derived (physical) galaxy
properties. Although HECATE also uses HyperLeda to define
its parent sample, the comparison is still valuable because the
analysis carried out by Kovlakas et al. (2021) is independent of
ours, and it includes additional completeness checks against
NED and against the local B-band luminosity function.
First, from the parent HECATE sample of 204,733 galaxies,
we identify 154,093 objects (75%) to be within the LS/DR9
imaging footprint using the LS/DR9 random catalogs, which
contain a wealth of information about the imaging data
(bandpass coverage, depth, PSF size, etc.) at random positions
over the footprint (Myers et al. 2023).36
Specifically, we merge
together five random catalogs to achieve an effective source
density of 12,500 deg−2
, and conservatively retain all
HECATE objects whose center lies within ¢
2 of one of these
points. Next, we remove 2844 galaxies without any size
information in HECATE; visually inspecting a random subset
of these reveals that they are predominantly small objects, D
(25) = 30″, well under the SGA-2020 angular diameter limit
(Figure 4). Finally, from the remaining 151,249 objects, we
match 95,800 (63%) of them to an object in the SGA-2020
using the HyperLeda PGC number (Paturel et al. 1989;
Makarov et al. 2014), which both HECATE and the SGA-
2020 record (where it is defined). We choose to use the PGC
designation because the differences in coordinates can be
Figure 10. Randomly selected gallery of 20 galaxies where the light-weighted central coordinates measured in the SGA-2020 differ by more than 3″ from the
coordinates published in HyperLeda, sorted by increasing DL(25) from the upper left to the lower right. The white bar in the lower left corner of each panel represents
30″, and the blue and red cross-haired ellipses represent the SGA-2020 and HyperLeda positions and mean geometry, respectively. Although the centers of some of
these systems are somewhat ambiguous due to dust lanes and other irregular features (e.g., NGC 4607), the SGA-2020 coordinates are generally superior.
35
https://hecate.ia.forth.gr
36
https://www.legacysurvey.org/dr9/files/#random-catalogs-randoms
14
The Astrophysical Journal Supplement Series, 269:3 (25pp), 2023 November Moustakas et al.
significant, such that a single matching radius results in a
nonnegligible number of false-positives. For example, among
the PGC-matched samples, the mean difference in coordinates
is 0 50 ± 0 92, but with a tail that extends out to 80″ for
IC 2574, a well-known ¢
18. 7-diameter late-type (SABm) galaxy
with no well-defined center. In fact, 126 PGC-matched galaxies
have coordinate differences larger than 10″, 90% of which have
( ) > ¢
D 26 1 . Nevertheless, with these caveats in mind, we can
still match an additional 178 objects using a 3″ matching
radius, resulting in a final matched sample of 95,978 galaxies.
In Figure 12, we plot bt-band magnitude versus 2 × R1 for
the 154,093 HECATE galaxies, which overlap the LS/DR9
footprint, where R1 is the semimajor axis length reported in
HECATE. The dashed red histogram (corresponding to the
right-hand axis) shows the raw fraction of matching HECATE-
SGA galaxies as a function of galaxy size, in uniform 0.2 dex
wide bins of angular diameter between ≈2″ and » ¢
15.8. The
small numbers written above each bin of the histogram report
the number of HECATE galaxies in that bin. In addition, the
horizontal gray line indicates, for reference, a matching fraction
of 100%.
Taken at face value, the (raw) matching fractions shown in
Figure 12 are surprisingly poor. For example, these results
suggest that the SGA-2020 is missing 3%–5% of galaxies with
angular diameters between ¢
2.5 and ¢
10 and a whopping 20% of
the galaxies between ¢
10 and ¢
16 . In total, we find 2.94% (367/
12,487) of the HECATE galaxies with ´ > ¢
R
2 1
1 to be
missing from the SGA-2020. To explore this purported
incompleteness, we visually inspect the LS/DR9 imaging at
the position of the 367 “missing” galaxies and find the
following results: 20 objects are Local Group dwarf galaxies,
which are intentionally excluded from the SGA-2020 (see
Section 2.1); 44 objects fall on the edge of the imaging
footprint or other serendipitous (but unfortunate) gaps in three-
band (grz) coverage; 64 galaxies are real, but the angular
diameters reported in HECATE are overestimated, sometimes
by a significant factor; 78 are part of a larger galaxy (e.g., H II
regions) and other kinds of photometric shreds; and 24 are
entirely spurious. The solid purple histogram in Figure 12
shows the corrected fraction of HECATE-SGA matches after
accounting for these errors. In the end, we find that just 137 out
of 12,257 (1.12%) HECATE galaxies with ´ > ¢
R
2 1
1 are real
and genuinely missing from the SGA-2020.
Although the fraction of missing galaxies is relatively low,
since both the SGA-2020 and HECATE ultimately originate (in
large part) from HyperLeda, it is surprising that any objects are
missing from the SGA-2020, especially ones with angular
diameters larger than 1′. Although we do not know why these
objects do not appear in our parent HyperLeda catalog, we
suspect that an issue with the database query may be ultimately
responsible (see Appendix A). In any case, we intend to ensure
that these and other missing objects serendipitously identified
by the SGA team through visual inspection are included in the
next version, as we discuss in Section 6.
Figure 11. Comparison of the (a) central coordinates; (b) diameters; (c) position angles, f; and (d) ellipticities, ò measured in the SGA-2020 against those reported in
the WXSC-100 (Jarrett et al. 2019) for an overlapping sample of 59 galaxies. Individual galaxies are color coded by numerical Hubble type, from −5 (E) to 9 (Irr) (see
de Vaucouleurs et al. 1991), as indicated by the color bar. See the text in Section 3.3 for the definition of the diameter measured in the WXSC-100 catalog and a
detailed discussion of the observed trends.
15
The Astrophysical Journal Supplement Series, 269:3 (25pp), 2023 November Moustakas et al.
What about the completeness of the SGA-2020 among
smaller angular-diameter galaxies,  ´ < ¢
 R
25 2 1
1 ?
According to Figure 12, the completeness remains relatively
high, above ≈90%. However, our analysis of the > ¢
1 -diameter
galaxies reveals that more than half of the HECATE objects
missing from the SGA-2020 either have incorrect (or
overestimated) diameters, or are spurious, and we have checked
that these and other effects increase steeply with decreasing
angular diameter (see, for example, Figure 2). Therefore, we
conclude that the SGA-2020 completeness is likely 95% for
galaxies with angular diameters between ≈25″ and ¢
1 .
None of this discussion, of course, addresses the surface-
brightness incompleteness of the sample, since both HECATE
and the SGA-2020 inherit whatever incompletenesses and
heterogeneities are present in HyperLeda, which aggregates
data from many different surveys. For example, regions of the
sky that have been imaged by the SDSS (Strauss et al. 2002;
Blanton et al. 2011) or DES (Dark Energy Survey
Collaboration et al. 2016; Abbott et al. 2021) have uniform,
deep optical imaging (μr,50 < 24.5 and μr < 25.6 mag arcsec−2
in the SDSS and DES, respectively, where μr,50 is the r-band
half-light surface brightness, and the DES surface brightness is
measured in a 1 95 diameter aperture), but these surveys cover
just 34% (SDSS; 14,000 deg2
) and 12% (DES; 5000 deg2
) of
the sky. Other optical and near-infrared surveys like 2MASS
(Jarrett et al. 2000; Skrutskie et al. 2006) and Pan-STARRS1
(PS1; Chambers et al. 2016) cover all or nearly all of the sky
(100% and 75% for 2MASS and PS1, respectively); however,
2MASS is relatively shallow compared to these other surveys
(μr ≈ 22.7 mag arcsec−2
assuming a median r − Ks ≈ 2.7 color
for low-redshift galaxies; Jarrett et al. 2019) while the
photometry of bright, large angular-diameter galaxies in PS1
is known to be problematic (Magnier et al. 2020; Makarov
et al. 2022). In other words, it is difficult to fully assess the
incompleteness of the SGA-2020 given the variations in the
completeness of the surveys that contribute to HyperLeda.
Nevertheless, we can still make some quantitative statements
using the results shown in Figure 8 and the comparisons with
HECATE, above. Based on the correlation between the mean
surface brightness, 〈μr,R(26)〉, and the apparent brightness
within the 26 mag arcsec−2
isophote, rR(26), we conclude that
the SGA-2020 is approximately 95% complete for galaxies
with R(26)  25″, rR(26)  18, and 〈μr,R(26)〉  26 mag arcsec−2
;
in addition, the SGA-2020 is more than 99% complete for
galaxies larger than ¢
1 and brighter than rR(26)  16 down to the
same surface-brightness limit.
5. Scientific Applications
As discussed in the Introduction, atlases of large angular-
diameter galaxies have played a pivotal role in observational
cosmology and in our modern understanding of galaxy
astrophysics and the galaxy–halo connection. By delivering a
carefully constructed catalog of known “large” galaxies with
new deep optical and infrared imaging from the DESI Legacy
Imaging Surveys, we anticipate the SGA-2020 to play a
commensurately high-impact role in a wide range of
observational studies of large, nearby, well-resolved galaxies.
The growing spectroscopic data set from DESI is an
especially powerful complement to the SGA-2020. As
discussed in Section 1.2, DESI is targeting the SGA-2020
sample over 14,000 deg2
(70% of the LS/DR9 footprint) as
part of the flux-limited (r < 20.175) BGS (Hahn et al. 2023).37
In addition to providing precise spectroscopic redshifts, the
spectral coverage (3600–9800 Å), instrumental resolution
( –
»
 2000 5000), and spectrophotometric precision (±2%)
of the DESI spectra (Abareshi et al. 2022; Guy et al. 2023) will
yield important insights into the physical conditions and stellar
Figure 12. bt-band magnitude vs. 2 × R1 for 154,093 objects in the HECATE value-added galaxy catalog (Kovlakas et al. 2021), which lie within the LS/DR9
imaging footprint, where R1 is the semimajor axis length in HECATE. For reference, the contours enclose 10%, 25%, 50%, 75%, 95%, and 99% of the points. The
dashed-red and solid purple histograms (corresponding to the right-hand vertical axis) represent, respectively, the raw and corrected fraction of HECATE galaxies,
which match a source in the SGA-2020 galaxy as a function of angular diameter. Finally, the small numbers written above each bin of the histograms report the
number of HECATE galaxies in that 0.2 dex wide bin.
37
In detail, BGS is observing all galaxies brighter than r = 19.5 (BGS Bright)
and a color-selected subset of galaxies with 19.5 < r < 20.175 (BGS Faint);
the color selection is tuned to ensure good redshift success at this flux level in
bright sky conditions.
16
The Astrophysical Journal Supplement Series, 269:3 (25pp), 2023 November Moustakas et al.
populations of the central regions of these systems (for recent
reviews, see Conroy 2013; Kewley et al. 2019; Sánchez 2020,
and references therein).
Figure 13 illustrates the tremendous scale of the DESI data
set. Although the majority of galaxies in the SGA-2020 have
previously measured redshifts in HyperLeda (264,865 galaxies,
or approximately 70% of the sample), these redshifts come
from a wide range of different surveys spanning many decades.
By the end of its 5 year Main Survey (2021–2026), DESI will
produce a homogeneous, high-precision spectrophotometric
data set for more than 300,000 SGA-2020 targets over
14,000 deg2
as part of a larger sample of approximately 14
million BGS targets and more than 25 million fainter
extragalactic targets (DESI Collaboration et al. 2023b; Myers
et al. 2023). Indeed, in its 2023 June Early Data Release
(EDR), DESI has already delivered high-quality spectroscopy
for nearly 7700 SGA-2020 targets, which were observed during
the DESI Survey Validation period (DESI Collaboration et al.
2023a).38
In addition to these Main Survey observations, one of the
especially exciting and synergistic secondary DESI programs is
the Peculiar Velocity survey (Saulder et al. 2023).39
This
program aims to use the fundamental plane and Tully–Fisher
relations as direct distance indicators in order to map the
peculiar-velocity field at z < 0.15; this map will be used to
place new, stringent constraints on the cosmological parameters
and the growth of large-scale structure (e.g., Strauss & Willick
1995). As part of this effort, galaxies in the SGA-2020 are
being targeted not only in their bright nucleus but also at
various positions along their major axis and other “off-center”
positions (Saulder et al. 2023; K. A. Douglass et al. 2023, in
preparation). Together with the central spectra, these data will
help constrain the total (dynamical) masses and physical
conditions in a sample of tens of thousands of SGA-2020
galaxies.
The SGA-2020 also has the potential to support the growing
number of time-domain and multimessenger astronomical
discoveries, wherein the observations of transient astrophysical
events are detected by one or more messenger particles
(electromagnetic radiation, neutrinos, cosmic rays, and
gravitational waves; e.g., Neronov 2021). In the case of
gravitational wave events, for example, identifying the host
galaxy and, ideally, the electromagnetic counterparts of these
events is extremely challenging due to the significant positional
error ellipse of gravitational wave observations, 100 deg2
(Gehrels et al. 2016; Abbott et al. 2020). Statistically complete
catalogs of large, nearby galaxies with accurate coordinates,
size information, and multiband photometry like the SGA-2020
are needed to help identify the most likely source of
gravitational wave events (e.g., Gehrels et al. 2016; Ducoin
et al. 2020; Kovlakas et al. 2021).
Finally, we highlight one other area where the SGA-2020 is
playing an important ancillarly role. The SGA-2020 is being
used as a foreground angular mask for all the DESI dark-time
cosmological tracers: luminous red galaxies (LRGs; Zhou et al.
2023); emission-line galaxies (ELGs; Raichoor et al. 2023);
and quasars (QSOs; Chaussidon et al. 2023). Like bright stars,
large angular-diameter galaxies can bias the small-scale
clustering signal in cosmological analyses because photometric
pipelines tend to shred structurally resolved galaxies into many
smaller sources. Similarly, the same angular mask can be used
as an external input when building photometric catalogs from
other imaging data; for example, an early version of the SGA-
2020 was used to maximize the purity of the 3–5 μm unWISE
photometric catalog of 2 billion infrared sources (Schlafly et al.
2019). In other words, by providing a high-quality geometric
mask, the SGA-2020 is helping these and other observational
programs fulfill their scientific promise.
6. Summary and Future Work
We present the 2020 version of the SGA, SGA-2020, a
multiwavelength optical and infrared imaging atlas of 383,620
large angular-diameter galaxies covering ≈20,000 deg2
.40
The
SGA-2020 contains precise coordinates; optical (grz) and
WISE/W1 through W4 (3.4–22 μm) infrared mosaics; model
images and photometry based on the state-of-the-art image
modeling code, The Tractor; azimuthally averaged grz
surface-brightness and color profiles; elliptical curves of
growth and half-light radii; and extensive ancillary information
Figure 13. Left: celestial distribution of galaxies in the SGA-2020, which are also DESI targets (color bar) covering ≈14,000 deg2
(Myers et al. 2023) compared to the
full ≈20,000 deg2
footprint of the SGA-2020 (dark gray region in the SGC). Right: redshift distribution of galaxies in the SGA-2020 with existing spectroscopic
redshifts from HyperLeda (blue histogram) and from the DESI Early Data Release (EDR; orange histogram). The legend in this figure also indicates the approximate
final number of SGA-2020 galaxies that DESI will observe by the end of the 5 year Main Survey.
38
https://data.desi.lbl.gov/doc/releases/edr
39
Secondary programs are bespoke scientific programs, which utilize
whatever spare fibers may be available in a given DESI tile or pointing of
∼5000 fibers (see Myers et al. 2023 for details).
40
Excluding the highest regions of dust extinction in the Galactic plane,
|b| > 20°, the SGA-2020 covers 74% of the available ≈27,200 deg2
of
extragalactic sky.
17
The Astrophysical Journal Supplement Series, 269:3 (25pp), 2023 November Moustakas et al.
for the full sample. The complete SGA-2020 can be accessed
through the dedicated web portal, https://sga.
legacysurvey.org.
Our measurements of the central coordinates, isophotal
diameters, ellipticities, and position angles show overall good
agreement with published measurements collated in the
HyperLeda extragalactic database and in the WISE Extended
Source Catalog of the 100 Largest Galaxies (WXSC-100;
Jarrett et al. 2019). Disagreements in these quantities between
the SGA-2020 and HyperLeda are generally due to erroneous
measurements in HyperLeda; however, the comparison with
WXSC-100 identifies small but notable (≈few arcsecond)
errors in the SGA-2020 coordinates for some of the largest
(> ¢
5 ) galaxies in the sample.
We evaluate the completeness of the SGA-2020 by
comparing against the HECATE all-sky, value-added galaxy
catalog (Kovlakas et al. 2021). We find that the SGA-2020 is
missing approximately 1% of known galaxies larger than 1′ and
≈5% of galaxies between 25″ and1′; however, we compute
these statistics only after determining (through visual
inspection) that nearly 30% of the sources larger than1′ in
HECATE that are missing from the SGA-2020 are either
spurious or photometric shreds. Overall, we estimate that the
SGA-2020 is more than 95% complete for galaxies larger than
R(26) ≈ 25″ and r < 18 measured at the 26 mag arcsec−2
isophote in the r band.
We discuss some of the potential scientific applications of
the SGA-2020 and highlight the ongoing amassing of high-
quality optical spectrophotometry from the DESI (DESI
Collaboration et al. 2023b) survey. Approximately 70% of
the SGA-2020 sample lies within the 14,000 deg2
DESI
footprint and is being targeted as part of the BGS (Hahn
et al. 2023). To date, 7700 DESI spectra of SGA-2020 galaxies
are publicly available as part of the DESI EDR (DESI
Collaboration et al. 2023a), representing less than 3% of the
final sample. In addition, the DESI Peculiar Velocity secondary
program (Saulder et al. 2023) is obtaining tens of thousands of
major-axis, minor-axis, and other off-center spectra of SGA-
2020 galaxies in order to constrain the peculiar-velocity field at
z < 0.15, further enhancing the scientific impact of the SGA-
2020. Finally, we highlight the potential impact of the SGA-
2020 for identifying the electromagnetic counterparts of time-
domain and multimessenger astronomical events.
We conclude by discussing some of the planned improve-
ments of the SGA. Future versions will focus on four broad
areas, listed here in no particular order:
1. Completeness. As discussed in Section 4, the SGA-2020
inherits the heterogeneity and incompleteness of the
parent HyperLeda sample. To mitigate these issues, we
intend to build a new parent sample of candidate large
angular-diameter galaxies by detecting them from the
Legacy Surveys imaging data themselves using a
combination of traditional source-detection techniques
(e.g., convolution kernels optimized for detecting large
galaxies) and one or more state-of-the-art deep-learning
techniques (e.g., Stein et al. 2022; Zaritsky et al. 2023).
By inserting artificially generated galaxies of varying
size, integrated flux, and surface brightness into the data,
we intend to quantify the completeness limits of the
sample as a function of these observational quantities.
2. Centroiding and masking. Another area of improvement
is how the SGA pipeline handles mergers and other
systems with two or more close companions (e.g., in
dense cluster environments like the Coma Cluster), as
well as galaxies near bright stars. Evaluating and
optimizing the performance of the pipeline in these
circumstances will be part of a larger visual inspection
effort (e.g., Walmsley et al. 2022) to ensure that the
central coordinates of the largest galaxies in the SGA-
2020 are accurate (or at least defensible, in the case of
galaxies with irregular morphologies) compared with
previous independent measurements (e.g., see the
discussion in Section 3.3).
3. Background subtraction. As discussed in Section 3.2.1,
aggressive subtraction of the Mosaic-3 pattern-noise
significantly impacts the z-band photometry of the SGA-
2020 galaxies in the northern (BASS+MzLS) portion of
the footprint, decl.  32°, including some of the most
famous and largest angular-diameter galaxies in the
sample like NGC 5194 = M51a and NGC 5457 = M101.
Moreover, we show in Section 3.3 that the outer envelopes
of the early-type, spheroidal galaxies in the atlas have
likely been oversubtracted, thereby biasing their surface-
brightness profiles and inferred isophotal diameters. We
intend to address both these issues in a future version of
the SGA (see, for example, Li et al. 2022 for a new sky-
subtraction technique, which addresses the latter issue).
4. Extensions in footprint and wavelength. Since the SGA-
2020 was finalized, thousands of square degrees of
additional DECam imaging have been acquired; we
intend to use these data to extend the SGA footprint.41
In
addition, in the next version of the SGA, we intend to (1)
include DECam i-band imaging, which is available for
more than 15,000 deg2
of area; (2) regenerate the
unWISE coadds but also add ultraviolet (1528 and
2271 Å) coadds from the GALEX (Martin et al. 2005;
Morrissey et al. 2005), where GALEX data are available;
and (3) measure the surface-brightness profiles in all the
available bandpasses from 0.15 to 22 μm. These
additional measurements will further increase the
scientific impact and long-term legacy value of the SGA.
Finally, future version of the SGA will also include ancillary
spectroscopic redshifts and spectrophotometric measurements
from DESI and, eventually, a wide range of physical properties
(stellar masses, star formation rates, etc.) derived using state-of-
the-art spectral energy distribution modeling (e.g., Leja
et al. 2017).
Acknowledgments
We gratefully acknowledge specific contributions and
thoughtful feedback from Michael Blanton, Yao-Yuan Mao,
and Kevin Napier, and from former Siena College under-
graduate students Alissa Ronca and Luis Villa, who contributed
to an early version of the SGA web-application. In addition, we
thank Mara Salvato and the anonymous referee for helpful
comments on the manuscript.
J.M. gratefully acknowledges funding support from the U.S.
Department of Energy, Office of Science, Office of High
Energy Physics under award No. DE-SC0020086 and from the
National Science Foundation under grant AST-1616414. A.D.
M. was supported by the U.S. Department of Energy, Office of
41
See, e.g., https://www.legacysurvey.org/dr10.
18
The Astrophysical Journal Supplement Series, 269:3 (25pp), 2023 November Moustakas et al.
Science, Office of High Energy Physics, under award No. DE-
SC0019022. A.D., S.J., and B.A.W.’s research activities are
supported by the NSF’s NOIRLab, which is managed by the
Association of Universities for Research in Astronomy
(AURA) under a cooperative agreement with the National
Science Foundation.
We acknowledge the use of the HyperLeda database, and we
are especially grateful for the time and expertise contributed by
Dmitry Makarov to this project. This research has also made
extensive use of the NASA/IPAC Extragalactic Database
(NED), which is funded by the National Aeronautics and Space
Administration and operated by the California Institute of
Technology; NASAʼs Astrophysics Data System; and the arXiv
preprint server.
The Legacy Surveys consist of three individual and
complementary projects: the Dark Energy Camera Legacy
Survey (DECaLS; Proposal ID #2014B-0404; PIs: David
Schlegel and Arjun Dey), the Beijing-Arizona Sky Survey
(BASS; NOAO Prop. ID #2015A-0801; PIs: Zhou Xu and
Xiaohui Fan), and the Mayall z-band Legacy Survey (MzLS;
Prop. ID #2016A-0453; PI: Arjun Dey). DECaLS, BASS, and
MzLS together include data obtained, respectively, at the
Blanco telescope, Cerro Tololo Inter-American Observatory,
NSFʼs NOIRLab; the Bok telescope, Steward Observatory,
University of Arizona; and the Mayall telescope, Kitt Peak
National Observatory, NOIRLab. The Legacy Surveys project
is honored to be permitted to conduct astronomical research on
Iolkam Du’ag (Kitt Peak), a mountain with particular
significance to the Tohono O’odham Nation.
NOIRLab is operated by the Association of Universities for
Research in Astronomy (AURA) under a cooperative
agreement with the National Science Foundation.
This project used data obtained with the Dark Energy
Camera (DECam), which was constructed by the Dark Energy
Survey (DES) collaboration. Funding for the DES Projects has
been provided by the U.S. Department of Energy, the U.S.
National Science Foundation, the Ministry of Science and
Education of Spain, the Science and Technology Facilities
Council of the United Kingdom, the Higher Education Funding
Council for England, the National Center for Supercomputing
Applications at the University of Illinois at Urbana-Champaign,
the Kavli Institute of Cosmological Physics at the University of
Chicago, Center for Cosmology and Astro-Particle Physics at
the Ohio State University, the Mitchell Institute for Funda-
mental Physics and Astronomy at Texas A&M University,
Financiadora de Estudos e Projetos, Fundacao Carlos Chagas
Filho de Amparo, Financiadora de Estudos e Projetos,
Fundacao Carlos Chagas Filho de Amparo a Pesquisa do
Estado do Rio de Janeiro, Conselho Nacional de Desenvolvi-
mento Cientifico e Tecnologico and the Ministerio da Ciencia,
Tecnologia e Inovacao, the Deutsche Forschungsgemeinschaft,
and the Collaborating Institutions in the Dark Energy Survey.
The Collaborating Institutions are Argonne National Labora-
tory, the University of California at Santa Cruz, the University
of Cambridge, Centro de Investigaciones Energeticas, Med-
ioambientales y Tecnologicas-Madrid, the University of
Chicago, University College London, the DES-Brazil Con-
sortium, the University of Edinburgh, the Eidgenossische
Technische Hochschule (ETH) Zurich, Fermi National
Accelerator Laboratory, the University of Illinois at Urbana-
Champaign, the Institut de Ciencies de l’Espai (IEEC/CSIC),
the Institut de Fisica d’Altes Energies, Lawrence Berkeley
National Laboratory, the Ludwig Maximilians Universitat
Munchen and the associated Excellence Cluster Universe, the
University of Michigan, NSFʼs NOIRLab, the University of
Nottingham, the Ohio State University, the University of
Pennsylvania, the University of Portsmouth, SLAC National
Accelerator Laboratory, Stanford University, the University of
Sussex, and Texas A&M University.
BASS is a key project of the Telescope Access Program
(TAP), which has been funded by the National Astronomical
Observatories of China, the Chinese Academy of Sciences
(the Strategic Priority Research Program “The Emergence of
Cosmological Structures” grant No. XDB09000000), and the
Special Fund for Astronomy from the Ministry of Finance.
The BASS is also supported by the External Cooperation
Program of Chinese Academy of Sciences (grant No.
114A11KYSB20160057), and Chinese National Natural
Science Foundation (grant No. 11433005).
The Legacy Survey team makes use of data products from
the Near-Earth Object Wide-field Infrared Survey Explorer
(NEOWISE), which is a project of the Jet Propulsion
Laboratory/California Institute of Technology. NEOWISE is
funded by the National Aeronautics and Space Administration.
The Legacy Surveys imaging of the DESI footprint is
supported by the Director, Office of Science, Office of High
Energy Physics of the U.S. Department of Energy under
contract No. DE-AC02-05CH1123, by the National Energy
Research Scientific Computing Center, a Department of Energy
Office of Science User Facility under the same contract; and by
the U.S. National Science Foundation, Division of Astronom-
ical Sciences under contract No. AST-0950945 to NOAO.
Software: Astropy (Astropy Collaboration et al. 2013,
2018, 2022), corner.py (Foreman-Mackey 2016), healpy
(Zonca et al. 2019), NumPy (Harris et al. 2020), Matplotlib
(Hunter 2007), Photutils (Bradley 2023), PyDL (Weaver
et al. 2019), scipy (Virtanen et al. 2020), seaborn
(Waskom 2021).
Appendix A
HyperLeda Database Query
In Section 2.1, we present our procedure for building the
SGA-2020 parent sample, which begins with a HyperLeda
database query. For the purposes of reproducibility, this
appendix documents the exact query we execute on the 2018
November 14 version of the HyperLeda database, which results
in a catalog of 1,436,176 galaxies:
WITH
"R50" AS
(
SELECT pgc, avg(lax) AS lax, avg(sax) AS sax
FROM rawdia
WHERE quality=0 and dcode=5 and band between
4400 and 4499 GROUP BY pgc
),
"IR" AS
(
SELECT pgc, avg(lax) AS lax, avg(sax) AS sax
FROM rawdia
WHERE quality=0 and iref in (27129) and
dcode=7 and band=0 GROUP BY pgc
)
SELECT
19
The Astrophysical Journal Supplement Series, 269:3 (25pp), 2023 November Moustakas et al.
m.pgc, m.objname, m.objtype, m.al2000, m.
de2000, m.type,
m.bar, m.ring, m.multiple, m.compactness,
m.t, m.logd25,
m.logr25, m.pa, m.bt, m.it, m.kt, m.v, m.
modbest,
"R50".lax, "R50".sax, "IR".lax, "IR".sax,
FROM
m000 AS m
LEFT JOIN "R50" USING (pgc)
LEFT JOIN "IR" USING (pgc)
WHERE
objtype=’G’ and (m.logd25>0.2 or "R50".
lax>0.2 or "IR".lax>0.2)
Appendix B
Data Products and Data Access
In this appendix, we define the data model for the SGA-2020
data products and describe how all the data can be accessed. All the
input imaging data used to construct the SGA-2020, including the
6 year unWISE image stacks, are publicly accessible through
https://www.legacysurvey.org. The SGA-2020 data themselves
can be retrieved through the SGA-2020 Data Portal at https://sga.
legacysurvey.org. This portal provides a searchable database for
retrieving data and visualizations for individual galaxies, as well as
bulk-download access to the full data set. For example, the
following link will navigate directly to the beautiful face-on spiral
(Hubble type SABc) NGC 2532: https://sga.legacysurvey.org/
group/NGC2532. In addition, the data can be accessed (and
cross-referenced against a growing number of additional data sets,
including DESI) through NSF’s NOIRLab Astro Data Lab at
https://datalab.noirlab.edu/sga.php. Finally, one can interactively
explore the sample in the Legacy Surveys imaging footprint via the
SGA layer of the Legacy Surveys Viewer; for example, the
following link will navigate to the position of NGC 2532 in the
North Galactic Cap: https://legacysurvey.org/viewer?ra=122.
5638&dec=33.9568&layer=ls-dr9&zoom=13&sga.
Most users will be interested in the SGA-2020.fits file, a
multiextension FITS catalog, which contains detailed informa-
tion for all 383,620 galaxies in the SGA-2020. Table 1
summarizes the contents of this file, and Table 2 contains a
detailed description of the ELLIPSE header and/or data unit
(HDU). In addition, Table 3 defines the ELLIPSEBIT bit-
masks, which record issues associated with the ellipse fitting
and surface-brightness profile modeling, if any.
Furthermore, for each galaxy group in the atlas (i.e., each
row in the SGA-2020.fits catalog where GROUP_
PRIMARY is True), we generate the set of files summarized
in Table 4 (see also Section 3.2), which include the individual
multiwavelength mosaics, Tractor catalogs, surface-bright-
ness profiles, and other key data products. These files are
organized into the directory structure RASLICE/GROUP_
NAME, where GROUP_NAME is the name of the galaxy group
(see Section 2.2), and RASLICE, which ranges between 000
and 359, is the 1° wide slice of the sky that the object belongs
to. Specifically, in Python,
RASLICE=":03d".format(GROUP_RA)
Finally, Table 5 documents the data model of the ellipse-fitting
and surface-brightness-profile results for each individual galaxy
in the SGA-2020.
Table 1
SGA-2020.fits File Contents
Extension Data Model
Number Name Documentation Description
HDU01 ELLIPSE Table 2 Sample metadata and ellipse-
fitting results.
HDU02 TRACTOR LS/DR9 websitea
The Tractor fitting results.b
Notes. Catalog containing the principal measurements for all 383,620 galaxies
in the SGA-2020 as a multiextension FITS file with two row-matched header
and/or data units (HDUs).
a
https://www.legacysurvey.org/dr9/catalogs
b
This table also includes SGA_ID (see Table 2) to facilitate crossmatching.
20
The Astrophysical Journal Supplement Series, 269:3 (25pp), 2023 November Moustakas et al.
Table 2
ELLIPSE HDU Data Model
Column Name Units Description
SGA_ID L Unique integer identifier.
SGA_GALAXY L SGA galaxy name, constructed as “SGA-2020-SGA_ID.”
GALAXY L Unique galaxy name.
PGCa
L Unique identifier from the Principal Catalogue of Galaxies.
RA_LEDA degree R.A. (J2000) from the reference indicated in REF.
DEC_LEDA degree Decl. (J2000) from the reference indicated in REF.
MORPHTYPE L Visual morphological type from HyperLeda (if available).
PA_LEDA degree Galaxy position angle (measured east of north); taken from the reference indicated in REF.
D25_LEDA arcminute Major-axis diameter at the 25 mag arcsec−2
(optical) surface-brightness isophote; taken from the
reference indicated in REF.
BA_LEDA L Ratio of the semiminor axis to the semimajor axis; taken from the reference indicated in REF.
Z_LEDAa
L Heliocentric redshift from HyperLeda.
SB_D25_LEDA Vega mag arcsec−2
Mean surface brightness based on D25_LEDA and MAG_LEDA.
MAG_LEDAb
Vega mag Apparent bt-band magnitude.
BYHAND L Boolean flag indicating whether one or more of RA_LEDA, DEC_LEDA, D25_LEDA, PA_LEDA,
BA_LEDA, or MAG_LEDA were changed from their published values (usually via visual
inspection) while building the parent sample.
REF L Reference indicating the origin of the object (see Section 2): LEDA-20181114, LGDWARFS, RC3,
OpenNGC, or DR8.
GROUP_ID L Unique group identification number.
GROUP_NAME L Group name, constructed from the name of its largest member (see Section 2.2). For isolated galaxies,
identical to GALAXY.
GROUP_MULT L Number of group members (i.e., group multiplicity).
GROUP_PRIMARY L Boolean flag indicating the primary (i.e., largest) group member.
GROUP_RA degree Mean R.A. of the group weighted by D25_LEDA.
GROUP_DEC degree Mean decl. of the group weighted by D25_LEDA.
GROUP_DIAMETER arcminute Approximate group diameter (see Section 2.2).
BRICKNAME L Name of custom Tractor “brick,” encoding the sky position, e.g., “1126p222” is centered on R.
A. = 112.6, decl. = +22.2.
RA degree R.A. (J2000) based on The Tractor model fit.
DEC degree Decl. (J2000) based on The Tractor model fit.
D26 arcminute Major axis diameter at the μ = 26 mag arcsec−2
r-band isophote.
D26_REFc
L Reference indicating the origin of the DIAM measurement: SB26, SB25, or LEDA.
PA degree Galaxy position angle (measured east of north), as measured from the ellipse moments (see
Section 3.2.3) (or equivalent to PA_LEDA if the ellipse moments could not be measured).
BA L Minor-to-major axis ratio, as measured from the ellipse moments (or equivalent to BA_LEDA if the
ellipse moments could not be measured).
RA_MOMENT degree Light-weighted R.A. (J2000), as measured from the ellipse moments. Equivalent to RA_X0 in
Table 5 but set to RA_LEDA if ellipse fitting failed or was not carried out.
DEC_MOMENT degree Like RA_MOMENT but for the decl. axis.
SMA_MOMENTd
arcsecond Second moment of the light distribution along the major axis based on the measured ellipse
moments. Equivalent to MAJORAXIS in Table 5 but converted to arcseconds.
〈grz〉_SMA50d
arcsecond Half-light semimajor axis length based on Equation (2).
SMA_SB〈sblevel〉d
arcsecond Semimajor axis length at the r-band 〈sblevel〉 mag arcsec−2
isophote.
〈grz〉_MAG_SB〈sblevel〉d
AB mag Cumulative brightness measured within SMA_SB〈sblevel〉.
〈grz〉_MAG_SB〈sblevel〉_ERRd
AB mag 1σ uncertainty in 〈grz〉_MAG_SB〈sblevel〉.
〈grz〉_COG_PARAMS_MTOTd
AB mag Best-fitting curve-of-growth parameter m1 from Equation (1).
〈grz〉_COG_PARAMS_M0d
AB mag Best-fitting curve-of-growth parameter m0 from Equation (1).
〈grz〉_COG_PARAMS_ALPHA1d
L Best-fitting curve-of-growth parameter α1 from Equation (1).
〈grz〉_COG_PARAMS_ALPHA2d
L Best-fitting curve-of-growth parameter α2 from Equation (1).
〈grz〉_COG_PARAMS_CHI2d
L χ2
of the fit to the curve of growth (see Section 3.2.3).
ELLIPSEBIT L See Table 3.
Notes. ELLIPSE HDU of the SGA-2020.fits merged catalog defined in Table 1. In this table, 〈grz〉 denotes the g-, r-, or z-band filter; 〈wise〉 denotes the W1-,
W2-, W3-, or W4 bandpass; and 〈sblevel〉 represents the 22, 22.5, 23, 23.5, 24, 24.5, 25, 25.5, and 26 mag arcsec−2
isophote.
a
Missing values are represented with a −1. For some quantities (e.g., PGC or Z_LEDA), a missing value does not necessarily mean that that value does not exist.
b
This magnitude estimate is heterogeneous in both bandpass and aperture but, for most galaxies, it is measured in the B band; use with care.
c
By default, we infer D26 from SMA_SB26. However, if the r-band surface-brightness profile could not be measured at this level, we estimate D26 as
2.5 × SMA_SB25 or 1.5 × D25_LEDA, in that order of priority.
d
If ellipse-fitting or curve-of-growth modeling failed or was not attempted, then these columns’ values are −1.
21
The Astrophysical Journal Supplement Series, 269:3 (25pp), 2023 November Moustakas et al.
Table 3
Ellipse-fitting Bitmasks
Bit Number Bit Name Definition
0 L Not used; ignore.
1 REX_TOOSMALL Ellipse fit skipped; galaxy classified as too-small type REX.
2 NOTREX_TOOSMALL Ellipse fit skipped; galaxy classified as too-small type EXP, DEV, or SER.
3 FAILED Ellipse fitting was attempted but failed.
4 NOTFIT Ellipse fitting was not attempted.
5 REJECTED Ellipse-fitting results were rejected based on visual inspection.
Note. Bitmask encoding various reasons why ellipse fitting failed or was not attempted; see Section 3.2.3 for additional details.
Table 4
Images and Catalogs
Filename Description
GROUP_NAME-ccds-〈region〉.fits CCDs contributing to the optical image stacks.
GROUP_NAME-largegalaxy-blobs.fits.gz Enumerated segmentation (“blob”) image.
GROUP_NAME-largegalaxy-tractor.fits Tractor catalog of all detected sources in the field.
GROUP_NAME-largegalaxy-maskbits.fits.fz Image encoding the LS/DR9 bitmasksa
contributing to each pixel.
GROUP_NAME-largegalaxy-outlier-mask.fits.fz Image of pixels rejected during outlier masking.
GROUP_NAME-depth-〈grz〉.fits.fz Image of the 5σ point-source depth at each pixel.
GROUP_NAME-largegalaxy-psf-〈grz〉.fits.fz Postage stamp of the inverse-variance weighted mean pixelized PSF at the center of the field.
GROUP_NAME-largegalaxy-image-〈grz〉.fits.fz Inverse-variance weighted optical image.
GROUP_NAME-largegalaxy-invvar-〈grz〉.fits.fz Optical inverse variance image stack.
GROUP_NAME-largegalaxy-model-〈grz〉.fits.fz Optical Tractor model image coadd.
GROUP_NAME-largegalaxy-image-grz.jpg Color (grz) JPG image of the image stack.
GROUP_NAME-largegalaxy-model-grz.jpg Color (grz) JPG image of The Tractor model image.
GROUP_NAME-largegalaxy-resid-grz.jpg Color (grz) JPG image of residual (data minus model) image.
GROUP_NAME-image-〈wise〉.fits.fz Inverse-variance weighted infrared image stack.
GROUP_NAME-invvar-〈wise〉.fits.fz Infrared inverse variance image stack.
GROUP_NAME-largegalaxy-model-〈wise〉.fits.fz Infrared Tractor model image coadd.
GROUP_NAME-image-W1W2.jpg Color (W1W2) JPG image of the image stack.
GROUP_NAME-model-W1W2.jpg Color (W1W2) JPG image of The Tractor model image.
GROUP_NAME-largegalaxy-sample.fits Catalog of one or more galaxies from the parent sample in this group.
GROUP_NAME-largegalaxy-SGA_ID-ellipse.fitsb
Detailed ellipse-fitting results for each galaxy in this group; see Table 5 for the data model.
GROUP_NAME-coadds.log Log output for the coadds stage of the SGA pipeline.
GROUP_NAME-ellipse.log Log output for the ellipse stage of the SGA pipeline.
Notes. Summary of files generated for each galaxy group in the SGA-2020. In this table, 〈region〉 denotes either north for BASS/MzLS or south for DECaLS;
〈grz〉 denotes the g-, r-, or z-band filter; and 〈wise〉 denotes the W1-, W2-, W3-, or W4 bandpass.
a
https://www.legacysurvey.org/dr9/bitmasks
b
This file may be missing (for the galaxy of a given SGA_ID) if ellipse fitting fails or is not carried out.
Table 5
Ellipse-fitting Data Model
Column Name Units Description
SGA_ID L See Table 2.
GALAXY L See Table 2.
RA degree See Table 2.
DEC degree See Table 2.
PGC L See Table 2.
PA_LEDA degree See Table 2.
BA_LEDA L See Table 2.
D25_LEDA arcminute See Table 2.
BANDS L List of bandpasses fitted (here, always grz).
REFBAND L Reference band (here, always r).
REFPIXSCALE arcsec pixel−1
Pixel scale in REFBAND.
SUCCESS L Flag indicating ellipse-fitting success or failure.
FITGEOMETRY L Flag indicating whether the ellipse geometry was allowed to vary with semimajor axis (here, always
False).
INPUT_ELLIPSE L Flag indicating whether ellipse parameters were passed from an external file (here, always False).
LARGESHIFT L Flag indicating that the light-weighted center (from ellipse moments) is different from The
Tractor position by more than 10 pixels in either dimension, in which case we adopt The
Tractor model position.
22
The Astrophysical Journal Supplement Series, 269:3 (25pp), 2023 November Moustakas et al.
Siena Galaxy Atlas 2020

More Related Content

Similar to Siena Galaxy Atlas 2020

Kinematics and simulations_of_the_stellar_stream_in_the_halo_of_the_umbrella_...
Kinematics and simulations_of_the_stellar_stream_in_the_halo_of_the_umbrella_...Kinematics and simulations_of_the_stellar_stream_in_the_halo_of_the_umbrella_...
Kinematics and simulations_of_the_stellar_stream_in_the_halo_of_the_umbrella_...
Sérgio Sacani
 
Stellar tidal streams_in_spiral_galaxies_of_the_local_volume
Stellar tidal streams_in_spiral_galaxies_of_the_local_volumeStellar tidal streams_in_spiral_galaxies_of_the_local_volume
Stellar tidal streams_in_spiral_galaxies_of_the_local_volume
Sérgio Sacani
 
The SPHERE view of three interacting twin disc systems in polarised light
The SPHERE view of three interacting twin disc systems in polarised lightThe SPHERE view of three interacting twin disc systems in polarised light
The SPHERE view of three interacting twin disc systems in polarised light
Sérgio Sacani
 
The massive relic galaxy NGC 1277 is dark matter deficient From dynamical mod...
The massive relic galaxy NGC 1277 is dark matter deficient From dynamical mod...The massive relic galaxy NGC 1277 is dark matter deficient From dynamical mod...
The massive relic galaxy NGC 1277 is dark matter deficient From dynamical mod...
Sérgio Sacani
 
Off nuclear star_formation_and_obscured_activity_in_the_luminous_infrared_gal...
Off nuclear star_formation_and_obscured_activity_in_the_luminous_infrared_gal...Off nuclear star_formation_and_obscured_activity_in_the_luminous_infrared_gal...
Off nuclear star_formation_and_obscured_activity_in_the_luminous_infrared_gal...
Sérgio Sacani
 
XUE: Molecular Inventory in the Inner Region of an Extremely Irradiated Proto...
XUE: Molecular Inventory in the Inner Region of an Extremely Irradiated Proto...XUE: Molecular Inventory in the Inner Region of an Extremely Irradiated Proto...
XUE: Molecular Inventory in the Inner Region of an Extremely Irradiated Proto...
Sérgio Sacani
 
The JWST Discovery of the Triply-imaged Type Ia “Supernova H0pe” and Observat...
The JWST Discovery of the Triply-imaged Type Ia “Supernova H0pe” and Observat...The JWST Discovery of the Triply-imaged Type Ia “Supernova H0pe” and Observat...
The JWST Discovery of the Triply-imaged Type Ia “Supernova H0pe” and Observat...
Sérgio Sacani
 
ULTRAVIOLET SIGNPOSTS OF RESONANT DYNAMICS IN THE STARBURST-RINGED Sab GALAXY...
ULTRAVIOLET SIGNPOSTS OF RESONANT DYNAMICS IN THE STARBURST-RINGED Sab GALAXY...ULTRAVIOLET SIGNPOSTS OF RESONANT DYNAMICS IN THE STARBURST-RINGED Sab GALAXY...
ULTRAVIOLET SIGNPOSTS OF RESONANT DYNAMICS IN THE STARBURST-RINGED Sab GALAXY...
Sérgio Sacani
 
EXTINCTION AND THE DIMMING OF KIC 8462852
EXTINCTION AND THE DIMMING OF KIC 8462852EXTINCTION AND THE DIMMING OF KIC 8462852
EXTINCTION AND THE DIMMING OF KIC 8462852
Sérgio Sacani
 
Company for the Ultra-high Density, Ultra-short Period Sub-Earth GJ 367 b: Di...
Company for the Ultra-high Density, Ultra-short Period Sub-Earth GJ 367 b: Di...Company for the Ultra-high Density, Ultra-short Period Sub-Earth GJ 367 b: Di...
Company for the Ultra-high Density, Ultra-short Period Sub-Earth GJ 367 b: Di...
Sérgio Sacani
 
Mapping the complex_kinematics_of_l_lobjects_in_the_orion_nebula
Mapping the complex_kinematics_of_l_lobjects_in_the_orion_nebulaMapping the complex_kinematics_of_l_lobjects_in_the_orion_nebula
Mapping the complex_kinematics_of_l_lobjects_in_the_orion_nebula
Sérgio Sacani
 

Similar to Siena Galaxy Atlas 2020 (20)

From globular clusters_to_tidal_dwarfs_structure_formation_in_the_tidal_tails...
From globular clusters_to_tidal_dwarfs_structure_formation_in_the_tidal_tails...From globular clusters_to_tidal_dwarfs_structure_formation_in_the_tidal_tails...
From globular clusters_to_tidal_dwarfs_structure_formation_in_the_tidal_tails...
 
Kinematics and simulations_of_the_stellar_stream_in_the_halo_of_the_umbrella_...
Kinematics and simulations_of_the_stellar_stream_in_the_halo_of_the_umbrella_...Kinematics and simulations_of_the_stellar_stream_in_the_halo_of_the_umbrella_...
Kinematics and simulations_of_the_stellar_stream_in_the_halo_of_the_umbrella_...
 
The vvv survey_reveals_classical_cepheids_tracing_a_young_and_thin_stellar_di...
The vvv survey_reveals_classical_cepheids_tracing_a_young_and_thin_stellar_di...The vvv survey_reveals_classical_cepheids_tracing_a_young_and_thin_stellar_di...
The vvv survey_reveals_classical_cepheids_tracing_a_young_and_thin_stellar_di...
 
Kathryn wheel a_spectacular_galaxy_collision_discoverd_in_the_galactic_neighb...
Kathryn wheel a_spectacular_galaxy_collision_discoverd_in_the_galactic_neighb...Kathryn wheel a_spectacular_galaxy_collision_discoverd_in_the_galactic_neighb...
Kathryn wheel a_spectacular_galaxy_collision_discoverd_in_the_galactic_neighb...
 
Rings and radial_waves_in_the_disk_of_the_milk_way
Rings and radial_waves_in_the_disk_of_the_milk_wayRings and radial_waves_in_the_disk_of_the_milk_way
Rings and radial_waves_in_the_disk_of_the_milk_way
 
Stellar tidal streams_in_spiral_galaxies_of_the_local_volume
Stellar tidal streams_in_spiral_galaxies_of_the_local_volumeStellar tidal streams_in_spiral_galaxies_of_the_local_volume
Stellar tidal streams_in_spiral_galaxies_of_the_local_volume
 
Observational evidence for_a_dark_side_to_ngc5128_globular_cluster_system
Observational evidence for_a_dark_side_to_ngc5128_globular_cluster_systemObservational evidence for_a_dark_side_to_ngc5128_globular_cluster_system
Observational evidence for_a_dark_side_to_ngc5128_globular_cluster_system
 
The SPHERE view of three interacting twin disc systems in polarised light
The SPHERE view of three interacting twin disc systems in polarised lightThe SPHERE view of three interacting twin disc systems in polarised light
The SPHERE view of three interacting twin disc systems in polarised light
 
The massive relic galaxy NGC 1277 is dark matter deficient From dynamical mod...
The massive relic galaxy NGC 1277 is dark matter deficient From dynamical mod...The massive relic galaxy NGC 1277 is dark matter deficient From dynamical mod...
The massive relic galaxy NGC 1277 is dark matter deficient From dynamical mod...
 
Off nuclear star_formation_and_obscured_activity_in_the_luminous_infrared_gal...
Off nuclear star_formation_and_obscured_activity_in_the_luminous_infrared_gal...Off nuclear star_formation_and_obscured_activity_in_the_luminous_infrared_gal...
Off nuclear star_formation_and_obscured_activity_in_the_luminous_infrared_gal...
 
XUE: Molecular Inventory in the Inner Region of an Extremely Irradiated Proto...
XUE: Molecular Inventory in the Inner Region of an Extremely Irradiated Proto...XUE: Molecular Inventory in the Inner Region of an Extremely Irradiated Proto...
XUE: Molecular Inventory in the Inner Region of an Extremely Irradiated Proto...
 
The JWST Discovery of the Triply-imaged Type Ia “Supernova H0pe” and Observat...
The JWST Discovery of the Triply-imaged Type Ia “Supernova H0pe” and Observat...The JWST Discovery of the Triply-imaged Type Ia “Supernova H0pe” and Observat...
The JWST Discovery of the Triply-imaged Type Ia “Supernova H0pe” and Observat...
 
The parkes hi zone of avoidance survey
The parkes hi zone of avoidance surveyThe parkes hi zone of avoidance survey
The parkes hi zone of avoidance survey
 
ULTRAVIOLET SIGNPOSTS OF RESONANT DYNAMICS IN THE STARBURST-RINGED Sab GALAXY...
ULTRAVIOLET SIGNPOSTS OF RESONANT DYNAMICS IN THE STARBURST-RINGED Sab GALAXY...ULTRAVIOLET SIGNPOSTS OF RESONANT DYNAMICS IN THE STARBURST-RINGED Sab GALAXY...
ULTRAVIOLET SIGNPOSTS OF RESONANT DYNAMICS IN THE STARBURST-RINGED Sab GALAXY...
 
Isolated compact elliptical_galaxies_stellar_systems_that_ran_away
Isolated compact elliptical_galaxies_stellar_systems_that_ran_awayIsolated compact elliptical_galaxies_stellar_systems_that_ran_away
Isolated compact elliptical_galaxies_stellar_systems_that_ran_away
 
EXTINCTION AND THE DIMMING OF KIC 8462852
EXTINCTION AND THE DIMMING OF KIC 8462852EXTINCTION AND THE DIMMING OF KIC 8462852
EXTINCTION AND THE DIMMING OF KIC 8462852
 
Gj 832c a_super_earth_in_the_habitable_zone
Gj 832c a_super_earth_in_the_habitable_zoneGj 832c a_super_earth_in_the_habitable_zone
Gj 832c a_super_earth_in_the_habitable_zone
 
Spirals and clumps in V960 Mon: signs of planet formation via gravitational i...
Spirals and clumps in V960 Mon: signs of planet formation via gravitational i...Spirals and clumps in V960 Mon: signs of planet formation via gravitational i...
Spirals and clumps in V960 Mon: signs of planet formation via gravitational i...
 
Company for the Ultra-high Density, Ultra-short Period Sub-Earth GJ 367 b: Di...
Company for the Ultra-high Density, Ultra-short Period Sub-Earth GJ 367 b: Di...Company for the Ultra-high Density, Ultra-short Period Sub-Earth GJ 367 b: Di...
Company for the Ultra-high Density, Ultra-short Period Sub-Earth GJ 367 b: Di...
 
Mapping the complex_kinematics_of_l_lobjects_in_the_orion_nebula
Mapping the complex_kinematics_of_l_lobjects_in_the_orion_nebulaMapping the complex_kinematics_of_l_lobjects_in_the_orion_nebula
Mapping the complex_kinematics_of_l_lobjects_in_the_orion_nebula
 

More from Sérgio Sacani

Biogenic Sulfur Gases as Biosignatures on Temperate Sub-Neptune Waterworlds
Biogenic Sulfur Gases as Biosignatures on Temperate Sub-Neptune WaterworldsBiogenic Sulfur Gases as Biosignatures on Temperate Sub-Neptune Waterworlds
Biogenic Sulfur Gases as Biosignatures on Temperate Sub-Neptune Waterworlds
Sérgio Sacani
 
Asymmetry in the atmosphere of the ultra-hot Jupiter WASP-76 b
Asymmetry in the atmosphere of the ultra-hot Jupiter WASP-76 bAsymmetry in the atmosphere of the ultra-hot Jupiter WASP-76 b
Asymmetry in the atmosphere of the ultra-hot Jupiter WASP-76 b
Sérgio Sacani
 
Formation of low mass protostars and their circumstellar disks
Formation of low mass protostars and their circumstellar disksFormation of low mass protostars and their circumstellar disks
Formation of low mass protostars and their circumstellar disks
Sérgio Sacani
 
Discovery of an Accretion Streamer and a Slow Wide-angle Outflow around FUOri...
Discovery of an Accretion Streamer and a Slow Wide-angle Outflow around FUOri...Discovery of an Accretion Streamer and a Slow Wide-angle Outflow around FUOri...
Discovery of an Accretion Streamer and a Slow Wide-angle Outflow around FUOri...
Sérgio Sacani
 
Disentangling the origin of chemical differences using GHOST
Disentangling the origin of chemical differences using GHOSTDisentangling the origin of chemical differences using GHOST
Disentangling the origin of chemical differences using GHOST
Sérgio Sacani
 
Hubble Asteroid Hunter III. Physical properties of newly found asteroids
Hubble Asteroid Hunter III. Physical properties of newly found asteroidsHubble Asteroid Hunter III. Physical properties of newly found asteroids
Hubble Asteroid Hunter III. Physical properties of newly found asteroids
Sérgio Sacani
 
Observation of Gravitational Waves from the Coalescence of a 2.5–4.5 M⊙ Compa...
Observation of Gravitational Waves from the Coalescence of a 2.5–4.5 M⊙ Compa...Observation of Gravitational Waves from the Coalescence of a 2.5–4.5 M⊙ Compa...
Observation of Gravitational Waves from the Coalescence of a 2.5–4.5 M⊙ Compa...
Sérgio Sacani
 
The SAMI Galaxy Sur v ey: galaxy spin is more strongly correlated with stella...
The SAMI Galaxy Sur v ey: galaxy spin is more strongly correlated with stella...The SAMI Galaxy Sur v ey: galaxy spin is more strongly correlated with stella...
The SAMI Galaxy Sur v ey: galaxy spin is more strongly correlated with stella...
Sérgio Sacani
 
Is Betelgeuse Really Rotating? Synthetic ALMA Observations of Large-scale Con...
Is Betelgeuse Really Rotating? Synthetic ALMA Observations of Large-scale Con...Is Betelgeuse Really Rotating? Synthetic ALMA Observations of Large-scale Con...
Is Betelgeuse Really Rotating? Synthetic ALMA Observations of Large-scale Con...
Sérgio Sacani
 
First Direct Imaging of a Kelvin–Helmholtz Instability by PSP/WISPR
First Direct Imaging of a Kelvin–Helmholtz Instability by PSP/WISPRFirst Direct Imaging of a Kelvin–Helmholtz Instability by PSP/WISPR
First Direct Imaging of a Kelvin–Helmholtz Instability by PSP/WISPR
Sérgio Sacani
 
Hydrogen Column Density Variability in a Sample of Local Compton-Thin AGN
Hydrogen Column Density Variability in a Sample of Local Compton-Thin AGNHydrogen Column Density Variability in a Sample of Local Compton-Thin AGN
Hydrogen Column Density Variability in a Sample of Local Compton-Thin AGN
Sérgio Sacani
 

More from Sérgio Sacani (20)

X-rays from a Central “Exhaust Vent” of the Galactic Center Chimney
X-rays from a Central “Exhaust Vent” of the Galactic Center ChimneyX-rays from a Central “Exhaust Vent” of the Galactic Center Chimney
X-rays from a Central “Exhaust Vent” of the Galactic Center Chimney
 
Efficient spin-up of Earth System Models usingsequence acceleration
Efficient spin-up of Earth System Models usingsequence accelerationEfficient spin-up of Earth System Models usingsequence acceleration
Efficient spin-up of Earth System Models usingsequence acceleration
 
TransientOffsetin14CAftertheCarringtonEventRecordedbyPolarTreeRings
TransientOffsetin14CAftertheCarringtonEventRecordedbyPolarTreeRingsTransientOffsetin14CAftertheCarringtonEventRecordedbyPolarTreeRings
TransientOffsetin14CAftertheCarringtonEventRecordedbyPolarTreeRings
 
Biogenic Sulfur Gases as Biosignatures on Temperate Sub-Neptune Waterworlds
Biogenic Sulfur Gases as Biosignatures on Temperate Sub-Neptune WaterworldsBiogenic Sulfur Gases as Biosignatures on Temperate Sub-Neptune Waterworlds
Biogenic Sulfur Gases as Biosignatures on Temperate Sub-Neptune Waterworlds
 
Asymmetry in the atmosphere of the ultra-hot Jupiter WASP-76 b
Asymmetry in the atmosphere of the ultra-hot Jupiter WASP-76 bAsymmetry in the atmosphere of the ultra-hot Jupiter WASP-76 b
Asymmetry in the atmosphere of the ultra-hot Jupiter WASP-76 b
 
Formation of low mass protostars and their circumstellar disks
Formation of low mass protostars and their circumstellar disksFormation of low mass protostars and their circumstellar disks
Formation of low mass protostars and their circumstellar disks
 
Nightside clouds and disequilibrium chemistry on the hot Jupiter WASP-43b
Nightside clouds and disequilibrium chemistry on the hot Jupiter WASP-43bNightside clouds and disequilibrium chemistry on the hot Jupiter WASP-43b
Nightside clouds and disequilibrium chemistry on the hot Jupiter WASP-43b
 
Discovery of an Accretion Streamer and a Slow Wide-angle Outflow around FUOri...
Discovery of an Accretion Streamer and a Slow Wide-angle Outflow around FUOri...Discovery of an Accretion Streamer and a Slow Wide-angle Outflow around FUOri...
Discovery of an Accretion Streamer and a Slow Wide-angle Outflow around FUOri...
 
Disentangling the origin of chemical differences using GHOST
Disentangling the origin of chemical differences using GHOSTDisentangling the origin of chemical differences using GHOST
Disentangling the origin of chemical differences using GHOST
 
All-domain Anomaly Resolution Office U.S. Department of Defense (U) Case: “Eg...
All-domain Anomaly Resolution Office U.S. Department of Defense (U) Case: “Eg...All-domain Anomaly Resolution Office U.S. Department of Defense (U) Case: “Eg...
All-domain Anomaly Resolution Office U.S. Department of Defense (U) Case: “Eg...
 
PossibleEoarcheanRecordsoftheGeomagneticFieldPreservedintheIsuaSupracrustalBe...
PossibleEoarcheanRecordsoftheGeomagneticFieldPreservedintheIsuaSupracrustalBe...PossibleEoarcheanRecordsoftheGeomagneticFieldPreservedintheIsuaSupracrustalBe...
PossibleEoarcheanRecordsoftheGeomagneticFieldPreservedintheIsuaSupracrustalBe...
 
Isotopic evidence of long-lived volcanism on Io
Isotopic evidence of long-lived volcanism on IoIsotopic evidence of long-lived volcanism on Io
Isotopic evidence of long-lived volcanism on Io
 
Hubble Asteroid Hunter III. Physical properties of newly found asteroids
Hubble Asteroid Hunter III. Physical properties of newly found asteroidsHubble Asteroid Hunter III. Physical properties of newly found asteroids
Hubble Asteroid Hunter III. Physical properties of newly found asteroids
 
Observational constraints on mergers creating magnetism in massive stars
Observational constraints on mergers creating magnetism in massive starsObservational constraints on mergers creating magnetism in massive stars
Observational constraints on mergers creating magnetism in massive stars
 
Observation of Gravitational Waves from the Coalescence of a 2.5–4.5 M⊙ Compa...
Observation of Gravitational Waves from the Coalescence of a 2.5–4.5 M⊙ Compa...Observation of Gravitational Waves from the Coalescence of a 2.5–4.5 M⊙ Compa...
Observation of Gravitational Waves from the Coalescence of a 2.5–4.5 M⊙ Compa...
 
The SAMI Galaxy Sur v ey: galaxy spin is more strongly correlated with stella...
The SAMI Galaxy Sur v ey: galaxy spin is more strongly correlated with stella...The SAMI Galaxy Sur v ey: galaxy spin is more strongly correlated with stella...
The SAMI Galaxy Sur v ey: galaxy spin is more strongly correlated with stella...
 
Is Betelgeuse Really Rotating? Synthetic ALMA Observations of Large-scale Con...
Is Betelgeuse Really Rotating? Synthetic ALMA Observations of Large-scale Con...Is Betelgeuse Really Rotating? Synthetic ALMA Observations of Large-scale Con...
Is Betelgeuse Really Rotating? Synthetic ALMA Observations of Large-scale Con...
 
First Direct Imaging of a Kelvin–Helmholtz Instability by PSP/WISPR
First Direct Imaging of a Kelvin–Helmholtz Instability by PSP/WISPRFirst Direct Imaging of a Kelvin–Helmholtz Instability by PSP/WISPR
First Direct Imaging of a Kelvin–Helmholtz Instability by PSP/WISPR
 
The Sun’s differential rotation is controlled by high- latitude baroclinicall...
The Sun’s differential rotation is controlled by high- latitude baroclinicall...The Sun’s differential rotation is controlled by high- latitude baroclinicall...
The Sun’s differential rotation is controlled by high- latitude baroclinicall...
 
Hydrogen Column Density Variability in a Sample of Local Compton-Thin AGN
Hydrogen Column Density Variability in a Sample of Local Compton-Thin AGNHydrogen Column Density Variability in a Sample of Local Compton-Thin AGN
Hydrogen Column Density Variability in a Sample of Local Compton-Thin AGN
 

Recently uploaded

ONLINE VOTING SYSTEM SE Project for vote
ONLINE VOTING SYSTEM SE Project for voteONLINE VOTING SYSTEM SE Project for vote
ONLINE VOTING SYSTEM SE Project for vote
RaunakRastogi4
 
development of diagnostic enzyme assay to detect leuser virus
development of diagnostic enzyme assay to detect leuser virusdevelopment of diagnostic enzyme assay to detect leuser virus
development of diagnostic enzyme assay to detect leuser virus
NazaninKarimi6
 
(May 9, 2024) Enhanced Ultrafast Vector Flow Imaging (VFI) Using Multi-Angle ...
(May 9, 2024) Enhanced Ultrafast Vector Flow Imaging (VFI) Using Multi-Angle ...(May 9, 2024) Enhanced Ultrafast Vector Flow Imaging (VFI) Using Multi-Angle ...
(May 9, 2024) Enhanced Ultrafast Vector Flow Imaging (VFI) Using Multi-Angle ...
Scintica Instrumentation
 
Pteris : features, anatomy, morphology and lifecycle
Pteris : features, anatomy, morphology and lifecyclePteris : features, anatomy, morphology and lifecycle
Pteris : features, anatomy, morphology and lifecycle
Cherry
 
The Mariana Trench remarkable geological features on Earth.pptx
The Mariana Trench remarkable geological features on Earth.pptxThe Mariana Trench remarkable geological features on Earth.pptx
The Mariana Trench remarkable geological features on Earth.pptx
seri bangash
 
LUNULARIA -features, morphology, anatomy ,reproduction etc.
LUNULARIA -features, morphology, anatomy ,reproduction etc.LUNULARIA -features, morphology, anatomy ,reproduction etc.
LUNULARIA -features, morphology, anatomy ,reproduction etc.
Cherry
 
Porella : features, morphology, anatomy, reproduction etc.
Porella : features, morphology, anatomy, reproduction etc.Porella : features, morphology, anatomy, reproduction etc.
Porella : features, morphology, anatomy, reproduction etc.
Cherry
 

Recently uploaded (20)

ONLINE VOTING SYSTEM SE Project for vote
ONLINE VOTING SYSTEM SE Project for voteONLINE VOTING SYSTEM SE Project for vote
ONLINE VOTING SYSTEM SE Project for vote
 
Terpineol and it's characterization pptx
Terpineol and it's characterization pptxTerpineol and it's characterization pptx
Terpineol and it's characterization pptx
 
development of diagnostic enzyme assay to detect leuser virus
development of diagnostic enzyme assay to detect leuser virusdevelopment of diagnostic enzyme assay to detect leuser virus
development of diagnostic enzyme assay to detect leuser virus
 
BHUBANESHWAR ODIA CALL GIRL SEIRVEC ❣️ 72051//37929❣️ CALL GIRL IN ODIA HAND ...
BHUBANESHWAR ODIA CALL GIRL SEIRVEC ❣️ 72051//37929❣️ CALL GIRL IN ODIA HAND ...BHUBANESHWAR ODIA CALL GIRL SEIRVEC ❣️ 72051//37929❣️ CALL GIRL IN ODIA HAND ...
BHUBANESHWAR ODIA CALL GIRL SEIRVEC ❣️ 72051//37929❣️ CALL GIRL IN ODIA HAND ...
 
(May 9, 2024) Enhanced Ultrafast Vector Flow Imaging (VFI) Using Multi-Angle ...
(May 9, 2024) Enhanced Ultrafast Vector Flow Imaging (VFI) Using Multi-Angle ...(May 9, 2024) Enhanced Ultrafast Vector Flow Imaging (VFI) Using Multi-Angle ...
(May 9, 2024) Enhanced Ultrafast Vector Flow Imaging (VFI) Using Multi-Angle ...
 
GBSN - Microbiology (Unit 3)Defense Mechanism of the body
GBSN - Microbiology (Unit 3)Defense Mechanism of the body GBSN - Microbiology (Unit 3)Defense Mechanism of the body
GBSN - Microbiology (Unit 3)Defense Mechanism of the body
 
FS P2 COMBO MSTA LAST PUSH past exam papers.
FS P2 COMBO MSTA LAST PUSH past exam papers.FS P2 COMBO MSTA LAST PUSH past exam papers.
FS P2 COMBO MSTA LAST PUSH past exam papers.
 
module for grade 9 for distance learning
module for grade 9 for distance learningmodule for grade 9 for distance learning
module for grade 9 for distance learning
 
Genome Projects : Human, Rice,Wheat,E coli and Arabidopsis.
Genome Projects : Human, Rice,Wheat,E coli and Arabidopsis.Genome Projects : Human, Rice,Wheat,E coli and Arabidopsis.
Genome Projects : Human, Rice,Wheat,E coli and Arabidopsis.
 
Pteris : features, anatomy, morphology and lifecycle
Pteris : features, anatomy, morphology and lifecyclePteris : features, anatomy, morphology and lifecycle
Pteris : features, anatomy, morphology and lifecycle
 
Cot curve, melting temperature, unique and repetitive DNA
Cot curve, melting temperature, unique and repetitive DNACot curve, melting temperature, unique and repetitive DNA
Cot curve, melting temperature, unique and repetitive DNA
 
The Mariana Trench remarkable geological features on Earth.pptx
The Mariana Trench remarkable geological features on Earth.pptxThe Mariana Trench remarkable geological features on Earth.pptx
The Mariana Trench remarkable geological features on Earth.pptx
 
Selaginella: features, morphology ,anatomy and reproduction.
Selaginella: features, morphology ,anatomy and reproduction.Selaginella: features, morphology ,anatomy and reproduction.
Selaginella: features, morphology ,anatomy and reproduction.
 
Climate Change Impacts on Terrestrial and Aquatic Ecosystems.pptx
Climate Change Impacts on Terrestrial and Aquatic Ecosystems.pptxClimate Change Impacts on Terrestrial and Aquatic Ecosystems.pptx
Climate Change Impacts on Terrestrial and Aquatic Ecosystems.pptx
 
Cyanide resistant respiration pathway.pptx
Cyanide resistant respiration pathway.pptxCyanide resistant respiration pathway.pptx
Cyanide resistant respiration pathway.pptx
 
CURRENT SCENARIO OF POULTRY PRODUCTION IN INDIA
CURRENT SCENARIO OF POULTRY PRODUCTION IN INDIACURRENT SCENARIO OF POULTRY PRODUCTION IN INDIA
CURRENT SCENARIO OF POULTRY PRODUCTION IN INDIA
 
Gwalior ❤CALL GIRL 84099*07087 ❤CALL GIRLS IN Gwalior ESCORT SERVICE❤CALL GIRL
Gwalior ❤CALL GIRL 84099*07087 ❤CALL GIRLS IN Gwalior ESCORT SERVICE❤CALL GIRLGwalior ❤CALL GIRL 84099*07087 ❤CALL GIRLS IN Gwalior ESCORT SERVICE❤CALL GIRL
Gwalior ❤CALL GIRL 84099*07087 ❤CALL GIRLS IN Gwalior ESCORT SERVICE❤CALL GIRL
 
ABHISHEK ANTIBIOTICS PPT MICROBIOLOGY // USES OF ANTIOBIOTICS TYPES OF ANTIB...
ABHISHEK ANTIBIOTICS PPT MICROBIOLOGY  // USES OF ANTIOBIOTICS TYPES OF ANTIB...ABHISHEK ANTIBIOTICS PPT MICROBIOLOGY  // USES OF ANTIOBIOTICS TYPES OF ANTIB...
ABHISHEK ANTIBIOTICS PPT MICROBIOLOGY // USES OF ANTIOBIOTICS TYPES OF ANTIB...
 
LUNULARIA -features, morphology, anatomy ,reproduction etc.
LUNULARIA -features, morphology, anatomy ,reproduction etc.LUNULARIA -features, morphology, anatomy ,reproduction etc.
LUNULARIA -features, morphology, anatomy ,reproduction etc.
 
Porella : features, morphology, anatomy, reproduction etc.
Porella : features, morphology, anatomy, reproduction etc.Porella : features, morphology, anatomy, reproduction etc.
Porella : features, morphology, anatomy, reproduction etc.
 

Siena Galaxy Atlas 2020

  • 1. Siena Galaxy Atlas 2020 John Moustakas1 , Dustin Lang2 , Arjun Dey3 , Stéphanie Juneau3 , Aaron Meisner3 , Adam D. Myers4 , Edward F. Schlafly5 , David J. Schlegel6 , Francisco Valdes3 , Benjamin A. Weaver3 , and Rongpu Zhou6 1 Department of Physics and Astronomy, Siena College, 515 Loudon Road, Loudonville, NY 12110, USA; jmoustakas@siena.edu 2 Perimeter Institute for Theoretical Physics, 31 Caroline Street North, Waterloo, ON N2L 2Y5, Canada 3 NSF’s NOIRLab, 950 N. Cherry Avenue, Tucson, AZ 85719, USA 4 Department of Physics and Astronomy, University of Wyoming, Laramie, WY 82071, USA 5 Space Telescope Science Institute, 3700 San Martin Drive, Baltimore, MD 21218, USA 6 Lawrence Berkeley National Laboratory, 1 Cyclotron Road, Berkeley, CA 94720, USA Received 2023 July 10; revised 2023 August 23; accepted 2023 August 24; published 2023 October 18 Abstract We present the 2020 version of the Siena Galaxy Atlas (SGA-2020), a multiwavelength optical and infrared imaging atlas of 383,620 nearby galaxies. The SGA-2020 uses optical grz imaging over ≈20,000 deg2 from the Dark Energy Spectroscopic Instrument (DESI) Legacy Imaging Surveys Data Release 9 and infrared imaging in four bands (spanning 3.4–22 μm) from the 6 year unWISE coadds; it is more than 95% complete for galaxies larger than R(26) ≈ 25″ and r < 18 measured at the 26 mag arcsec−2 isophote in the r band. The atlas delivers precise coordinates, multiwavelength mosaics, azimuthally averaged optical surface-brightness profiles, model images and photometry, and additional ancillary metadata for the full sample. Coupled with existing and forthcoming optical spectroscopy from the DESI, the SGA-2020 will facilitate new detailed studies of the star formation and mass assembly histories of nearby galaxies; enable precise measurements of the local velocity field via the Tully–Fisher and fundamental plane relations; serve as a reference sample of lasting legacy value for time-domain and multimessenger astronomical events; and more. Unified Astronomy Thesaurus concepts: Galaxy photometry (611); Celestial objects catalogs (212) 1. Introduction 1.1. Scientific Context Although a broad theoretical framework exists for under- standing the physics of galaxy formation, many key questions remain unanswered. In this framework, the star formation and stellar mass assembly histories of galaxies are intimately linked to the hierarchical buildup of dark matter halos, modulated by a time-varying interplay between internal (secular) and external (environmental) processes (e.g., Kennicutt 1998; Kormendy & Kennicutt 2004; Blanton & Moustakas 2009; Somerville & Davé 2015; Naab & Ostriker 2017; Wechsler & Tinker 2018). Identifying these physical processes and their relative importance—as a function of cosmic time—remains one of the foremost outstanding problems in observational cosmology. Some of the most pressing outstanding questions include the following: 1. How and why does star formation in galaxies cease? Why do low-mass galaxies exhibit more extended star formation histories than massive galaxies? 2. What is the nature of inside-out galaxy formation—did galaxies start growing earlier in their inner parts, did they end star formation earlier in those parts, or both? 3. How does feedback from active galactic nuclei, super- novae, stellar winds, and other effects regulate star formation? 4. What was the relative impact of mergers versus secular processes on the structure of present-day galaxies, including their bulges, bars, spirals, rings, warps, shells, and pseudobulges? 5. How are all these detailed processes affected by the relationship between galaxies and their host dark matter halo—for example, whether they are central or satellite galaxies? Investigating these and related questions requires an accurate and detailed view of the present-day galaxy population—the population we can potentially understand the best. In particular, the galaxies that are near enough or intrinsically large enough in terms of their apparent angular diameter to be spatially well resolved can be studied in significantly greater detail than more distant, spatially unresolved galaxies.7 For example, in typical ground-based optical imaging, the galaxies with isophotal diameters larger than ≈10″–20″ can be used to study the properties of their disk and spheroidal components as separate, distinct features; to identify bars, rings, disk asymmetries, and other dynamical structures; to discover and characterize their low surface-brightness features such as stellar streams, tidal tails, and outer envelopes; to unveil faint, low-mass satellites; and much more. Because of their unique and high-impact scientific potential, the compilations or atlases of large, nearby galaxies have a long, rich heritage in astronomy. In 1774, nearly 150 yr before observations confirmed that the Milky Way was just one of many “island universes,” Charles Messier published his Catalogue des Nébuleuses et des Amas d’Étoiles, which includes 40 (now-famous) galaxies among a full catalog of 110 objects. Subsequently, building on the naked-eye The Astrophysical Journal Supplement Series, 269:3 (25pp), 2023 November https://doi.org/10.3847/1538-4365/acfaa2 © 2023. The Author(s). Published by the American Astronomical Society. Original content from this work may be used under the terms of the Creative Commons Attribution 4.0 licence. Any further distribution of this work must maintain attribution to the author(s) and the title of the work, journal citation and DOI. 7 We differentiate here between dwarf galaxies in the Local Group whose individual stars can be resolved (Mateo 1998), and galaxies, which are near or large enough to be spatially resolved into components (e.g., bulge versus disk), but which must still be studied via their integrated light. 1
  • 2. surveying effort of William Herschel and his sister Caroline and son John (Herschel 1786, 1864), John Louis Emil Dreyer spent more than two decades assembling the New General Catalogue of Nebulae and Clusters of Stars (NGC) and the Index Catalogues (IC), a sample of approximately 15,000 Galactic and extragalactic objects whose designations are still in wide-spread use today (Dreyer 1888, 1912). The NGC, IC, and other early catalogs laid the foundation for several important galaxy atlases published in the second half of the 20th century covering most of the sky. These atlases used photographic imaging from the Palomar Observatory Sky Survey in the 1950s and 1960s (Minkowski & Abell 1963; Reid & Djorgovski 1993) and the UK Schmidt Southern Sky Survey in the 1970s (Cannon 1979), and include the following: the Catalogue of Galaxies and of Clusters of Galaxies (Zwicky et al. 1968); the Uppsala General Catalog of Galaxies (UGC) and its Addendum (Nilson 1973, 1974); the Morphological Catalog of Galaxies (Vorontsov-Velyaminov & Krasnogorskaya 1974); the ESO/Uppsala Survey of the ESO (B) Atlas (ESO; Lauberts 1982); the Principal Galaxies Catalogue (PGC; Paturel et al. 1989); among others. Eventually, data from these and other catalogs were assembled into the indispensable Third Reference Catalog of Bright Galaxies (RC3; de Vaucouleurs et al. 1991; Corwin et al. 1994). The RC3 contains extensive information on 23,011 nearby galaxies and is purportedly complete for galaxies with Bt,Vega < 15.5, ( ) > ¢ D 25 1 , and v < 15,000 km s−1 (z < 5 × 10⁻⁵ ), although it does include a number of objects outside these limits that are of special interest.8 The advent of wide-area (>103 deg2 ), multiwavelength imaging surveys has produced the next-generation atlases of large angular-diameter galaxies in the ultraviolet and infrared, including the the Two Micron All Sky Survey (2MASS) Large Galaxy Atlas (Jarrett et al. 2003), the NASA–Sloan Atlas (NSA; Blanton et al. 2005, 2011), the Galaxy Evolution Explorer (GALEX) Ultraviolet Atlas of Nearby Galaxies (Gil de Paz et al. 2007), the Spitzer Survey of Stellar Structure in Galaxies (Sheth et al. 2010), the z = 0 Multiwavelength Galaxy Synthesis (Leroy et al. 2019), and the Wide-Field Infrared Survey Explorer (WISE) Extended Source Catalog of the 100 Largest Galaxies (Jarrett et al. 2019). However, with the exception of the NSA, the optical sizes, shapes, and total magnitudes for the objects in these atlases are based on the photographic-plate measurements published in the RC3. The NSA, meanwhile, delivers new optical measurements of nearby (z < 0.05) galaxies using ≈8000 deg2 of ugriz imaging from the Sloan Digital Sky Survey (SDSS; York et al. 2000), but is 30% incomplete at r  14 (Wake et al. 2017).9 1.2. The Need for a New Large-galaxy Atlas With the historical context in mind, several recent developments motivate a renewed effort to assemble a uniform data set of large angular-diameter galaxies. First, three new ground-based optical imaging surveys jointly called the Dark Energy Spectroscopic Instrument (DESI) Legacy Imaging Surveys (hereafter, the Legacy Surveys) have delivered deep imaging in g, r, and z over ≈20,000 deg2 of the extragalactic (i.e., low Galactic extinction) sky (Dey et al. 2019; D. J. Schlegel et al. 2023, in preparation). These data provide exquisite photometric and astrometric precision and reach 1–2 mag deeper than either SDSS or Pan-STARRS1 (Cham- bers et al. 2016). In addition, the development of the state-of- the-art image modeling code The Tractor provides a computationally tractable means of working with multiband, multipass, variable-seeing imaging, enabling dedicated studies of large angular-diameter galaxies (Lang et al. 2016; D. Lang et al. 2023, in preparation). Second, in 2021 May, the DESI Survey began a 5 year program (2021–2026) to obtain precise spectroscopic redshifts for an unprecedented sample of more than 40 million galaxies and 10 million stars over the ≈14,000 deg2 Legacy Surveys footprint accessible from the 4 m Mayall Telescope at Kitt Peak National Observatory (KPNO; DESI Collaboration et al. 2016a, 2016b; Abareshi et al. 2022). As part of this effort, the DESI Bright Galaxy Survey (BGS) is obtaining spectra and redshifts for a statistically complete sample of >10 million galaxies brighter than r = 20.175 (Hahn et al. 2023). A high- quality photometric catalog of the largest angular-diameter galaxies over the DESI footprint is needed to ensure the BGS has high completeness and does not suffer from the photometric shredding and spectroscopic incompleteness of the SDSS at bright magnitudes (Wake et al. 2017). To address these and other needs, we present the 2020 version of the Siena Galaxy Atlas (SGA), SGA-2020, an optical and infrared imaging atlas of nearly 4 × 10⁵ galaxies approximately limited to an angular diameter of 25″ at the 26 mag arcsec−2 isophote for galaxies brighter than r ≈ 18 over the 20,000 deg2 footprint of the DESI Legacy Imaging Surveys Data Release 9 (LS/DR9; Dey et al. 2019; D. J. Schlegel et al. 2023, in preparation; see Figure 1). The SGA-2020 delivers precise coordinates, multiwavelength mosaics, azimuthally averaged optical surface-brightness and color profiles, model images and photometry, and additional metadata for the full sample.10 Notably, for many of the largest (e.g., NGC/IC/ Messier) galaxies in the sky, especially outside the SDSS imaging footprint, the SGA-2020 delivers the first reliable measurements of the optical positions, shapes, and sizes of large galaxies since the RC3 was published more than 30 yr ago. By combining existing (archival) spectroscopic redshifts with forthcoming DESI spectroscopy, the SGA-2020 will spur a renewed effort to tackle several outstanding problems in extragalactic astrophysics, particularly the interplay between galaxy formation and dark matter halo assembly. It will also support studies of time-domain and multimessenger astronom- ical events, which are often hampered by incomplete or heterogeneous catalogs of large, nearby galaxies, which are most likely to host the electromagnetic counterparts of gravitational wave events (Gehrels et al. 2016; Abbott et al. 2020) and other classes of transients. Moreover, within the ≈14,000 deg2 DESI footprint, the SGA-2020 is ensuring high photometric completeness for the BGS, and is facilitating high- impact ancillary science through a variety of secondary targeting programs (DESI Collaboration et al. 2023a; 8 D(25) represents the diameter of the galaxy at the - 25 mag arcsec 2 isophote in the optical and is a well-established and historically important measure of the “size” of a galaxy popularized by the RC3. 9 Note that the incompleteness in the SDSS Main Survey (Strauss et al. 2002) impacts all other SDSS galaxy catalogs such as Simard et al. (2011), Meert et al. (2015). The NSA mitigates this incompleteness to some degree by utilizing redshifts from other surveys, but a nonnegligible fraction of the largest, brightest galaxies in the local universe are still missed. 10 https://sga.legacysurvey.org 2 The Astrophysical Journal Supplement Series, 269:3 (25pp), 2023 November Moustakas et al.
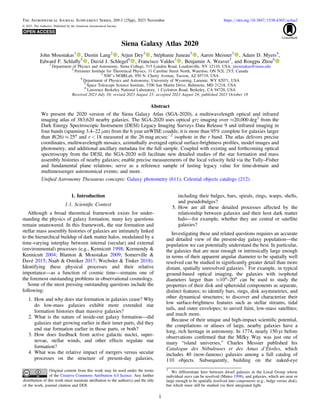
  • 3. Myers et al. 2023). For example, the DESI Peculiar Velocity Survey will place precise new constraints on the growth rate of large-scale structure by measuring the Tully–Fisher and fundamental-plane scaling relations (Tully & Fisher 1977; Djorgovski & Davis 1987) from SGA-2020 targets at z < 0.15 (Saulder et al. 2023). And finally, the SGA-2020 will help engage the broader public with visually striking color mosaics of large, well-resolved, nearby galaxies, enabling a myriad of educational and public-outreach activities. We organize the remainder of the paper in the following way: In Section 2, we define the SGA-2020 parent sample and describe the procedure we use to define the final sample of galaxies and their associated (angular) group membership. In Section 3, we describe our photometric analysis, including how we construct the custom multiwavelength mosaics, model the two-dimensional images of each galaxy, and measure their azimuthally averaged surface-brightness and color profiles. Of particular interest for some readers may be Section 3.3, where we validate our surface-brightness profiles and summarize the principal SGA-2020 data products. In Section 4, we quantify the completeness of the SGA and review how it improves upon existing large-galaxy catalogs, and in Section 5, we highlight some of the exciting potential scientific applications of the SGA-2020. Finally, Section 6 summarizes the main results of this paper and outlines some of the improvements we intend to include in the next version of the SGA. Note that, unless otherwise indicated, all magnitudes are on the AB magnitude system (Oke & Schild 1970) and have not been corrected for foreground Galactic extinction. We report all fluxes in units of “nanomaggies,” where 1 nanomaggie is the (linear) flux density of an object with an AB magnitude of 22.5.11 Figure 1. Optical mosaics of 42 galaxies from the SGA-2020 sorted by increasing angular diameter from the top left to the bottom right. Galaxies are chosen randomly from a uniform (flat) probability distribution in angular diameter. The horizontal white bar in the lower left corner of each panel represents ¢ 1 , and the mosaic cutouts range from ¢ 3.2 to ¢ 13.4. This figure illustrates the tremendous range of galaxy types, sizes, colors, and surface-brightness profiles, internal structure, and environments of the galaxies in the SGA. 11 https://www.legacysurvey.org/dr9/description/#photometry 3 The Astrophysical Journal Supplement Series, 269:3 (25pp), 2023 November Moustakas et al.
  • 4. 2. Parent Sample and Group Catalog 2.1. Building the Parent Sample Many of the largest, highest-surface-brightness galaxies in the sky have been famously known for a long time and are part of many of the legacy (photographic-plate) large-galaxy catalogs discussed in Section 1 (e.g., RC3). More recently, fainter, lower surface-brightness (but still “large,” spatially resolved) galaxies have been cataloged by modern, wide-area optical and near-infrared imaging surveys like the SDSS, 2MASS (Skrutskie et al. 2006), and Pan-STARRS1 (Chambers et al. 2016). For the first version of the SGA, we opt to build upon this body of previous work by beginning from these and other catalogs of “known” large angular-diameter galaxies (but see the discussion in Section 6). Fortunately, several user-oriented databases exist, which curate the positions, sizes, magnitudes, redshifts, and other information on millions of extragalactic sources cataloged by different surveys, including SIMBAD (Wenger et al. 2000), the NASA Extragalactic Database (NED; Helou et al. 1991), and HyperLeda (Makarov et al. 2014). After some experimentation, we opt to construct the initial SGA-2020 parent sample using the HyperLeda12 extragalactic database. HyperLeda includes extensive metadata on nearly all known large angular-diameter galaxies, building on the heritage of the RC3 and earlier large- galaxy atlases. In addition, an effort has been made by the HyperLeda team to homogenize the angular diameters, magnitudes, and other observed properties of the galaxies that have been ingested into the database from a wide range of different surveys and catalogs (Paturel et al. 1997; Makarov et al. 2014). This procedure imposes some uniformity on our parent sample, although we show in Section 3.3 the significant value of computing the geometry (diameter, position angle, and ellipticity) and photometry of galaxies consistently and using modern (deep, wide-area) optical imaging. With these ideas in mind, we query the HyperLeda extragalactic database for galaxies with angular diameter DL(25) > 12″ ( ¢ 0.2), where DL(25) is the major-axis diameter of the galaxy at the 25 mag arcsec−2 surface-brightness isophote in the optical (typically the Johnson–Morgan B band; see Appendix A for additional details). Our query results in an initial parent sample of 1,436,176 galaxies. Using visual inspection and a variety of quantitative and qualitative tests, we cull this initial sample by applying the following additional cuts: first, we remove the Large and Small Magellanic Clouds and the Sagittarius Dwarf Galaxy from the sample by imposing a maximum angular diameter of ( ) < ¢ D 25 180 L . These galaxies span such a large projected angular size on the sky (many degrees) that their inclusion is outside the scope of the SGA (but see Jarrett et al. 2019). After removing these objects, the largest angular-diameter galaxies that remain are NGC 0224 = M31 and NGC 0598 = M33 whose DL(25) diameters are ¢ 178 and ¢ 62 , respectively. Furthermore, we limit the sample on the lower end to DL(25) > 20″, which removes roughly 900,000 galaxies (approximately 65% of the initial sample). We implement this cut because we find that the fraction of sources with incorrect (usually overestimated) diameters in HyperLeda increases rapidly below this limit. Moreover, we find that galaxies smaller than DL(25) ≈ 20″ are well modeled by Tractor as part of the standard photometric pipeline used in LS/DR9 (Dey et al. 2019; D. J. Schlegel et al. 2023, in preparation). Next, we remove approximately 3800 galaxies with no magnitude estimate in HyperLeda (as selected by our query; see Appendix A), which we find to be largely spurious, as well as approximately 6500 objects with significantly overestimated diameters (or spurious sources), which we identify via visual inspection. Many of these cases are groupings of small galaxies or stars along a line, which have been misinterpreted by previous fitting algorithms as a single edge-on galaxy. In addition, we remove approximately 1700 galaxies whose primary galaxy identifier (in HyperLeda) is from either SDSS or 2MASS and whose central coordinates place it inside the elliptical aperture of another (non-SDSS and non-2MASS) galaxy with DL(25) diameter greater than 30″. We find that in the majority of cases these objects have grossly overestimated diameters, presumably due to shredding by the 2MASS and SDSS photometric pipelines. Figure 2 displays a gallery of some of the most common types of sources we reject from our initial parent sample using these cuts. Now, to improve the completeness of the parent sample, we supplement the initial HyperLeda catalog with sources drawn from three additional catalogs, making sure to carefully handle duplicate entries. First, we add a subset of the Local Group dwarf galaxies from McConnachie (2012). From the original sample of 93 galaxies in McConnachie (2012), we remove 47 that have such a low surface brightness and are so well resolved that including them is beyond the scope of the current version of the SGA.13 For reference, the median surface brightness of these 47 systems is μV = 28.8 mag arcsec−2 , well below the surface-brightness completeness limit of the SGA-2020 (see Section 3.3). Furthermore, we remove the Fornax and Sculptor dwarf galaxies, which are higher surface brightness (μV = 25.1–25.5 mag arcsec−2 ) but very well resolved into stars and star clusters and too challenging to include in this initial version of the SGA. Next, we add 190 galaxies from the RC3 and OpenNGC14 catalogs which are missing from our initial HyperLeda sample. Surprisingly, many of these systems are large and have high average surface brightness; however, we suspect that an issue with our database query (see Appendix A) may have inadvertently excluded these sources from our initial catalog. And finally, we use the Legacy Surveys Data Release 8 (DR8) photometric catalogs to identify 2890 additional large-diameter galaxies in the Legacy Surveys footprint.15 Specifically, after applying a variety of catalog-level quality cuts and extensive visual inspection, we include in our parent sample all objects (not already in our sample) from DR8 with half-light radii r50 > 14″ based on their Tractor model fits. Our final parent sample contains 531,677 galaxies approxi- mately limited to DL(25) > 20″ and spanning a wide range of magnitude and surface brightness. In Figure 3, we show the celestial distribution of this sample, and in Figure 4, we show the range of apparent bt-band magnitude16 and angular 12 http://leda.univ-lyon1.fr/ 13 For reference, we remove the following Local Group dwarfs: Andromeda I, II, III, V, VII, IX, X, XI, XII, XIII, XIV, XV, XVI, XVII, XVIII, XIX, XX, XXI, XXII, XXIII, XXIV, XXV, XXVI, XXVII, and XXIX; Antlia; Aquarius; Bootes I and II; Canes Venatici I and II; Carina; Coma Berenices; Draco; Hercules; Leo IV, V, and T; Pisces II; Sagittarius dSph; Segue I and II; Sextans I; Ursa Major I and II; Ursa Minor; and Willman 1. 14 https://github.com/mattiaverga/OpenNGC 15 https://legacysurvey.org/dr8 16 http://leda.univ-lyon1.fr/leda/param/bt.html 4 The Astrophysical Journal Supplement Series, 269:3 (25pp), 2023 November Moustakas et al.
  • 5. diameter spanned by the parent sample. We discuss the completeness of the sample in Section 4. 2.2. Projected Group Catalog Our approach for the SGA is to jointly analyze galaxies that are relatively close to one another in terms of their projected (or angular) separation in order to properly fit overlapping light profiles. We emphasize that we do not require galaxies to be physically associated, which would require knowledge of their redshifts or physical separation. We build a simple group catalog from the parent sample described in Section 2.1 using the spheregroup friends-of-friends algorithm.17 We use a ¢ 10 linking length, taking care to ensure that galaxies assigned to the same group overlap within 2 times their circularized DL(25) diameter. Using this procedure, we identify 14,930 projected galaxy groups with two members, 1585 groups with 3–5 members, 51 with 6–10 members, and just four groups with more than 10 members, including the center of the Coma Cluster, the Virgo Cluster, and A3558 (although A3558 is outside the LS/DR9 imaging footprint; see Section 3.3). Notably, 496,255 objects or 93% of the parent sample are isolated according to the criteria used to build the group catalog. For each galaxy group, we compute several quantities that we refer to in subsequent sections of the paper (but see Appendix B for the complete data model). GROUP_NAME is a unique group name, which we construct from the name of the group’s largest member (ranked by DL(25)) and the suffix _GROUP (e.g., NGC 4406_GROUP). For isolated galaxies, GROUP_NAME is just the name of its only member (i.e., without the _GROUP suffix). In addition, we compute GROUP_RA and GROUP_DEC to be the DL(25)-weighted R.A. and decl., respectively, of all the group members. Once again, for isolated systems, GROUP_RA Figure 2. Gallery of common types of HyperLeda sources rejected while building the parent sample. In each panel, the horizontal white bar represents 30″. The top row shows one spurious object and three examples of pairs or triples of stars or compact galaxies, which are recorded in HyperLeda as one “large” galaxy (represented by the red ellipse). The middle row shows four examples of how bright stars and galaxies can lead to significantly overestimated galaxy diameters in HyperLeda. For example, PGC 2500856 in the middle right panel is a blue star, which has been miscategorized by HyperLeda as a galaxy with a major-axis diameter of ≈54″ presumably due to the proximity of the nearby bright galaxy PGC 3087062, which appears in the final SGA-2020 catalog (blue ellipse). Finally, the bottom row shows four examples of sources in HyperLeda, which are in fact photometric shreds or misidentified parts of a galaxy. In each case, the blue ellipse shows the correct parent galaxy from the SGA-2020 while the red ellipse is the incorrect source from HyperLeda, which we remove from the parent sample (see Section 2.1). For example, PGC 071502 and PGC 093084 are H II regions in ESO240-004 and NGC 1507, respectively, while SDSSJ211630.38+001817.7 is a foreground star in the body of PGC 188224 with an incorrect angular diameter. 17 https://pydl.readthedocs.io/en/latest 5 The Astrophysical Journal Supplement Series, 269:3 (25pp), 2023 November Moustakas et al.
  • 6. and GROUP_DEC are identical to the RA and DEC coordinates of that galaxy (see Appendix B). Finally, we record our estimate of the diameter of the group in the quantity GROUP_DIAMETER. For isolated galaxies, GROUP_DIAMETER equals DL(25), but for groups, we compute GROUP_DIAMETER to be the maximum separation of all the pairs of group members plus their DL(25) diameter (in arcminutes). 3. Photometric Analysis 3.1. Imaging Data We build the SGA-2020 from the same optical and infrared imaging data used to produce the Legacy Surveys DR9 (Dey et al. 2019; D. J. Schlegel et al. 2023, in preparation).18 Briefly, the optical data consist of grz imaging over ≈20,000 deg2 from a number of different surveys. In the North Galactic Cap, we use data from the Beijing–Arizona Sky Survey (BASS; Zou et al. 2017), which provides ≈5000 deg2 of gr imaging using the 90Prime Camera (Williams et al. 2004) on the Steward Observatory Bok 2.3 m telescope at KPNO; and data from the Mayall z-band Legacy Survey (MzLS), which provides z-band imaging over the same ≈5000 deg2 footprint as BASS using the Mosaic-3 camera (Dey et al. 2016) at the KPNO Mayall 4 m telescope. Figure 3. Distribution of 531,677 galaxies in the SGA-2020 parent sample in an equal-area Mollweide projection in equatorial coordinates, binned into 3.4 deg2 healpix pixels (Zonca et al. 2019). The dark gray curve represents the Galactic plane. Note the significant variations in galaxy surface density, which we attribute to surface-brightness incompleteness and heterogeneity in the aggregate HyperLeda catalog. Figure 4. Isophotal diameter, DL(25), vs. bt-band magnitude (left) and marginalized distribution of DL(25) (right) for the SGA-2020 parent sample. The black contours, points, and histogram represent galaxies from HyperLeda, while the green points and histogram are galaxies from the supplemental catalogs we use to increase the completeness of the sample (see Section 2.1). For reference, the contours enclose 50%, 75%, 95%, and 99.5% of the blue points. These figures show that, by construction, the SGA-2020 parent sample is largely limited to DL(25) > 20″ ( ¢ 0.333) but with a tail of galaxies with diameters as small as ≈10″ (» ¢ 0.167), and it includes galaxies as bright as bt,Vega ≈ 8. 18 https://www.legacysurvey.org/dr9 6 The Astrophysical Journal Supplement Series, 269:3 (25pp), 2023 November Moustakas et al.
  • 7. In the South Galactic Cap (SGC) and in the North Galactic Cap up to a decl. of approximately +32°, we use grz imaging over ≈15,000 deg2 from roughly 50 distinct (but uniformly processed) data sets obtained with the Dark Energy Camera (DECam; Flaugher et al. 2015) at the Cerro Tololo Inter- American Observatory 4 m Blanco telescope. Note that the majority of this DECam imaging comes from the DECam Legacy Survey (DECaLS; Dey et al. 2019) and the Dark Energy Survey (DES; Dark Energy Survey Collaboration et al. 2016; Abbott et al. 2021).19 We supplement the optical data with all-sky infrared imaging at 3.4–22 μm from WISE (Wright et al. 2010). Specifically, we use the 6 yr WISE plus NEOWISE-Reactivation (NEOWISE- R; Mainzer et al. 2014) image stacks in W1 (3.4 μm) and W2 (4.6 μm) from Meisner et al. (2021), and the W3 (12 μm) and W4 (22 μm) unblurred image stacks from Lang (2014); collectively, we refer to these custom image stacks as the unWISE coadds.20 Note that in the SGA-2020 we produce WISE image coadds for each galaxy (or galaxy group) in the sample but do not measure the infrared surface-brightness profiles; however, we intend to deliver the infrared (and ultraviolet) surface-brightness profiles and integrated photo- metry in a future version of the SGA (see Section 6). 3.2. Multiwavelength Mosaics and Surface-brightness Profiles At this point in the analysis, we have multiband optical and infrared imaging covering roughly half the sky (Section 3.1) and an input parent catalog of central coordinates and system diameters for more than half a million sources (Section 2.2). The next steps are to build custom multiwavelength mosaics centered on each of these positions (Section 3.2.1); model all the sources in the field using The Tractor (Section 3.2.2); and measure elliptical aperture photometry and azimuthally averaged surface-brightness profiles (Section 3.2.3). Before proceeding, we briefly summarize the principal software products we use, as well as the relationship between them. First, given an astrometrically and photometrically calibrated image, inverse variance image, and knowledge of the point-spread function (PSF), The Tractor21 uses the PSF and a family of two-dimensional galaxy models to forward- model the observed pixel-level data (Lang et al. 2016; Dey et al. 2019; D. Lang et al. 2023, in preparation). One of the principal advantages of The Tractor is that it handles multiband, multi-CCD, variable-PSF imaging in a statistically rigorous way, which is especially important when dealing with the full range of optical and infrared (WISE) data from the Legacy Surveys. In order to handle the imaging data, the Legacy Surveys team has developed legacypipe,22 a photometric pipeline that wraps The Tractor as its fitting engine and conveniently handles many tasks related to this imaging data set (Dey et al. 2019). Finally, for the SGA project specifically, we have developed the SGA23 and legacyha- los24 software products, which rely on some of the lower- level legacypipe functionality (with Message Passing Interface parallelization) but also include code to carry out the nonparametric photometric analysis, which is one of the cornerstone data products of the SGA-2020 (see Section 3.3). 3.2.1. Mosaics Given the diameter of each system and its central coordinates (GROUP_RA, GROUP_DEC, and GROUP_DIAMETER; see Section 2.2), we first determine if LS/DR9 imaging exists in all three grz bands over at least 90% of the area. If not, we remove that system from further analysis (including, unfortu- nately, NGC 0224 = M31, where we only have MzLS z-band imaging). Then, for the remaining objects, we generate g-, r-, and z-band mosaics with a size that depends on the group size: for groups with GROUP_DIAMETER < 14′, we generate a mosaic of diameter 3 × GROUP_DIAMETER; for groups with 14′ < GROUP_DIAMETER < 30′ , we generate a mosaic of diameter 2 × GROUP_DIAMETER; and for NGC 0598 = M33, whose GROUP_DIAMETER is > ¢ 30 , we use a mosaic diameter of 1.4 × GROUP_DIAMETER. We also choose the input imaging according to the following criteria: we use the DECam imaging (from DECaLS and DES) for all of the SGC, and for the North Galactic Cap when GROUP_DEC < 32° .375; and the BASS plus MzLS imaging otherwise (see Section 4.1.3 of Myers et al. 2023). Our analysis begins with reduced and calibrated CCD-level 90Prime, Mosaic-3, and DECam imaging. These reduced data are generated using the NOIRLab Community Pipeline (CP) dedicated to each instrument (e.g., Valdes et al. 2014), together with several custom data-reduction steps developed by the Legacy Surveys team. We refer the reader to Dey et al. (2019) and D. J. Schlegel et al. (2023, in preparation) for a detailed description of these data-reduction procedures. Briefly, we use Pan-STARRS1 PSF photometry (Chambers et al. 2016; Finkbeiner et al. 2016) transformed to the natural filter system of each instrument for photometric calibration25 and Gaia Data Release 2 (Gaia Collaboration et al. 2018) stellar positions for astrometry.26 The average photometric precision for bright (but unsaturated) stars is better than ±10 mmag in grz over the full footprint, and the astrometric precision is approximately ±0 030 for DECam and Mosaic-3 and ±0 12 mas for 90Prime (Dey et al. 2019). Accurate large-galaxy photometry depends crucially on robust and unbiased background-subtraction. For the SGA- 2020, we utilize the same background-subtracted images used for LS/DR9. As we discuss below and in Section 3.3, however, the sky-subtracted data do contain systematic errors, which we intend to mitigate in future versions of the SGA (see the discussion in Section 6). First, the CP carefully masks astrophysical sources and then subtracts the large-scale sky-pattern across the field of view from each exposure using a low-order spline model derived from robust statistics measured on the individual CCDs. We note that the 90Prime, Mosaic-3, and DECam CCDs are approximately ¢ ´ ¢ 30 30 , 17 5 × 17 5, and ¢ ´ ¢ 9 18 , respec- tively, so the angular scale of this background model is much larger than all but the largest galaxies in the SGA-2020. Next, the CP subtracts the camera reflection pattern (or pupil ghost) from the DECam and Mosaic-3 data and the fringe pattern from the Mosaic-3 z-band and 90Prime r-band data. Telescope 19 See Dey et al. (2019) for a complete list of the DECam programs used. 20 http://unwise.me 21 https://github.com/dstndstn/tractor 22 https://github.com/legacysurvey/legacypipe 23 On GitHub: https://github.com/moustakas/SGA with version 0.1 deposited to Zenodo (Moustakas et al. 2023). 24 On GitHub: https://github.com/moustakas/legacyhalos with version 1.4 deposited to Zenodo (Moustakas & Lang 2023). 25 https://www.legacysurvey.org/dr9/description/#photometry 26 https://www.legacysurvey.org/dr9/description/#astrometry 7 The Astrophysical Journal Supplement Series, 269:3 (25pp), 2023 November Moustakas et al.
  • 8. reflections from very bright stars are not removed. Next, the CP aggressively subtracts the high-frequency pattern noise (caused by a drifting amplifier bias level) present in the Mosaic-3 imaging. The pattern fitting was designed to preserve counts in smaller galaxies and stars but, unfortunately, has a significant effect on the low-surface-brightness outer envelopes of the galaxies in our sample. This pattern-noise subtraction affects all the MzLS imaging and causes galaxies to appear too green in the grz color mosaics (see Appendix C). For DECam, we also subtract a residual g-, r-, and z-band sky pattern and a z-band fringe pattern from the data using median-scaled templates derived from multiple exposures (in a given bandpass) within one or more nights.27 Finally, we remove the spatially varying sky-background on the smallest scales by dividing each CCD into 512 pixel boxes, computing the robust median, and using spline interpolation to build the final background map. During this step, we mask pixels that lie within the elliptical aperture of any galaxy in the SGA-2020 parent catalog (from Section 2.1), as well as Gaia stars and other sources detected in each image. Finally, with all the reduced data in-hand, we build the full- field mosaic for each galaxy (or galaxy group) as the inverse- variance weighted sum of all the available imaging (in each bandpass) projected onto a tangent plane using Lanczos-3 (sinc) resampling. For the grz imaging, we adopt a constant pixel scale of 0 262 pixel−1 , and for the unWISE mosaics, we use 2 75 pixel−1 . The left panels of Figures 5 and 6 show, as examples, the grz color mosaics for the isolated galaxy NGC 5016 and PGC 193192, a member of the PGC 193199 Group, respectively. 3.2.2. Tractor Modeling and Masking We use The Tractor to model all the sources in a given mosaic, including the large angular-diameter galaxies of interest. Note that all source detection and model fitting with The Tractor takes place on these coadded images (triggered by invoking the --fit-on-coadds option in legacy- pipe), unlike for the standard DR9 processing in which all model fitting is done using the unresampled CCD images jointly (see Dey et al. 2019; D. J. Schlegel et al. 2023, in preparation). One issue is that The Tractor tends to fit the high-surface- brightness central regions of large galaxies at the expense of their outer envelopes, creating undesirable systematic residuals in their outer parts. This problem occurs despite the larger variance—smaller inverse variance—in the central parts from source Poisson noise. Therefore, before fitting, we multiply the optical inverse variance mosaics (I) by a factor of I I50 , where I50 is the median inverse variance of the whole mosaic. This scaling tends to reduce I in the central part of the galaxy and increase it in its outer regions, generally leading to better modeling results. In addition, we increase the threshold for detecting and deblending sources by specifying --saddle-fraction 0.2 and --saddle-min 4.0 (the default values are 0.1 and 2.0, respectively). The saddle-fraction parameter controls the fractional peak height for identifying new sources around existing sources, and saddle-min is the minimum required saddle-point depth (in units of the standard deviation of pixel values above the noise) from existing sources down to new sources. We find these options necessary in order to prevent excessive shredding and overfitting of the resolved galactic structure in individual galaxies (e.g., H II regions). Finally, The Tractor detects sources, creates a segmentation map, and then uses the mean PSF of the coadd to compute the two- dimensional, maximum-likelihood model of each source (fitting all three grz bands simultaneously) from among the following possibilities: PSF, REX, EXP, DEV, or SER.28 For reference, we construct the PSF of the coadd as the inverse-variance weighted average PSF of the individual pixelized PSFs contributing to the coadd, which is sufficient given that the galaxies we are interested in, DL(25)  20″, are significantly larger than the optical image quality, PSFFWHM ≈ 1″–2″. The middle left panels of Figures 5 and 6 show The Tractor model image stack for NGC 5016 and the PGC 193199 Group, respectively. Overall, the model is an excellent description of the data, particularly for the small, compact sources in the field. However, note how The Tractor fits the (resolved) spiral arms in NGC 5016 as elongated blue “galaxies,” and the extended outer envelopes of the early-type galaxy models in the PGC 193199 Group compared to the data. Despite these issues, The Tractor models of the large galaxies in our sample are extremely useful and complementary to the nonparametric photometric measure- ments we carry out in Section 3.2.3. Using The Tractor models, we next build an image mask, which we use in Section 3.2.3. First, we read the maskbits29 bit-mask image produced as part of the pipeline, but only retain the BRIGHT, MEDIUM, CLUSTER, ALLMASK_G, ALL- MASK_R, and ALLMASK_Z bits. Hereafter, we refer to this mask as the starmask. Next, we build a residual mask, which accounts for statistically significant differences between the data and the Tractor models. In detail, we flag all pixels that deviate by more than 5σ (in any bandpass) from the absolute value of the Gaussian-smoothed residual image, which we construct by subtracting the model image from the data and smoothing with a 2 pixel Gaussian kernel. This step obviously masks all sources, including the large galaxies of interest, but we restore those pixels in the next step. In addition, we iteratively dilate the mask two times and mask the pixels along the border of the mosaic with a border equal to 2% the size of the mosaic. Then, we iterate on each galaxy in the group from brightest to faintest based on The Tractor r-band flux and carry out the following steps: (1) For each galaxy, we construct the model image from all Tractor sources in the field except the galaxy of interest and subtract this model image from the data. (2) We measure the mean elliptical geometry of the galaxy (center, ellipticity, position angle, and approximate semimajor axis length) based on the second moment of the light distribution (hereafter, the ellipse moments) using a modified version of Michele Cappellari’s mge.find_ga- laxy30 algorithm (Cappellari 2002). When computing the ellipse moments, we first median-filter the image with a 3 pixel boxcar to smooth out any small-scale galactic structure, and we only use pixels with μr < 27 mag arcsec−2 . (3) Finally, we combine the residual mask with the starmask (using 27 https://www.legacysurvey.org/dr9/sky 28 Briefly, REX is a round (ò = 0) exponential galaxy model with variable half- light radius; EXP and DEV represent an exponential and de Vaucouleurs (1948) galaxy profile, respectively; and SER is a Sersic (1968) galaxy model (see Dey et al. 2019 and the LS/DR9 documentation for more details). 29 https://www.legacysurvey.org/dr9/bitmasks/#maskbits 30 http://www-astro.physics.ox.ac.uk/~mxc/software/#mge 8 The Astrophysical Journal Supplement Series, 269:3 (25pp), 2023 November Moustakas et al.
  • 9. Boolean logic), but we unmask pixels belonging to the galaxy based on the ellipse moments geometry using 1.5 times the estimated semimajor axis of the galaxy. Occasionally, the preceding algorithm fails in fields contain- ing more than one galaxy if the central coordinates of one of the galaxies are masked by a previous (brighter) system. We consider a source to be impacted if any pixel in a 5 × 5 pixel box centered on The Tractor position of the galaxy is masked. In this case, we iteratively shrink the elliptical mask of any of the previous galaxies until the central position of the galaxy currently being analyzed is unmasked. We emphasize that this algorithm is not perfect, particularly in very crowded galactic fields like the center of the Coma Cluster, but we intend to improve it in future versions of the SGA. Another occasional failure mode is if the flux-weighted position of the galaxy based on the ellipse moments differs by The Tractor position by more than 10 pixels, which can happen in crowded fields and near bright stars and unmasked image artifacts; in this case, we revert to using The Tractor coordinates and model geometry. The bottom left panels of Figures 5 and 6 show the final masked r-band image for NGC 5016 and PGC 193192, respectively. 3.2.3. Surface-brightness Profiles With the multiwavelength mosaics and per-galaxy image masks in-hand, we next measure the surface-brightness profiles Figure 5. Illustration of the key steps and data products of the SGA-2020 pipeline for one example galaxy, NGC 5016. The three panels on the left-hand side show (top left) a color montage of the optical imaging; (middle left) a color montage of the corresponding Tractor model image; and (bottom left) the r-band image with masked pixels zeroed out (white pixel values). The nested black ellipses in this panel correspond to nine surface-brightness levels between μr = 22 and 26 mag arcsec−2 in 0.5 mag arcsec−2 steps, with the solid blue isophote representing the outermost, R(26), size of the galaxy. The right-hand panels show (top right) the azimuthally averaged g- (blue), r- (green), and z-band (red) surface-brightness profiles as a function of the semimajor axis; (middle right) the observed-frame g − r (purple) and r − z (orange) color profiles; and (bottom right) the apparent brightness of NGC 5016 in g (filled blue squares), r (filled green circles), and z (filled red triangles) measured within the same elliptical apertures shown in the lower left panel. The dashed- and solid-gray lines in the top right panel indicate, for reference, the r-band half-light radius from Equation (2) and the R(26) radius, respectively, and the bottom right panel also shows the best-fitting curve-of-growth models (independently fit to the photometric data in each bandpass) given by Equation (1). The legend in the lower right panel also provides the integrated (asymptotic) grz magnitudes for this galaxy. 9 The Astrophysical Journal Supplement Series, 269:3 (25pp), 2023 November Moustakas et al.
  • 10. and photometric curves of growth for each galaxy in the sample using the standard ellipse-fitting and aperture photometry techniques in photutils31 (Bradley 2023). We assume a fixed elliptical geometry as a function of semimajor axis using the ellipse moments measured in Section 3.2.2, and robustly determine the surface brightness along each elliptical path from the light-weighted central pixel to 2 times the estimated semimajor axis of the galaxy in a 1 pixel (0 262) interval. In detail, we measure the surface brightness (and the uncertainty) using two σ clipping iterations, a 3σ clipping threshold, and median-area integration.32 From the r-band surface-brightness profile, we also robustly measure the size of the galaxy at nine equally spaced surface- brightness thresholds between μr = 22 and 26 mag arcsec−2 . We perform these measurements by fitting a linear model to the surface-brightness profile converted to mag arcsec−2 versus r1/4 (which would be a straight line for a de Vaucouleurs galaxy profile), but only consider measurements that are within ±1 mag arcsec−2 of the desired surface-brightness threshold. To estimate the uncertainty in the resulting radius, we generate 30 Monte Carlo realizations of the surface-brightness profile and use the standard deviation of the resulting distribution of radii. We also measure the curve of growth in each bandpass using the tools in photutils.aperture. Briefly, we integrate the image and variance image in each bandpass using elliptical apertures from the center of the galaxy to 2 times its estimated semimajor axis (based on the ellipse moments), again with a 1 pixel (0 262) interval.33 We fit the resulting curve of growth, m(r), using the following empirical model: ⎜ ⎟ ⎡ ⎣ ⎢ ⎛ ⎝ ⎞ ⎠ ⎤ ⎦ ⎥ ( ) ( ) a = + + a - m r m m r r log 1 , 1 e tot 0 1 0 2 Figure 6. Like Figure 5, but for PGC 193192, the second-largest member of the PGC 193199 Group. 31 https://photutils.readthedocs.io/en/stable 32 In other words, we use nclip=2, sclip=3, and integrmode=me- dian, as documented in the photutils.isophote.Ellipse.fit_- image method. 33 Unfortunately, our original elliptical aperture photometry had an irrecoverable bug, so in the final release of the SGA-2020, we infer the aperture photometry from the surface-brightness profiles; see Appendix C for details. 10 The Astrophysical Journal Supplement Series, 269:3 (25pp), 2023 November Moustakas et al.
  • 11. where mtot, m0, α1, α2, and r0 are constant parameters of the model, and r is the semimajor axis in arcseconds. In our analysis, we take the radius scale factor r0 = 10″ to be fixed (which makes α1 dimensionless). Note that, in the limit r → ∞ , mtot is the total, integrated magnitude. Using this model, we infer the half-light semimajor axis length, r50, analytically from the best-fitting model parameters: ⎜ ⎟ ⎧ ⎨ ⎩ ⎡ ⎣ ⎢ ⎛ ⎝ ⎞ ⎠ ⎤ ⎦ ⎥ ⎫ ⎬ ⎭ ( ) ( ) a = - - a - r r m 1 exp log 0.5 0.4 1 , 2 50 0 1 10 0 1 2 where r50 is measured in arcseconds, and m0 is in magnitudes. 3.3. Summary and Validation of SGA-2020 Data Products The final SGA-2020 sample consists of 383,620 galaxies in the ≈20,000 deg2 LS/DR9 imaging footprint. The final catalog contains precise coordinates; multiwavelength mosaics; model images and photometry from The Tractor; azimuthally averaged optical surface-brightness profiles; aperture photo- metry and radii; and extensive metadata for all galaxies in this sample. In this section, we briefly highlight some of these measurements; for a comprehensive description of the SGA- 2020 data products and how they can be accessed, see Appendix B. Figure 7 shows the celestial positions of the galaxies in the SGA-2020 in an equal-area Mollweide projection. The curved black line represents the Galactic plane, which divides the sample into the North Galactic Cap and SGC imaging regions of the LS/DR9 footprint (see Dey et al. 2019). The total area subtended by the sample is 19,721 deg2 , covering nearly 50% of the sky. In Figure 8, we highlight a handful of the measured SGA- 2020 properties, as well as the relationships between them. In a multivariate corner plot (Foreman-Mackey 2016), we show rR (26), the r-band magnitude within R(26), where R(26) is the semimajor axis at the 26 mag arcsec−2 isophote; [ ( )] ( ) ( ) m p á ñ º + r R 2.5 log 26 r R R , 26 26 10 2 , the average r-band surface brightness within R(26); f is the galaxy position angle (measured counterclockwise from north to east); and ò ≡ 1 − b/a, the galaxy ellipticity, where b/a is the minor-to- major axis ratio. Note the expected strong correlation between R(26) and rR(26), and the anticorrelation between ò and 〈μ〉r,R (26), which is due to the light in more edge-on galaxies being attenuated more by the larger column of internal dust attenuation (famously known as the Holmberg “transparency test”; Holmberg 1958; Giovanelli et al. 1994). In Figure 9, we compare some of the new geometrical measurements in the SGA-2020 against the measurements collated in HyperLeda. In panel (a), we plot Δdecl. versus ΔR.A., the difference in equatorial coordinates. The overall agreement in positions is very good; the median, mean, and ±1σ scatter are 0 3, 0 4, and ±0 5, respectively, although the coordinates of individual (especially irregular and low-surface- brightness) galaxies differ by up to tens of arcseconds. In Figure 10, we show a randomly selected set of 20 galaxies where the central coordinates in the SGA-2020 and HyperLeda differ by more than 3″. Although reasonable algorithms may disagree about the central positions of some galaxies due to dust lanes or the lack of a prominant central bulge (e.g., NGC 4948 = IC 4156 and ESO293-034), it is clear that the coordinates in the SGA-2020 for most of the examples highlighted in Figure 10 are more accurate in measuring the centroid of galaxies with bright cores and the center of light for more diffuse systems, even for very large, well-known galaxies like NGC 4636 = UGC 07878, and NGC 3521 = UGC 06150. Next, in Figure 9(b), we plot DL(25) (defined in Section 2.1) versus D(25), the SGA-2020 major-axis diameter measured at the 25 mag arcsec−2 isophote. Not unexpectedly, we find a strong correlation between the two quantities, although D(25) is ≈20% larger, on average, than DL(25), presumably due to the deeper optical imaging used in the SGA-2020. Finally, in Figures 9(c) and (d), we plot the correlation between position angle, f, and ellipticity, ò, respectively, between HyperLeda and the SGA-2020. For more than 95% of the sample, the agreement between the two f and ò measurements are excellent. Figure 7. Distribution of 383,620 galaxies in the final SGA-2020 sample (to be compared with Figure 3, but note the different color-bar scales). 11 The Astrophysical Journal Supplement Series, 269:3 (25pp), 2023 November Moustakas et al.
  • 12. In order to validate our measurements further, in Figure 11, we compare the SGA-2020 coordinates and mean geometrical measurements against the WISE Extended Source Catalog of the 100 Largest Galaxies (hereafter, WXSC-100; Jarrett et al. 2019).34 Of the 104 galaxies in the WXSC-100 sample, 59 are in the SGA-2020. Note that WISE imaging is less affected by dust extinction and more sensitive to the underlying spatial distribution of the older stellar population compared to our optical imaging, so we do expect some differences in these measurements. Focusing on Figure 11(a) first, we find good overall agreement in the central coordinates: the median, mean, and ±1σ scatter in the coordinate differences are 0 76, 2 3, and ±2 4, respectively, notably smaller than the ≈6″ FWHM WISE W1 PSF (Wright et al. 2010). However, there are some notable outliers, the three largest of which (NGC 0247, NGC 2403, and NGC 4395) have been annotated in the figure. Examining the optical and infrared mosaics of these and other sources in this comparison sample, we find that the differences are due to a combination of a lack of a distinct bright center and, for a handful of cases, errors in the SGA-2020. For example, both NGC 2403 and NGC 0247 are late-type spirals (Hubble type 6 or SABc; see de Vaucouleurs et al. 1991) without a clear, bright nucleus, so the differences are arguably defensible. On the other hand, for NGC 4395 and a handful of other objects, the SGA-2020 central coordinates are likely incorrect (by up to ≈7″) relative to those published in the WSXC-100 (see Section 6 for additional discussion). Turning next to Figure 11(b), we compare D(26) in the SGA-2020 to 2 × RW1 in the WXSC-100; 2 times the radius of the galaxy measured down to an isophotal level of μW1,AB ≈ 25.7 mag arcsec−2 . We find the two sizes to be reasonably well correlated, despite the differences in imaging Figure 8. Multivariate distribution of a subset of measured SGA-2020 galaxy properties. From left to right along the bottom panels, we show rR(26), the r-band magnitude within R(26), where R(26) is the semimajor axis at the 26 mag arcsec−2 isophote; 〈μr,R(26)〉, the mean surface brightness within R(26); f, the galaxy position angle; and ò, the galaxy ellipticity. The contours enclose 50%, 75%, 95%, and 99.5% of the blue points and have been smoothed by a 0.8 pixel Gaussian kernel. 34 https://vislab.idia.ac.za/research-wxsc 12 The Astrophysical Journal Supplement Series, 269:3 (25pp), 2023 November Moustakas et al.
  • 13. effective wavelength, albeit divided into two broad sequences. The sizes of the spirals (Hubble types 2 to 3—Sab to Sb) and later generally follow the one-to-one relation (median difference of −0.004 dex) with a scatter of 0.11 dex (±30%), while the earlier-type, spheroidal galaxies (Hubbles types −5 to 1—E to Sa) are offset to larger sizes in the WXSC-100 by −0.25 dex (≈70%) with a scatter of 0.16 dex (±50%). As discussed by Jarrett et al. (2019), the WISE W1 band is very sensitive to light from evolved stars down to low surface- brightness levels (particularly due to its large pixels, 2 75), so it is not surprising for the WSXC-100 (infrared) diameters to be notably larger than the (optical, r-band) D(26) diameters in the SGA-2020. Moreover, the extended, low-surface-brightness envelopes of massive spheroidal galaxies are especially prone to oversubtraction (e.g., Blanton et al. 2011; Bernardi et al. 2013), which may also be contributing to the systematically smaller sizes of the early-type galaxies in the SGA-2020 relative to the WSXC-100 (see also Section 6). Finally, in Figures 11(c) and (d), we compare the position angles and ellipticities reported in the SGA-2020 and WXSC- 100 catalogs, respectively, and find very good agreement: the mean differences are fSGA − fWXSC = 0° .83 ± 7° .7, and òSGA − òWXSC = 0.017 ± 0.12. 4. Catalog Completeness Quantifying the completeness of the SGA-2020 is difficult because the parent sample is largely defined by HyperLeda (see Section 2.1), which aggregates data from many different surveys—each with their own potentially complicated selection function—from the ultraviolet to the radio. This heterogeneity can be clearly seen in Figure 7 as variations in the sample surface density on both large and small angular scales and between the North Galactic Cap and SGC. Indeed, as we discuss in Section 6, one of the primary goals of the next version of the SGA is to redefine the parent sample using the Figure 9. Comparison of select observed properties reported in HyperLeda against the newly measured quantities in the SGA-2020. (a) Difference in central coordinates; (b) DL(25) vs. D(25), the major-axis diameter measured at the 25 mag arcsec−2 isophote; (c) galaxy position angle, f; and (d) galaxy ellipticity, ò ≡ 1 − b/a, where b/a is the minor-to-major axis ratio. In every panel, the contours enclose 50%, 75%, 95%, and 99.5% of the blue points and have been smoothed by a 0.8 pixel Gaussian kernel. In panels (b), (c), and (d), the solid red line represents the one-to-one relation. 13 The Astrophysical Journal Supplement Series, 269:3 (25pp), 2023 November Moustakas et al.
  • 14. Legacy Surveys imaging itself, in order to begin with a more uniform and quantifiable selection function over the full area. Nevertheless, we can still assess the SGA’s completeness by comparing against existing catalogs that include large angular- diameter galaxies. We choose to characterize the completeness of the SGA- 2020 by comparing against HECATE (version 1.1; Kovlakas et al. 2021).35 HECATE is an all-sky value-added catalog of ≈200,000 galaxies at z < 0.047 (200 Mpc), which contains a breadth of both observed and derived (physical) galaxy properties. Although HECATE also uses HyperLeda to define its parent sample, the comparison is still valuable because the analysis carried out by Kovlakas et al. (2021) is independent of ours, and it includes additional completeness checks against NED and against the local B-band luminosity function. First, from the parent HECATE sample of 204,733 galaxies, we identify 154,093 objects (75%) to be within the LS/DR9 imaging footprint using the LS/DR9 random catalogs, which contain a wealth of information about the imaging data (bandpass coverage, depth, PSF size, etc.) at random positions over the footprint (Myers et al. 2023).36 Specifically, we merge together five random catalogs to achieve an effective source density of 12,500 deg−2 , and conservatively retain all HECATE objects whose center lies within ¢ 2 of one of these points. Next, we remove 2844 galaxies without any size information in HECATE; visually inspecting a random subset of these reveals that they are predominantly small objects, D (25) = 30″, well under the SGA-2020 angular diameter limit (Figure 4). Finally, from the remaining 151,249 objects, we match 95,800 (63%) of them to an object in the SGA-2020 using the HyperLeda PGC number (Paturel et al. 1989; Makarov et al. 2014), which both HECATE and the SGA- 2020 record (where it is defined). We choose to use the PGC designation because the differences in coordinates can be Figure 10. Randomly selected gallery of 20 galaxies where the light-weighted central coordinates measured in the SGA-2020 differ by more than 3″ from the coordinates published in HyperLeda, sorted by increasing DL(25) from the upper left to the lower right. The white bar in the lower left corner of each panel represents 30″, and the blue and red cross-haired ellipses represent the SGA-2020 and HyperLeda positions and mean geometry, respectively. Although the centers of some of these systems are somewhat ambiguous due to dust lanes and other irregular features (e.g., NGC 4607), the SGA-2020 coordinates are generally superior. 35 https://hecate.ia.forth.gr 36 https://www.legacysurvey.org/dr9/files/#random-catalogs-randoms 14 The Astrophysical Journal Supplement Series, 269:3 (25pp), 2023 November Moustakas et al.
  • 15. significant, such that a single matching radius results in a nonnegligible number of false-positives. For example, among the PGC-matched samples, the mean difference in coordinates is 0 50 ± 0 92, but with a tail that extends out to 80″ for IC 2574, a well-known ¢ 18. 7-diameter late-type (SABm) galaxy with no well-defined center. In fact, 126 PGC-matched galaxies have coordinate differences larger than 10″, 90% of which have ( ) > ¢ D 26 1 . Nevertheless, with these caveats in mind, we can still match an additional 178 objects using a 3″ matching radius, resulting in a final matched sample of 95,978 galaxies. In Figure 12, we plot bt-band magnitude versus 2 × R1 for the 154,093 HECATE galaxies, which overlap the LS/DR9 footprint, where R1 is the semimajor axis length reported in HECATE. The dashed red histogram (corresponding to the right-hand axis) shows the raw fraction of matching HECATE- SGA galaxies as a function of galaxy size, in uniform 0.2 dex wide bins of angular diameter between ≈2″ and » ¢ 15.8. The small numbers written above each bin of the histogram report the number of HECATE galaxies in that bin. In addition, the horizontal gray line indicates, for reference, a matching fraction of 100%. Taken at face value, the (raw) matching fractions shown in Figure 12 are surprisingly poor. For example, these results suggest that the SGA-2020 is missing 3%–5% of galaxies with angular diameters between ¢ 2.5 and ¢ 10 and a whopping 20% of the galaxies between ¢ 10 and ¢ 16 . In total, we find 2.94% (367/ 12,487) of the HECATE galaxies with ´ > ¢ R 2 1 1 to be missing from the SGA-2020. To explore this purported incompleteness, we visually inspect the LS/DR9 imaging at the position of the 367 “missing” galaxies and find the following results: 20 objects are Local Group dwarf galaxies, which are intentionally excluded from the SGA-2020 (see Section 2.1); 44 objects fall on the edge of the imaging footprint or other serendipitous (but unfortunate) gaps in three- band (grz) coverage; 64 galaxies are real, but the angular diameters reported in HECATE are overestimated, sometimes by a significant factor; 78 are part of a larger galaxy (e.g., H II regions) and other kinds of photometric shreds; and 24 are entirely spurious. The solid purple histogram in Figure 12 shows the corrected fraction of HECATE-SGA matches after accounting for these errors. In the end, we find that just 137 out of 12,257 (1.12%) HECATE galaxies with ´ > ¢ R 2 1 1 are real and genuinely missing from the SGA-2020. Although the fraction of missing galaxies is relatively low, since both the SGA-2020 and HECATE ultimately originate (in large part) from HyperLeda, it is surprising that any objects are missing from the SGA-2020, especially ones with angular diameters larger than 1′. Although we do not know why these objects do not appear in our parent HyperLeda catalog, we suspect that an issue with the database query may be ultimately responsible (see Appendix A). In any case, we intend to ensure that these and other missing objects serendipitously identified by the SGA team through visual inspection are included in the next version, as we discuss in Section 6. Figure 11. Comparison of the (a) central coordinates; (b) diameters; (c) position angles, f; and (d) ellipticities, ò measured in the SGA-2020 against those reported in the WXSC-100 (Jarrett et al. 2019) for an overlapping sample of 59 galaxies. Individual galaxies are color coded by numerical Hubble type, from −5 (E) to 9 (Irr) (see de Vaucouleurs et al. 1991), as indicated by the color bar. See the text in Section 3.3 for the definition of the diameter measured in the WXSC-100 catalog and a detailed discussion of the observed trends. 15 The Astrophysical Journal Supplement Series, 269:3 (25pp), 2023 November Moustakas et al.
  • 16. What about the completeness of the SGA-2020 among smaller angular-diameter galaxies,  ´ < ¢  R 25 2 1 1 ? According to Figure 12, the completeness remains relatively high, above ≈90%. However, our analysis of the > ¢ 1 -diameter galaxies reveals that more than half of the HECATE objects missing from the SGA-2020 either have incorrect (or overestimated) diameters, or are spurious, and we have checked that these and other effects increase steeply with decreasing angular diameter (see, for example, Figure 2). Therefore, we conclude that the SGA-2020 completeness is likely 95% for galaxies with angular diameters between ≈25″ and ¢ 1 . None of this discussion, of course, addresses the surface- brightness incompleteness of the sample, since both HECATE and the SGA-2020 inherit whatever incompletenesses and heterogeneities are present in HyperLeda, which aggregates data from many different surveys. For example, regions of the sky that have been imaged by the SDSS (Strauss et al. 2002; Blanton et al. 2011) or DES (Dark Energy Survey Collaboration et al. 2016; Abbott et al. 2021) have uniform, deep optical imaging (μr,50 < 24.5 and μr < 25.6 mag arcsec−2 in the SDSS and DES, respectively, where μr,50 is the r-band half-light surface brightness, and the DES surface brightness is measured in a 1 95 diameter aperture), but these surveys cover just 34% (SDSS; 14,000 deg2 ) and 12% (DES; 5000 deg2 ) of the sky. Other optical and near-infrared surveys like 2MASS (Jarrett et al. 2000; Skrutskie et al. 2006) and Pan-STARRS1 (PS1; Chambers et al. 2016) cover all or nearly all of the sky (100% and 75% for 2MASS and PS1, respectively); however, 2MASS is relatively shallow compared to these other surveys (μr ≈ 22.7 mag arcsec−2 assuming a median r − Ks ≈ 2.7 color for low-redshift galaxies; Jarrett et al. 2019) while the photometry of bright, large angular-diameter galaxies in PS1 is known to be problematic (Magnier et al. 2020; Makarov et al. 2022). In other words, it is difficult to fully assess the incompleteness of the SGA-2020 given the variations in the completeness of the surveys that contribute to HyperLeda. Nevertheless, we can still make some quantitative statements using the results shown in Figure 8 and the comparisons with HECATE, above. Based on the correlation between the mean surface brightness, 〈μr,R(26)〉, and the apparent brightness within the 26 mag arcsec−2 isophote, rR(26), we conclude that the SGA-2020 is approximately 95% complete for galaxies with R(26)  25″, rR(26)  18, and 〈μr,R(26)〉  26 mag arcsec−2 ; in addition, the SGA-2020 is more than 99% complete for galaxies larger than ¢ 1 and brighter than rR(26)  16 down to the same surface-brightness limit. 5. Scientific Applications As discussed in the Introduction, atlases of large angular- diameter galaxies have played a pivotal role in observational cosmology and in our modern understanding of galaxy astrophysics and the galaxy–halo connection. By delivering a carefully constructed catalog of known “large” galaxies with new deep optical and infrared imaging from the DESI Legacy Imaging Surveys, we anticipate the SGA-2020 to play a commensurately high-impact role in a wide range of observational studies of large, nearby, well-resolved galaxies. The growing spectroscopic data set from DESI is an especially powerful complement to the SGA-2020. As discussed in Section 1.2, DESI is targeting the SGA-2020 sample over 14,000 deg2 (70% of the LS/DR9 footprint) as part of the flux-limited (r < 20.175) BGS (Hahn et al. 2023).37 In addition to providing precise spectroscopic redshifts, the spectral coverage (3600–9800 Å), instrumental resolution ( – »  2000 5000), and spectrophotometric precision (±2%) of the DESI spectra (Abareshi et al. 2022; Guy et al. 2023) will yield important insights into the physical conditions and stellar Figure 12. bt-band magnitude vs. 2 × R1 for 154,093 objects in the HECATE value-added galaxy catalog (Kovlakas et al. 2021), which lie within the LS/DR9 imaging footprint, where R1 is the semimajor axis length in HECATE. For reference, the contours enclose 10%, 25%, 50%, 75%, 95%, and 99% of the points. The dashed-red and solid purple histograms (corresponding to the right-hand vertical axis) represent, respectively, the raw and corrected fraction of HECATE galaxies, which match a source in the SGA-2020 galaxy as a function of angular diameter. Finally, the small numbers written above each bin of the histograms report the number of HECATE galaxies in that 0.2 dex wide bin. 37 In detail, BGS is observing all galaxies brighter than r = 19.5 (BGS Bright) and a color-selected subset of galaxies with 19.5 < r < 20.175 (BGS Faint); the color selection is tuned to ensure good redshift success at this flux level in bright sky conditions. 16 The Astrophysical Journal Supplement Series, 269:3 (25pp), 2023 November Moustakas et al.
  • 17. populations of the central regions of these systems (for recent reviews, see Conroy 2013; Kewley et al. 2019; Sánchez 2020, and references therein). Figure 13 illustrates the tremendous scale of the DESI data set. Although the majority of galaxies in the SGA-2020 have previously measured redshifts in HyperLeda (264,865 galaxies, or approximately 70% of the sample), these redshifts come from a wide range of different surveys spanning many decades. By the end of its 5 year Main Survey (2021–2026), DESI will produce a homogeneous, high-precision spectrophotometric data set for more than 300,000 SGA-2020 targets over 14,000 deg2 as part of a larger sample of approximately 14 million BGS targets and more than 25 million fainter extragalactic targets (DESI Collaboration et al. 2023b; Myers et al. 2023). Indeed, in its 2023 June Early Data Release (EDR), DESI has already delivered high-quality spectroscopy for nearly 7700 SGA-2020 targets, which were observed during the DESI Survey Validation period (DESI Collaboration et al. 2023a).38 In addition to these Main Survey observations, one of the especially exciting and synergistic secondary DESI programs is the Peculiar Velocity survey (Saulder et al. 2023).39 This program aims to use the fundamental plane and Tully–Fisher relations as direct distance indicators in order to map the peculiar-velocity field at z < 0.15; this map will be used to place new, stringent constraints on the cosmological parameters and the growth of large-scale structure (e.g., Strauss & Willick 1995). As part of this effort, galaxies in the SGA-2020 are being targeted not only in their bright nucleus but also at various positions along their major axis and other “off-center” positions (Saulder et al. 2023; K. A. Douglass et al. 2023, in preparation). Together with the central spectra, these data will help constrain the total (dynamical) masses and physical conditions in a sample of tens of thousands of SGA-2020 galaxies. The SGA-2020 also has the potential to support the growing number of time-domain and multimessenger astronomical discoveries, wherein the observations of transient astrophysical events are detected by one or more messenger particles (electromagnetic radiation, neutrinos, cosmic rays, and gravitational waves; e.g., Neronov 2021). In the case of gravitational wave events, for example, identifying the host galaxy and, ideally, the electromagnetic counterparts of these events is extremely challenging due to the significant positional error ellipse of gravitational wave observations, 100 deg2 (Gehrels et al. 2016; Abbott et al. 2020). Statistically complete catalogs of large, nearby galaxies with accurate coordinates, size information, and multiband photometry like the SGA-2020 are needed to help identify the most likely source of gravitational wave events (e.g., Gehrels et al. 2016; Ducoin et al. 2020; Kovlakas et al. 2021). Finally, we highlight one other area where the SGA-2020 is playing an important ancillarly role. The SGA-2020 is being used as a foreground angular mask for all the DESI dark-time cosmological tracers: luminous red galaxies (LRGs; Zhou et al. 2023); emission-line galaxies (ELGs; Raichoor et al. 2023); and quasars (QSOs; Chaussidon et al. 2023). Like bright stars, large angular-diameter galaxies can bias the small-scale clustering signal in cosmological analyses because photometric pipelines tend to shred structurally resolved galaxies into many smaller sources. Similarly, the same angular mask can be used as an external input when building photometric catalogs from other imaging data; for example, an early version of the SGA- 2020 was used to maximize the purity of the 3–5 μm unWISE photometric catalog of 2 billion infrared sources (Schlafly et al. 2019). In other words, by providing a high-quality geometric mask, the SGA-2020 is helping these and other observational programs fulfill their scientific promise. 6. Summary and Future Work We present the 2020 version of the SGA, SGA-2020, a multiwavelength optical and infrared imaging atlas of 383,620 large angular-diameter galaxies covering ≈20,000 deg2 .40 The SGA-2020 contains precise coordinates; optical (grz) and WISE/W1 through W4 (3.4–22 μm) infrared mosaics; model images and photometry based on the state-of-the-art image modeling code, The Tractor; azimuthally averaged grz surface-brightness and color profiles; elliptical curves of growth and half-light radii; and extensive ancillary information Figure 13. Left: celestial distribution of galaxies in the SGA-2020, which are also DESI targets (color bar) covering ≈14,000 deg2 (Myers et al. 2023) compared to the full ≈20,000 deg2 footprint of the SGA-2020 (dark gray region in the SGC). Right: redshift distribution of galaxies in the SGA-2020 with existing spectroscopic redshifts from HyperLeda (blue histogram) and from the DESI Early Data Release (EDR; orange histogram). The legend in this figure also indicates the approximate final number of SGA-2020 galaxies that DESI will observe by the end of the 5 year Main Survey. 38 https://data.desi.lbl.gov/doc/releases/edr 39 Secondary programs are bespoke scientific programs, which utilize whatever spare fibers may be available in a given DESI tile or pointing of ∼5000 fibers (see Myers et al. 2023 for details). 40 Excluding the highest regions of dust extinction in the Galactic plane, |b| > 20°, the SGA-2020 covers 74% of the available ≈27,200 deg2 of extragalactic sky. 17 The Astrophysical Journal Supplement Series, 269:3 (25pp), 2023 November Moustakas et al.
  • 18. for the full sample. The complete SGA-2020 can be accessed through the dedicated web portal, https://sga. legacysurvey.org. Our measurements of the central coordinates, isophotal diameters, ellipticities, and position angles show overall good agreement with published measurements collated in the HyperLeda extragalactic database and in the WISE Extended Source Catalog of the 100 Largest Galaxies (WXSC-100; Jarrett et al. 2019). Disagreements in these quantities between the SGA-2020 and HyperLeda are generally due to erroneous measurements in HyperLeda; however, the comparison with WXSC-100 identifies small but notable (≈few arcsecond) errors in the SGA-2020 coordinates for some of the largest (> ¢ 5 ) galaxies in the sample. We evaluate the completeness of the SGA-2020 by comparing against the HECATE all-sky, value-added galaxy catalog (Kovlakas et al. 2021). We find that the SGA-2020 is missing approximately 1% of known galaxies larger than 1′ and ≈5% of galaxies between 25″ and1′; however, we compute these statistics only after determining (through visual inspection) that nearly 30% of the sources larger than1′ in HECATE that are missing from the SGA-2020 are either spurious or photometric shreds. Overall, we estimate that the SGA-2020 is more than 95% complete for galaxies larger than R(26) ≈ 25″ and r < 18 measured at the 26 mag arcsec−2 isophote in the r band. We discuss some of the potential scientific applications of the SGA-2020 and highlight the ongoing amassing of high- quality optical spectrophotometry from the DESI (DESI Collaboration et al. 2023b) survey. Approximately 70% of the SGA-2020 sample lies within the 14,000 deg2 DESI footprint and is being targeted as part of the BGS (Hahn et al. 2023). To date, 7700 DESI spectra of SGA-2020 galaxies are publicly available as part of the DESI EDR (DESI Collaboration et al. 2023a), representing less than 3% of the final sample. In addition, the DESI Peculiar Velocity secondary program (Saulder et al. 2023) is obtaining tens of thousands of major-axis, minor-axis, and other off-center spectra of SGA- 2020 galaxies in order to constrain the peculiar-velocity field at z < 0.15, further enhancing the scientific impact of the SGA- 2020. Finally, we highlight the potential impact of the SGA- 2020 for identifying the electromagnetic counterparts of time- domain and multimessenger astronomical events. We conclude by discussing some of the planned improve- ments of the SGA. Future versions will focus on four broad areas, listed here in no particular order: 1. Completeness. As discussed in Section 4, the SGA-2020 inherits the heterogeneity and incompleteness of the parent HyperLeda sample. To mitigate these issues, we intend to build a new parent sample of candidate large angular-diameter galaxies by detecting them from the Legacy Surveys imaging data themselves using a combination of traditional source-detection techniques (e.g., convolution kernels optimized for detecting large galaxies) and one or more state-of-the-art deep-learning techniques (e.g., Stein et al. 2022; Zaritsky et al. 2023). By inserting artificially generated galaxies of varying size, integrated flux, and surface brightness into the data, we intend to quantify the completeness limits of the sample as a function of these observational quantities. 2. Centroiding and masking. Another area of improvement is how the SGA pipeline handles mergers and other systems with two or more close companions (e.g., in dense cluster environments like the Coma Cluster), as well as galaxies near bright stars. Evaluating and optimizing the performance of the pipeline in these circumstances will be part of a larger visual inspection effort (e.g., Walmsley et al. 2022) to ensure that the central coordinates of the largest galaxies in the SGA- 2020 are accurate (or at least defensible, in the case of galaxies with irregular morphologies) compared with previous independent measurements (e.g., see the discussion in Section 3.3). 3. Background subtraction. As discussed in Section 3.2.1, aggressive subtraction of the Mosaic-3 pattern-noise significantly impacts the z-band photometry of the SGA- 2020 galaxies in the northern (BASS+MzLS) portion of the footprint, decl.  32°, including some of the most famous and largest angular-diameter galaxies in the sample like NGC 5194 = M51a and NGC 5457 = M101. Moreover, we show in Section 3.3 that the outer envelopes of the early-type, spheroidal galaxies in the atlas have likely been oversubtracted, thereby biasing their surface- brightness profiles and inferred isophotal diameters. We intend to address both these issues in a future version of the SGA (see, for example, Li et al. 2022 for a new sky- subtraction technique, which addresses the latter issue). 4. Extensions in footprint and wavelength. Since the SGA- 2020 was finalized, thousands of square degrees of additional DECam imaging have been acquired; we intend to use these data to extend the SGA footprint.41 In addition, in the next version of the SGA, we intend to (1) include DECam i-band imaging, which is available for more than 15,000 deg2 of area; (2) regenerate the unWISE coadds but also add ultraviolet (1528 and 2271 Å) coadds from the GALEX (Martin et al. 2005; Morrissey et al. 2005), where GALEX data are available; and (3) measure the surface-brightness profiles in all the available bandpasses from 0.15 to 22 μm. These additional measurements will further increase the scientific impact and long-term legacy value of the SGA. Finally, future version of the SGA will also include ancillary spectroscopic redshifts and spectrophotometric measurements from DESI and, eventually, a wide range of physical properties (stellar masses, star formation rates, etc.) derived using state-of- the-art spectral energy distribution modeling (e.g., Leja et al. 2017). Acknowledgments We gratefully acknowledge specific contributions and thoughtful feedback from Michael Blanton, Yao-Yuan Mao, and Kevin Napier, and from former Siena College under- graduate students Alissa Ronca and Luis Villa, who contributed to an early version of the SGA web-application. In addition, we thank Mara Salvato and the anonymous referee for helpful comments on the manuscript. J.M. gratefully acknowledges funding support from the U.S. Department of Energy, Office of Science, Office of High Energy Physics under award No. DE-SC0020086 and from the National Science Foundation under grant AST-1616414. A.D. M. was supported by the U.S. Department of Energy, Office of 41 See, e.g., https://www.legacysurvey.org/dr10. 18 The Astrophysical Journal Supplement Series, 269:3 (25pp), 2023 November Moustakas et al.
  • 19. Science, Office of High Energy Physics, under award No. DE- SC0019022. A.D., S.J., and B.A.W.’s research activities are supported by the NSF’s NOIRLab, which is managed by the Association of Universities for Research in Astronomy (AURA) under a cooperative agreement with the National Science Foundation. We acknowledge the use of the HyperLeda database, and we are especially grateful for the time and expertise contributed by Dmitry Makarov to this project. This research has also made extensive use of the NASA/IPAC Extragalactic Database (NED), which is funded by the National Aeronautics and Space Administration and operated by the California Institute of Technology; NASAʼs Astrophysics Data System; and the arXiv preprint server. The Legacy Surveys consist of three individual and complementary projects: the Dark Energy Camera Legacy Survey (DECaLS; Proposal ID #2014B-0404; PIs: David Schlegel and Arjun Dey), the Beijing-Arizona Sky Survey (BASS; NOAO Prop. ID #2015A-0801; PIs: Zhou Xu and Xiaohui Fan), and the Mayall z-band Legacy Survey (MzLS; Prop. ID #2016A-0453; PI: Arjun Dey). DECaLS, BASS, and MzLS together include data obtained, respectively, at the Blanco telescope, Cerro Tololo Inter-American Observatory, NSFʼs NOIRLab; the Bok telescope, Steward Observatory, University of Arizona; and the Mayall telescope, Kitt Peak National Observatory, NOIRLab. The Legacy Surveys project is honored to be permitted to conduct astronomical research on Iolkam Du’ag (Kitt Peak), a mountain with particular significance to the Tohono O’odham Nation. NOIRLab is operated by the Association of Universities for Research in Astronomy (AURA) under a cooperative agreement with the National Science Foundation. This project used data obtained with the Dark Energy Camera (DECam), which was constructed by the Dark Energy Survey (DES) collaboration. Funding for the DES Projects has been provided by the U.S. Department of Energy, the U.S. National Science Foundation, the Ministry of Science and Education of Spain, the Science and Technology Facilities Council of the United Kingdom, the Higher Education Funding Council for England, the National Center for Supercomputing Applications at the University of Illinois at Urbana-Champaign, the Kavli Institute of Cosmological Physics at the University of Chicago, Center for Cosmology and Astro-Particle Physics at the Ohio State University, the Mitchell Institute for Funda- mental Physics and Astronomy at Texas A&M University, Financiadora de Estudos e Projetos, Fundacao Carlos Chagas Filho de Amparo, Financiadora de Estudos e Projetos, Fundacao Carlos Chagas Filho de Amparo a Pesquisa do Estado do Rio de Janeiro, Conselho Nacional de Desenvolvi- mento Cientifico e Tecnologico and the Ministerio da Ciencia, Tecnologia e Inovacao, the Deutsche Forschungsgemeinschaft, and the Collaborating Institutions in the Dark Energy Survey. The Collaborating Institutions are Argonne National Labora- tory, the University of California at Santa Cruz, the University of Cambridge, Centro de Investigaciones Energeticas, Med- ioambientales y Tecnologicas-Madrid, the University of Chicago, University College London, the DES-Brazil Con- sortium, the University of Edinburgh, the Eidgenossische Technische Hochschule (ETH) Zurich, Fermi National Accelerator Laboratory, the University of Illinois at Urbana- Champaign, the Institut de Ciencies de l’Espai (IEEC/CSIC), the Institut de Fisica d’Altes Energies, Lawrence Berkeley National Laboratory, the Ludwig Maximilians Universitat Munchen and the associated Excellence Cluster Universe, the University of Michigan, NSFʼs NOIRLab, the University of Nottingham, the Ohio State University, the University of Pennsylvania, the University of Portsmouth, SLAC National Accelerator Laboratory, Stanford University, the University of Sussex, and Texas A&M University. BASS is a key project of the Telescope Access Program (TAP), which has been funded by the National Astronomical Observatories of China, the Chinese Academy of Sciences (the Strategic Priority Research Program “The Emergence of Cosmological Structures” grant No. XDB09000000), and the Special Fund for Astronomy from the Ministry of Finance. The BASS is also supported by the External Cooperation Program of Chinese Academy of Sciences (grant No. 114A11KYSB20160057), and Chinese National Natural Science Foundation (grant No. 11433005). The Legacy Survey team makes use of data products from the Near-Earth Object Wide-field Infrared Survey Explorer (NEOWISE), which is a project of the Jet Propulsion Laboratory/California Institute of Technology. NEOWISE is funded by the National Aeronautics and Space Administration. The Legacy Surveys imaging of the DESI footprint is supported by the Director, Office of Science, Office of High Energy Physics of the U.S. Department of Energy under contract No. DE-AC02-05CH1123, by the National Energy Research Scientific Computing Center, a Department of Energy Office of Science User Facility under the same contract; and by the U.S. National Science Foundation, Division of Astronom- ical Sciences under contract No. AST-0950945 to NOAO. Software: Astropy (Astropy Collaboration et al. 2013, 2018, 2022), corner.py (Foreman-Mackey 2016), healpy (Zonca et al. 2019), NumPy (Harris et al. 2020), Matplotlib (Hunter 2007), Photutils (Bradley 2023), PyDL (Weaver et al. 2019), scipy (Virtanen et al. 2020), seaborn (Waskom 2021). Appendix A HyperLeda Database Query In Section 2.1, we present our procedure for building the SGA-2020 parent sample, which begins with a HyperLeda database query. For the purposes of reproducibility, this appendix documents the exact query we execute on the 2018 November 14 version of the HyperLeda database, which results in a catalog of 1,436,176 galaxies: WITH "R50" AS ( SELECT pgc, avg(lax) AS lax, avg(sax) AS sax FROM rawdia WHERE quality=0 and dcode=5 and band between 4400 and 4499 GROUP BY pgc ), "IR" AS ( SELECT pgc, avg(lax) AS lax, avg(sax) AS sax FROM rawdia WHERE quality=0 and iref in (27129) and dcode=7 and band=0 GROUP BY pgc ) SELECT 19 The Astrophysical Journal Supplement Series, 269:3 (25pp), 2023 November Moustakas et al.
  • 20. m.pgc, m.objname, m.objtype, m.al2000, m. de2000, m.type, m.bar, m.ring, m.multiple, m.compactness, m.t, m.logd25, m.logr25, m.pa, m.bt, m.it, m.kt, m.v, m. modbest, "R50".lax, "R50".sax, "IR".lax, "IR".sax, FROM m000 AS m LEFT JOIN "R50" USING (pgc) LEFT JOIN "IR" USING (pgc) WHERE objtype=’G’ and (m.logd25>0.2 or "R50". lax>0.2 or "IR".lax>0.2) Appendix B Data Products and Data Access In this appendix, we define the data model for the SGA-2020 data products and describe how all the data can be accessed. All the input imaging data used to construct the SGA-2020, including the 6 year unWISE image stacks, are publicly accessible through https://www.legacysurvey.org. The SGA-2020 data themselves can be retrieved through the SGA-2020 Data Portal at https://sga. legacysurvey.org. This portal provides a searchable database for retrieving data and visualizations for individual galaxies, as well as bulk-download access to the full data set. For example, the following link will navigate directly to the beautiful face-on spiral (Hubble type SABc) NGC 2532: https://sga.legacysurvey.org/ group/NGC2532. In addition, the data can be accessed (and cross-referenced against a growing number of additional data sets, including DESI) through NSF’s NOIRLab Astro Data Lab at https://datalab.noirlab.edu/sga.php. Finally, one can interactively explore the sample in the Legacy Surveys imaging footprint via the SGA layer of the Legacy Surveys Viewer; for example, the following link will navigate to the position of NGC 2532 in the North Galactic Cap: https://legacysurvey.org/viewer?ra=122. 5638&dec=33.9568&layer=ls-dr9&zoom=13&sga. Most users will be interested in the SGA-2020.fits file, a multiextension FITS catalog, which contains detailed informa- tion for all 383,620 galaxies in the SGA-2020. Table 1 summarizes the contents of this file, and Table 2 contains a detailed description of the ELLIPSE header and/or data unit (HDU). In addition, Table 3 defines the ELLIPSEBIT bit- masks, which record issues associated with the ellipse fitting and surface-brightness profile modeling, if any. Furthermore, for each galaxy group in the atlas (i.e., each row in the SGA-2020.fits catalog where GROUP_ PRIMARY is True), we generate the set of files summarized in Table 4 (see also Section 3.2), which include the individual multiwavelength mosaics, Tractor catalogs, surface-bright- ness profiles, and other key data products. These files are organized into the directory structure RASLICE/GROUP_ NAME, where GROUP_NAME is the name of the galaxy group (see Section 2.2), and RASLICE, which ranges between 000 and 359, is the 1° wide slice of the sky that the object belongs to. Specifically, in Python, RASLICE=":03d".format(GROUP_RA) Finally, Table 5 documents the data model of the ellipse-fitting and surface-brightness-profile results for each individual galaxy in the SGA-2020. Table 1 SGA-2020.fits File Contents Extension Data Model Number Name Documentation Description HDU01 ELLIPSE Table 2 Sample metadata and ellipse- fitting results. HDU02 TRACTOR LS/DR9 websitea The Tractor fitting results.b Notes. Catalog containing the principal measurements for all 383,620 galaxies in the SGA-2020 as a multiextension FITS file with two row-matched header and/or data units (HDUs). a https://www.legacysurvey.org/dr9/catalogs b This table also includes SGA_ID (see Table 2) to facilitate crossmatching. 20 The Astrophysical Journal Supplement Series, 269:3 (25pp), 2023 November Moustakas et al.
  • 21. Table 2 ELLIPSE HDU Data Model Column Name Units Description SGA_ID L Unique integer identifier. SGA_GALAXY L SGA galaxy name, constructed as “SGA-2020-SGA_ID.” GALAXY L Unique galaxy name. PGCa L Unique identifier from the Principal Catalogue of Galaxies. RA_LEDA degree R.A. (J2000) from the reference indicated in REF. DEC_LEDA degree Decl. (J2000) from the reference indicated in REF. MORPHTYPE L Visual morphological type from HyperLeda (if available). PA_LEDA degree Galaxy position angle (measured east of north); taken from the reference indicated in REF. D25_LEDA arcminute Major-axis diameter at the 25 mag arcsec−2 (optical) surface-brightness isophote; taken from the reference indicated in REF. BA_LEDA L Ratio of the semiminor axis to the semimajor axis; taken from the reference indicated in REF. Z_LEDAa L Heliocentric redshift from HyperLeda. SB_D25_LEDA Vega mag arcsec−2 Mean surface brightness based on D25_LEDA and MAG_LEDA. MAG_LEDAb Vega mag Apparent bt-band magnitude. BYHAND L Boolean flag indicating whether one or more of RA_LEDA, DEC_LEDA, D25_LEDA, PA_LEDA, BA_LEDA, or MAG_LEDA were changed from their published values (usually via visual inspection) while building the parent sample. REF L Reference indicating the origin of the object (see Section 2): LEDA-20181114, LGDWARFS, RC3, OpenNGC, or DR8. GROUP_ID L Unique group identification number. GROUP_NAME L Group name, constructed from the name of its largest member (see Section 2.2). For isolated galaxies, identical to GALAXY. GROUP_MULT L Number of group members (i.e., group multiplicity). GROUP_PRIMARY L Boolean flag indicating the primary (i.e., largest) group member. GROUP_RA degree Mean R.A. of the group weighted by D25_LEDA. GROUP_DEC degree Mean decl. of the group weighted by D25_LEDA. GROUP_DIAMETER arcminute Approximate group diameter (see Section 2.2). BRICKNAME L Name of custom Tractor “brick,” encoding the sky position, e.g., “1126p222” is centered on R. A. = 112.6, decl. = +22.2. RA degree R.A. (J2000) based on The Tractor model fit. DEC degree Decl. (J2000) based on The Tractor model fit. D26 arcminute Major axis diameter at the μ = 26 mag arcsec−2 r-band isophote. D26_REFc L Reference indicating the origin of the DIAM measurement: SB26, SB25, or LEDA. PA degree Galaxy position angle (measured east of north), as measured from the ellipse moments (see Section 3.2.3) (or equivalent to PA_LEDA if the ellipse moments could not be measured). BA L Minor-to-major axis ratio, as measured from the ellipse moments (or equivalent to BA_LEDA if the ellipse moments could not be measured). RA_MOMENT degree Light-weighted R.A. (J2000), as measured from the ellipse moments. Equivalent to RA_X0 in Table 5 but set to RA_LEDA if ellipse fitting failed or was not carried out. DEC_MOMENT degree Like RA_MOMENT but for the decl. axis. SMA_MOMENTd arcsecond Second moment of the light distribution along the major axis based on the measured ellipse moments. Equivalent to MAJORAXIS in Table 5 but converted to arcseconds. 〈grz〉_SMA50d arcsecond Half-light semimajor axis length based on Equation (2). SMA_SB〈sblevel〉d arcsecond Semimajor axis length at the r-band 〈sblevel〉 mag arcsec−2 isophote. 〈grz〉_MAG_SB〈sblevel〉d AB mag Cumulative brightness measured within SMA_SB〈sblevel〉. 〈grz〉_MAG_SB〈sblevel〉_ERRd AB mag 1σ uncertainty in 〈grz〉_MAG_SB〈sblevel〉. 〈grz〉_COG_PARAMS_MTOTd AB mag Best-fitting curve-of-growth parameter m1 from Equation (1). 〈grz〉_COG_PARAMS_M0d AB mag Best-fitting curve-of-growth parameter m0 from Equation (1). 〈grz〉_COG_PARAMS_ALPHA1d L Best-fitting curve-of-growth parameter α1 from Equation (1). 〈grz〉_COG_PARAMS_ALPHA2d L Best-fitting curve-of-growth parameter α2 from Equation (1). 〈grz〉_COG_PARAMS_CHI2d L χ2 of the fit to the curve of growth (see Section 3.2.3). ELLIPSEBIT L See Table 3. Notes. ELLIPSE HDU of the SGA-2020.fits merged catalog defined in Table 1. In this table, 〈grz〉 denotes the g-, r-, or z-band filter; 〈wise〉 denotes the W1-, W2-, W3-, or W4 bandpass; and 〈sblevel〉 represents the 22, 22.5, 23, 23.5, 24, 24.5, 25, 25.5, and 26 mag arcsec−2 isophote. a Missing values are represented with a −1. For some quantities (e.g., PGC or Z_LEDA), a missing value does not necessarily mean that that value does not exist. b This magnitude estimate is heterogeneous in both bandpass and aperture but, for most galaxies, it is measured in the B band; use with care. c By default, we infer D26 from SMA_SB26. However, if the r-band surface-brightness profile could not be measured at this level, we estimate D26 as 2.5 × SMA_SB25 or 1.5 × D25_LEDA, in that order of priority. d If ellipse-fitting or curve-of-growth modeling failed or was not attempted, then these columns’ values are −1. 21 The Astrophysical Journal Supplement Series, 269:3 (25pp), 2023 November Moustakas et al.
  • 22. Table 3 Ellipse-fitting Bitmasks Bit Number Bit Name Definition 0 L Not used; ignore. 1 REX_TOOSMALL Ellipse fit skipped; galaxy classified as too-small type REX. 2 NOTREX_TOOSMALL Ellipse fit skipped; galaxy classified as too-small type EXP, DEV, or SER. 3 FAILED Ellipse fitting was attempted but failed. 4 NOTFIT Ellipse fitting was not attempted. 5 REJECTED Ellipse-fitting results were rejected based on visual inspection. Note. Bitmask encoding various reasons why ellipse fitting failed or was not attempted; see Section 3.2.3 for additional details. Table 4 Images and Catalogs Filename Description GROUP_NAME-ccds-〈region〉.fits CCDs contributing to the optical image stacks. GROUP_NAME-largegalaxy-blobs.fits.gz Enumerated segmentation (“blob”) image. GROUP_NAME-largegalaxy-tractor.fits Tractor catalog of all detected sources in the field. GROUP_NAME-largegalaxy-maskbits.fits.fz Image encoding the LS/DR9 bitmasksa contributing to each pixel. GROUP_NAME-largegalaxy-outlier-mask.fits.fz Image of pixels rejected during outlier masking. GROUP_NAME-depth-〈grz〉.fits.fz Image of the 5σ point-source depth at each pixel. GROUP_NAME-largegalaxy-psf-〈grz〉.fits.fz Postage stamp of the inverse-variance weighted mean pixelized PSF at the center of the field. GROUP_NAME-largegalaxy-image-〈grz〉.fits.fz Inverse-variance weighted optical image. GROUP_NAME-largegalaxy-invvar-〈grz〉.fits.fz Optical inverse variance image stack. GROUP_NAME-largegalaxy-model-〈grz〉.fits.fz Optical Tractor model image coadd. GROUP_NAME-largegalaxy-image-grz.jpg Color (grz) JPG image of the image stack. GROUP_NAME-largegalaxy-model-grz.jpg Color (grz) JPG image of The Tractor model image. GROUP_NAME-largegalaxy-resid-grz.jpg Color (grz) JPG image of residual (data minus model) image. GROUP_NAME-image-〈wise〉.fits.fz Inverse-variance weighted infrared image stack. GROUP_NAME-invvar-〈wise〉.fits.fz Infrared inverse variance image stack. GROUP_NAME-largegalaxy-model-〈wise〉.fits.fz Infrared Tractor model image coadd. GROUP_NAME-image-W1W2.jpg Color (W1W2) JPG image of the image stack. GROUP_NAME-model-W1W2.jpg Color (W1W2) JPG image of The Tractor model image. GROUP_NAME-largegalaxy-sample.fits Catalog of one or more galaxies from the parent sample in this group. GROUP_NAME-largegalaxy-SGA_ID-ellipse.fitsb Detailed ellipse-fitting results for each galaxy in this group; see Table 5 for the data model. GROUP_NAME-coadds.log Log output for the coadds stage of the SGA pipeline. GROUP_NAME-ellipse.log Log output for the ellipse stage of the SGA pipeline. Notes. Summary of files generated for each galaxy group in the SGA-2020. In this table, 〈region〉 denotes either north for BASS/MzLS or south for DECaLS; 〈grz〉 denotes the g-, r-, or z-band filter; and 〈wise〉 denotes the W1-, W2-, W3-, or W4 bandpass. a https://www.legacysurvey.org/dr9/bitmasks b This file may be missing (for the galaxy of a given SGA_ID) if ellipse fitting fails or is not carried out. Table 5 Ellipse-fitting Data Model Column Name Units Description SGA_ID L See Table 2. GALAXY L See Table 2. RA degree See Table 2. DEC degree See Table 2. PGC L See Table 2. PA_LEDA degree See Table 2. BA_LEDA L See Table 2. D25_LEDA arcminute See Table 2. BANDS L List of bandpasses fitted (here, always grz). REFBAND L Reference band (here, always r). REFPIXSCALE arcsec pixel−1 Pixel scale in REFBAND. SUCCESS L Flag indicating ellipse-fitting success or failure. FITGEOMETRY L Flag indicating whether the ellipse geometry was allowed to vary with semimajor axis (here, always False). INPUT_ELLIPSE L Flag indicating whether ellipse parameters were passed from an external file (here, always False). LARGESHIFT L Flag indicating that the light-weighted center (from ellipse moments) is different from The Tractor position by more than 10 pixels in either dimension, in which case we adopt The Tractor model position. 22 The Astrophysical Journal Supplement Series, 269:3 (25pp), 2023 November Moustakas et al.