Identification of transitional disks in Chamaeleon with Herschel

Context. Transitional disks are circumstellar disks with inner holes that in some cases are produced by planets and/or substellar companions in these systems. For this reason, these disks are extremely important for the study of planetary system formation. Aims. The Herschel Space Observatory provides an unique opportunity for studying the outer regions of protoplanetary disks. In this work we update previous knowledge on the transitional disks in the Chamaeleon I and II regions with data from the Herschel Gould Belt Survey. Methods. We propose a new method for transitional disk classification based on the WISE 12 µm − PACS 70 µm color, together with inspection of the Herschel images. We applied this method to the population of Class II sources in the Chamaeleon region and studied the spectral energy distributions of the transitional disks in the sample. We also built the median spectral energy distribution of Class II objects in these regions for comparison with transitional disks. Results. The proposed method allows a clear separation of the known transitional disks from the Class II sources. We find six transitional disks, all previously known, and identify five objects previously thought to be transitional as possibly non-transitional. We find higher fluxes at the PACS wavelengths in the sample of transitional disks than those of Class II objects. Conclusions. We show the Herschel 70 µm band to be a robust and efficient tool for transitional disk identification. The sensitivity and spatial resolution of Herschel reveals a significant contamination level among the previously identified transitional disk candidates for the two regions, which calls for a revision of previous samples of transitional disks in other regions. The systematic excess found at the PACS bands could be either a result of the mechanism that produces the transitional phase, or an indication of different evolutionary paths for transitional disks and Class II sources

Recommended
Recommended
More Related Content
What's hot
What's hot (20)
Similar to Identification of transitional disks in Chamaeleon with Herschel
Similar to Identification of transitional disks in Chamaeleon with Herschel (20)
More from Sérgio Sacani
More from Sérgio Sacani (20)
Recently uploaded
Recently uploaded (20)
Identification of transitional disks in Chamaeleon with Herschel
- 1. A&A 552, A115 (2013) DOI: 10.1051/0004-6361/201220960 c ESO 2013 Astronomy & Astrophysics Identification of transitional disks in Chamaeleon with Herschel , Á. Ribas1,2,3, B. Merín4, H. Bouy2, C. Alves de Oliveira1, D. R. Ardila5, E. Puga4, Á. Kóspál6, L. Spezzi7, N. L. J. Cox8, T. Prusti6, G. L. Pilbratt6, Ph. André9, L. Matrà10, and R. Vavrek4 1 ESAC-ESA, PO Box 78, 28691 Villanueva de la Cañada, Madrid, Spain e-mail: aribas@cab.inta-csic.es 2 Centro de Astrobiología, INTA−CSIC, PO Box − Apdo. de correos 78, Villanueva de la Cañada, Madrid 28691, Spain 3 Ingeniería y Servicios Aeroespaciales−ESAC, PO Box 78, 28691 Villanueva de la Cañada, Madrid, Spain 4 Herschel Science Centre, ESAC−ESA, PO Box 78, 28691 Villanueva de la Cañada, Madrid, Spain 5 NASA Herschel Science Center, California Institute of Technology, 1200 E. California Blvd., Pasadena, CA 91125, USA 6 Research and Scientific Support Department, ESTEC−ESA, PO Box 299, 2200 AG, Noordwijk, The Netherlands 7 European Southern Observatory, Karl-Schwarzschild-Strasse 2, 85748, Garching bei München, Germany 8 Instituut voor Sterrenkunde, KU Leuven, Celestijnenlaan 200D, 3001 Leuven, Belgium 9 Laboratoire AIM Paris – Saclay, CEA/DSM – CNRS – Université Paris Diderot, IRFU, Service d’Astrophysique, Centre d’Études de Saclay, Orme des Merisiers, 91191 Gif-sur-Yvette, France 10 School of Physics, Trinity College Dublin, Dublin 2, Ireland Received 19 December 2012 / Accepted 11 March 2013 ABSTRACT Context. Transitional disks are circumstellar disks with inner holes that in some cases are produced by planets and/or substellar companions in these systems. For this reason, these disks are extremely important for the study of planetary system formation. Aims. The Herschel Space Observatory provides an unique opportunity for studying the outer regions of protoplanetary disks. In this work we update previous knowledge on the transitional disks in the Chamaeleon I and II regions with data from the Herschel Gould Belt Survey. Methods. We propose a new method for transitional disk classification based on the WISE 12 µm − PACS 70 µm color, together with inspection of the Herschel images. We applied this method to the population of Class II sources in the Chamaeleon region and studied the spectral energy distributions of the transitional disks in the sample. We also built the median spectral energy distribution of Class II objects in these regions for comparison with transitional disks. Results. The proposed method allows a clear separation of the known transitional disks from the Class II sources. We find six transitional disks, all previously known, and identify five objects previously thought to be transitional as possibly non-transitional. We find higher fluxes at the PACS wavelengths in the sample of transitional disks than those of Class II objects. Conclusions. We show the Herschel 70 µm band to be a robust and efficient tool for transitional disk identification. The sensitivity and spatial resolution of Herschel reveals a significant contamination level among the previously identified transitional disk candidates for the two regions, which calls for a revision of previous samples of transitional disks in other regions. The systematic excess found at the PACS bands could be either a result of the mechanism that produces the transitional phase, or an indication of different evolutionary paths for transitional disks and Class II sources. Key words. stars: formation – stars: pre-main sequence – protoplanetary disks – planets and satellites: formation 1. Introduction Protoplanetary disks surrounding young stars are known to evolve over timescales of a few million years from a more massive and optically thick phase (Class II objects) to optically thin debris disk systems (Class III sources; see Williams & Cieza 2011, for a recent review on the evolution of protoplan- etary disks). There are several indications of this evolution with time. Infrared (IR) observations of star-forming regions show a systematic decrease of the IR flux with stellar age (Haisch et al. 2001; Gutermuth et al. 2004; Sicilia-Aguilar et al. 2006; Herschel is an ESA space observatory with science instruments provided by European-led Principal Investigator consortia and with im- portant participation from NASA. Appendix A is available in electronic form at http://www.aanda.org Currie & Kenyon 2009). In the optical and ultraviolet, obser- vations show that the disk mass accretion rate decreases with time as predicted by disk evolutionary models (Hartmann et al. 1998; Calvet et al. 2005; Fedele et al. 2010; Sicilia-Aguilar et al. 2010; Spezzi et al. 2012). Another important evidence is found in deep mid-IR spectroscopic observations of young stars with disks that show dust grain growth, crystallization, and settling to the disk mid-plane. These phenomena are found to be corre- lated with the evolution of the disk structure across two orders of magnitude in stellar mass (Meeus et al. 2001; van Boekel et al. 2005; Kessler-Silacci et al. 2005; Apai et al. 2005; Olofsson et al. 2009). Most of the evolution of protoplanetary disks is driven by gravitational interaction and viscosity effects in the disk (Pringle 1981). However, some circumstellar disks show evidence of a different evolutionary phase: they are known as transitional disks. Compared to Class II disks, they display a clear dip in Article published by EDP Sciences A115, page 1 of 11
- 2. A&A 552, A115 (2013) their spectral energy distribution (SED) at short-mid IR (typ- ically around 8−12 µm) and a rising SED with flux excesses similar to that of Class II sources at longer wavelengths (Strom et al. 1989; Calvet et al. 2002; Espaillat et al. 2007; Andrews et al. 2011). The dips in the SEDs are usually explained in terms of dust-depleted regions and/or cavities in the disks, of typical sizes of some tens of AU (see Merín et al. 2010; Andrews et al. 2011, and references therein). Several processes have been proposed to explain these gaps and holes: gravitational interaction with a low-mass companion (Bryden et al. 1999; Rice et al. 2003; Papaloizou et al. 2007), photo-evaporation (Clarke et al. 2001; Alexander et al. 2006a,b), or grain growth (Dullemond & Dominik 2005; Tanaka et al. 2005; Birnstiel et al. 2012). Observational evidence of stellar or substellar companions has been obtained in some cases (i.e., CoKu Tau4 or T Cha, see Ireland & Kraus 2008; Huélamo et al. 2011, respectively). If we were able to distinguish between these different explanations would better understand the mechanisms that produce the gaps in transitional disks, and the planetary for- mation scenario. For this reason, any hint on which process gov- erns the transition phase is relevant. In this paper, we investigate the contribution of the far-IR data from the Herschel Space Observatory (Pilbratt et al. 2010) to our understanding of transitional disks. We present a new method for transitional disk identification and apply it to the sample of Class II objects in the Chamaeleon (Cha) I and II re- gions. Section 2 describes the data reduction process, the sam- ple selection, and the photometry extraction. Section 3 explains the proposed method used in the paper to identify and reclassify transitional disks. A more detailed discussion of the sample of transitional disks is given in Sect. 4. Section 5 summarizes our results. 2. Observations and sample 2.1. Observations The Cha I and II regions were observed by the Herschel Space Observatory in the context of the Gould Belt Survey (André et al. 2010). These regions are part of the Chamaeleon molecular cloud complex that also includes the Cha III cloud. The complex is located at 150−180 pc (Whittet et al. 1997) and is one of the most often studied low-mass star-forming regions because of its proximity. Cha I has an estimated age of ∼2 Myr and a popula- tion of ∼200 young stellar objects (Luhman et al. 2008; Winston et al. 2012). Cha II harbors a smaller population (∼60) of young sources (Young et al. 2005; Spezzi et al. 2008). Because of their age and location, these regions are perfect scenarios for transi- tional disk search and study. Two sets of observations were used for each region: a first set taken in parallel mode, using the PACS (70 and 160 µm Poglitsch et al. 2010) and SPIRE (250, 350, and 500 µm, Griffin et al. 2010) instruments at a speed of 60 /s, and the 100 µm PACS band at 20 /s from a second set in scan mode. The observing strategy is described in more detail in André et al. (2010). The total observing time in parallel mode for Cha I was ∼8 h and 6 h for Cha II, covering a total area of ∼9 deg2 (∼5.5 and 3.5 deg2 ). The PACS 100 µm images covered 2.6 deg2 in Cha I and 2 deg2 in Cha II, and add up to a total time of 8 h and 6 h, respectively (see Winston et al. 2012, and Spezzi et al. in prep. for a detailed description of the data sets). Obsids for Cha I are 1342213178, 1342213179 (parallel mode) and 1342224782,1342224783 (scan mode), and obsids 1342213180,1342213181 (parallel mode), and 1342212708, 1342212709 (scan mode) for Cha II. The data were pre-processed using the Herschel interac- tive processing environment (HIPE, Ott 2010) version 9. The final maps were created using Scanamorphos (Roussel 2012) for PACS, and the destriper algorithm included in HIPE for SPIRE. These two algorithms are optimized for regions such as Chamaeleon, which have bright extended emission. Figure 1 shows a three-color composite image of Cha I (blue: 70 µm, green: 160 µm, and red: 250 µm). 2.2. Sample selection Luhman et al. (2008) and Luhman & Muench (2008) presented the largest census of young stellar objects (YSOs) members of Cha I including Spitzer photometry, and Alcalá et al. (2008) and Spezzi et al. (2008) did the same for Cha II. We selected from these studies the sources classified as Class II with known ex- tinction values. Since we aim to classify transitional disks, we also included T25, flagged as Class III in Luhman et al. (2008) but later found to be a transitional source in Kim et al. (2009). We rejected objects with signal-to-noise ratio (S/N) < 5 in any of the 2MASS bands to ensure a good photometry estimation and coordinates measurement. The final sample of Class II objects is comprised of 119 sources. To our knowledge, 12 sources in the sample are classified as transitional disk candidates in the literature: SZ Cha, CS Cha, T25, T35, T54, T56, and CHXR 22E from Kim et al. (2009), C7-1 from Damjanov et al. (2007), CR Cha, WW Cha, and ISO- ChaI 52 from Espaillat et al. (2011), and ISO-ChaII 29 from Alcalá et al. (2008). 2.3. Photometry We extracted Herschel photometry of the Class II sample fol- lowing these steps: 1. We used the Sussextractor algorithm (Savage & Oliver 2007) in HIPE to detect sources with an S/N > 5 in the PACS images. We then visually checked that no obvious source was missing. 2. We cross-matched the initial sample with the detections in the PACS images, using a search radius of 5 . This ra- dius was chosen based on the size of the point spread func- tions (PSFs) at these wavelengths (∼5.8 × 12.1 , 6.7 × 7.3 , and 11.4 × 13.4 , for the 70, 100, and 160 µm bands at the corresponding observing speeds). We note that the background emission becomes more significant for longer wavelengths, producing false detections because of bright filaments and ridges. To avoid possible mismatches, we considered as Herschel-detected sources only those with counterparts at any PACS band. For SPIRE, we found the Sussextractor output to be highly contaminated with false detections. Therefore, we visually inspected the positions of the detected sources individually for these bands. 3. We performed aperture photometry centered on the 2MASS coordinates of each detection. We used the recommended aperture radii and background estimation annulus for each band (see the PACS point-source flux calibration techni- cal note from April 2011, and Sect. 5.7.1.2 of the SPIRE data reduction guide). The values for the apertures, inner and outer annulus radii (in this order) are 12 , 20 , 30 for 70 and 100 µm, 22 , 30 , 40 for 160 µm, 22 , 60 , 90 for 250 µm, 30 , 60 , 90 for 350 µm, and 42 , 60 , 90 for 500 µm. A115, page 2 of 11
- 3. Á. Ribas et al.: Identification of transitional disks in Chamaeleon with Herschel 10h54m11h00m06m12m18m RA (J2000) -78°00' 30' -77°00' 30' -76°00' Dec(J2000) 1 2 3 4 5 6 7 8 9 1 parsec 1: T56 2: T54 3: WW Cha 4: T35 5: T25 6: ChaI 52 7: CS Cha 8: CR Cha 9: SZ Cha Fig. 1. Left: three-color composite image of the Cha I region (blue: PACS 70 µm, green: PACS 160 µm, red: SPIRE 250 µm). Circles mark the position of transitional disks detected in the Herschel images and classified with the proposed method (see Sect. 3.3). Triangles show sources not fulfilling our selection criteria, and squares represent non-detected sources. Right: thumbnails of the 70 µm Herschel maps (50 × 50 ). The color scale ranges from the median value (background level) to 5σ over this value (black). In both figures, north is up, and east is left. Note that WW Cha is located on a bright core. 4. Since aperture photometry was used, objects close to bright filaments or cores are likely to suffer from contamina- tion. Also, given the size of the PSF, no photometric mea- surements can be performed for close objects (separation less than ∼10 ). Therefore we rejected ten detections that showed obvious problems in their photometry or enclosed more than one object. After excluding the transitional disks, the final result of this pro- cess is 41 Class II sources detected at any PACS band (26 and 15 in Cha I and Cha II, respectively), nine of them detected also with SPIRE. We checked that the obtained photometry was consistent with that from other map-making algorithms (such as photPro- ject for PACS), and found no significant deviation. We visually inspected the position of non-detected tran- sitional disks in the original sample and found that C7-1, CHXR 22E, and ISO-ChaII 29 are not detected at any of the Herschel bands. Additionally, ISO-ChaI 52 is not detected by Sussextractor at 70 µm, but it is at 100 µm. The object is visu- ally found in the 70 µm image with a flux of 150 mJy over a background root mean square (rms) of 40 mJy. We therefore in- cluded the 70 µm flux in our analysis. Source T25 is not in the field of view of the 100 µm map, which is smaller than the par- allel mode observations. Coordinates and stellar parameters for the transitional disks in this study can be found in Table 1. 2.4. Photometric uncertainties and upper limits The absolute calibration errors for PACS and SPIRE are 5% and 7%, respectively (see PACS and SPIRE observer manuals). To ensure a conservative error estimation, we used a 15% error value for PACS and 20% for SPIRE, taking into account that the background emission becomes increasingly stronger at longer wavelengths. A115, page 3 of 11
- 4. A&A 552, A115 (2013) Table 1. Coordinates and stellar parameters of the 12 transitional disk candidates analyzed in this work. Name RAJ2000 DecJ2000 AV SpT T∗ L∗ M∗ R∗ Refs. (mag) Type (K) (L ) (M ) (R ) CR Cha 10:59:06.97 −77:01:40.3 1.5 K2 4900 3.5 1.9 2.6 1, 2, 3, 4, 5, 6 CS Cha 11:02:24.91 −77:33:35.7 0.25 K6 4205 1.5 0.9 2.3 1, 2, 3, 5, 6, 7, 8, 9 SZ Cha 10:58:16.77 −77:17:17.1 1.90 K0 5250 1.9 1.4 1.7 1, 2, 3, 4, 5, 6, 7, 8, 9 WW Cha 11:10:00.11 −76:34:57.9 4.8 K5 4350 6.5 1.2 4.5 1, 2, 3, 4, 5, 6, 7, 8 T25 11:07:19.15 −76:03:04.9 0.78 M3 3470 0.3 0.3 1.5 1, 2, 3, 4, 5, 6, 7, 9 T35 11:08:39.05 −77:16:04.2 3.5 M0 3850 0.4 0.6 0.5 1, 2, 3, 4, 5, 6, 7, 9 T54 11:12:42.69 −77:22:23.1 1.78 G8 5520 4.1 2.4 1.5 1, 2, 3, 4, 5, 6, 7, 9, 10, 11 T56 11:17:37.01 −77:04:38.1 0.23 M0.5 3720 0.4 0.5 1.6 1, 2, 3, 4, 5, 6, 7, 9 ISO-ChaI 52 11:04:42.58 −77:41:57.1 1.3 M4 3370 0.1 0.3 1.0 2, 3, 4, 5, 7 C7-1 11:09:42.60 −77:25:57.9 5.0 M5 3125 ... ... ... 3, 4, 5, 7, 12 CHXR 22E 11:07:13.30 −77:43:49.9 4.79 M3.5 3400 0.2 ... ... 3, 5, 7, 9 ISO-ChaII 29 12:59:10.14 −77:12:13.9 5.57 M0 3850 0.65 ... 1.85 13, 14 References. (1) Gauvin & Strom (1992); (2) Espaillat et al. (2011); (3) Luhman (2007); (4) Luhman & Muench (2008); (5) Manoj et al. (2011); (6) Henning et al. (1993); (7) Luhman et al. (2008); (8) Belloche et al. (2011); (9) Kim et al. (2009); (10) Lafrenière et al. (2008); (11) Preibisch (1997); (12) Damjanov et al. (2007); (13) Spezzi et al. (2008); (14) Alcalá et al. (2008). Table 2. Herschel photometry of the 12 transitional disks in the sample. Name F70 µm F100 µm F160 µm F250 µm F350 µm F500 µm (Jy) (Jy) (Jy) (Jy) (Jy) (Jy) Detected sources CR Cha 1.61 ± 0.24 2.19 ± 0.33 2.74 ± 0.41 2.37 ± 0.47 1.69 ± 0.34 1.09 ± 0.22 CS Cha* 3.08 ± 0.46 2.82 ± 0.42 2.32 ± 0.35 0.88 ± 0.18 0.38 ± 0.08 0.13 ± 0.03 SZ Cha 3.88 ± 0.58 3.63 ± 0.54 3.86 ± 0.58 2.85 ± 0.57 1.94 ± 0.39 1.14 ± 0.23 WW Cha 25.91 ± 3.88 32.32 ± 4.85 27.3 ± 4.10 24.92 ± 4.99 12.44 ± 2.49 6.79 ± 1.36 T25 0.52 ± 0.08 ... 0.50 ± 0.08 0.20 ± 0.04 0.11 ± 0.02 <0.10 T35 0.38 ± 0.06 0.36 ± 0.06 0.200 ± 0.03 <1.69 <2.10 <2.06 T54 0.60 ± 0.09 0.77 ± 0.12 0.98 ± 0.15 0.46 ± 0.09 <1.04 <1.18 T56 0.68 ± 0.10 0.57 ± 0.09 0.30 ± 0.05 0.30 ± 0.05 0.30 ± 0.06 0.11 ± 0.02 ISO-ChaI 52 0.15 ± 0.02 0.15 ± 0.02 <1.07 <1.42 <2.06 <2.04 Undetected sources C7-1 <0.04 <0.08 <0.94 <1.24 <1.69 <2.10 CHXR 22E <0.08 <0.14 <1.10 <1.19 <1.18 <0.96 ISO-ChaII 29 <0.04 <0.07 <0.85 <1.41 <2.65 <3.00 Notes. * SPIRE photometry is very likely contaminated for this source (see appendix). When no source was detected, we computed an upper limit calculating the rms of 100 apertures taken around the source, us- ing the same aperture radii and correction factors as for the de- tections. The extracted PACS and SPIRE fluxes for the 12 tran- sitional candidates in the considered sample are reported in Table 2. 3. Identification of transitional disks 3.1. Photometric selection Several selection criteria have been used in the past to separate transitional disks from Class II sources. Fang et al. (2009) used a color−color diagram based on the Ks band and on the [5.8], [8.0] and [24] Spitzer bands. Muzerolle et al. (2010) proposed a clas- sification criterion based on the slope of the SED between 3.6 and 4.8 µm and between 8 to 24 µm. Cieza et al. (2010) also used a color−color diagram, based on the Spitzer photometry at 3.6, 4.5 and 24 µm. However, all these methods were found to suffer from different contamination levels, as explained in Merín et al. (2010). There is a high diversity in the morphology of transitional disks, hence there are various definitions. However, most of them share two common characteristics: (1) they have low or no ex- cess with respect to the photosphere up to the λturn−off or the pivot point, usually found around ∼8−10 µm, and (2) they have strong excesses for longer wavelengths (see Sect. 7.1 in Williams & Cieza 2011, and references therein). This is translated into a de- creasing slope of the SED up to λturn−off, and an increasing one for longer wavelengths. To identify transitional disks using Herschel photome- try, we computed two spectral indexes (α): one between the Ks band and 12 µm (αKs−12), and the other between 12 µm and 70 µm (α12−70). The spectral index is defined as αλ1−λ2 = log(λ1Fλ1 )−log(λ2Fλ2 ) log(λ1)−log(λ2) , where λ is measured in µm and Fλ in erg s−1 cm−2 s−1 . Therefore, α traces the slope of the SED in the considered range (α > 0 → rising SED, α < 0 → decreasing SED). This spectral index has been intensively used since its in- troduction by Lada & Wilking (1984) to classify protostars and young objects. Figure 2 demonstrates that these two slopes together effi- ciently separate the two populations. The separation is clearer in the 12−70 µm axis, where α12−70 < 0 corresponds to typi- cal Class II sources, and α12−70 > 0 is indicative of the tran- sitional nature of the objects. This separation in the slope be- tween 12 µm and 70 µm is an expected feature: for short-mid IR wavelengths, the slope depends strongly on the presence of weak excess, or on the spectral type of the star if there is no excess. On the other hand, the definition of transitional disks A115, page 4 of 11
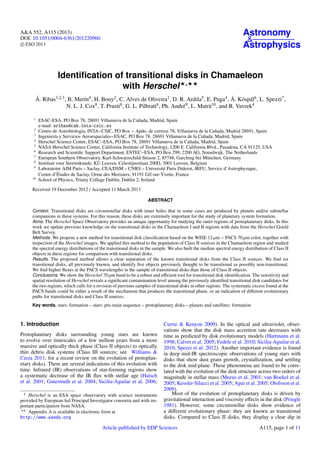
- 5. Á. Ribas et al.: Identification of transitional disks in Chamaeleon with Herschel 2.5 2.0 1.5 1.0 αK−12 1.5 1.0 0.5 0.0 0.5 1.0 1.5 2.0 α12−70 SZ Cha CS Cha T25 T35 T54 T56 ISO-ChaI 52 CR Cha WW Cha CHXR 22E C7-1ISO-ChaII 29 ESO-Hα 559 Fig. 2. SED slope between the 12 and 70 µm (α12−70) as a function of the SED slope between the Ks-band and 12 µm (αKs−12). Transitional disks from the literature meeting the selection criterion are marked as red dots, green downward arrows are those for which only upper limits could be estimated. Class II objects are black dots. Blue squares are pre- transitional disks from Espaillat et al. (2011). There is a clear separation between Class II and transitional disks due to the different shape of their SED. The single black dot with α > 0 is ESO-Hα 559, an edge-on disk. This diagram shows the potential for transitional disk classification us- ing the 70 µm band. itself guarantees a positive slope for longer wavelengths. This separation also reveals the usefulness of the Herschel data for this classification. As a result of the selection method, two disks reported in Espaillat et al. (2011), WW Cha and CR Cha, are not separated from Class II objects and we confirm that they do not deviate significantly from the median SED of the Class II sources in Cha I and II (Fig. 5). Based on this evidence, we con- sider them as non-transitional. The rest of the transitional disks are properly separated from Class II sources. The computed up- per limits also allow us to classify C7-1 and ISO-ChaII 29 as non-transitional using this method. Interestingly, one Class II source shows α12−70 > 0 in the for- mer diagram. The object, called ESO-Hα 559, has been recently identified as a probable edge-on disk in Robberto et al. (2012) by modeling its SED. Its underluminosity with respect to its spec- tral type also supports this scenario. We find this type of object to be a source of contamination for this method: edge-on disks can mimic the SED of transitional sources. Their geometry will cause a high circumstellar extinction level, blocking the light from the central star at short wavelengths (Stapelfeldt & Moneti 1999; Wood et al. 2002; Duchêne et al. 2010; Huélamo et al. 2010). The disk becomes optically thin for longer wavelengths (>24 µm) and the emission from the star can pass through the disk, resulting in an increase of the flux and hence a positive slope of the SED. When their spectral type is known, edge-on disks can be identified in Hertzsprung−Russell diagrams, as they are often underluminous. We also note that this method is not suitable for detecting a small subsample of transitional disks called anemic (Lada et al. 2006), homologously depleted (Currie & Kenyon 2009), or weak excess disks (Muzerolle et al. 2010). They are defined as objects with low excess at all infrared wavelengths and show αexcess < 0. For this reason, they cannot be found with the criterion proposed in this work. On the other hand, the rest of transitional disks should display α12−70 > 0 and hence can be properly separated. 1 0.0 0.2 0.4 0.6 0.8 1.0 Fν(arb.units) 70 µm SZ Cha, others 1 0.0 0.2 0.4 0.6 0.8 1.0 Fν(arb.units) 100 µm 0 5 10 15 20 Radius ('') 0.0 0.2 0.4 0.6 0.8 1.0 Fν(arb.units) 160 µm 1 1 70 µm T54 1 1 100 µm 0 5 10 15 20 Radius ('') 1 160 µm Fig. 3. Average brightness radial profile (black line) for a point source (SZ Cha, left) and an extended source (T54, right) compared to the ob- servational PSF radial profile (red line). The error bars are the rms of the values. All considered sources present the same behavior as SZ Cha except for T54, whose observed radial profile is clearly above the PSF profile, indicating that this source is extended and all others are point- like in Herschel images. 3.2. Morphological classification We checked whether any of the remaining seven transitional disks were spatially resolved in the Herschel images. Extended emission could indeed indicate contamination by a coincident background source, a close by object, or the extended back- ground emission, as shown in Matrà et al. (2012). Given the estimated distance of 160 pc to the Cha I molecular cloud (Whittet et al. 1997; Luhman & Muench 2008), the full- width at half-maximum of the PSFs for the three PACS bands (∼6 , 7 and 12 , see the official PACS PSF document1 ) would allow us to resolve structures of ∼900−2000 AU. It is difficult to define an outer radius for protoplanetary/transitional disks, but typical values range from some tens to ∼1000 AU in the most extreme cases (Williams & Cieza 2011). Direct imaging of pro- plyds and disks in the Trapezium cluster by Vicente & Alves (2005) showed the size distribution to be contained within 50 and 100 AU. On the other hand, the Rc parameter (defined as the radius where the surface density deviates significantly from a power law and the disk density declines rapidly, see Williams & Cieza 2011) has typical values between 15−230 AU (Hughes et al. 2008; Andrews et al. 2009, 2010). This suggests that none of these sources should be resolved in the Herschel images. In each of the PACS band, we compared the radial profile of the transitional disks with an empirical PSF constructed using clean isolated point sources. Of the nine de- tected sources, only T54 was found to be extended, as shown in Fig. 3. Matrà et al. (2012) showed that the excess beyond 100 µm is likely not related to the source, and therefore not originating from a circumstellar disk. This interpretation results in a sub- stantial decrease in the IR excess coming from T54, making its SED not representative of the characteristic inner-hole geometry around transitional disks. The case of T54 shows that one needs to verify the origin of the IR excess in protoplanetary/transitional disks. 1 http://herschel.esac.esa.int/twiki/pub/Public/ PacsCalibrationWeb/bolopsf_20.pdf A115, page 5 of 11
- 6. A&A 552, A115 (2013) We found no other extended sources in the Herschel images and conclude that all the detected transitional disks have far-IR excesses related to the sources. Therefore all but one (T54) of the transitional disk candidates in the Cha I and II regions are con- firmed to be point-sources, up to the resolution of the Herschel PACS and SPIRE instruments. 3.3. Transitional disk classification Thanks to the new Herschel photometric data, we are able to reclassify the already known transitional disks in the Cha I and II regions based on the shape of their SEDs. CS Cha, SZ Cha, T25, T35, T56, and ISO-ChaI 52 show a typical transitional disk SED. Two objects from Espaillat et al. (2011) do not fulfill our se- lection criterion, which is tuned to identify clear signatures of in- ner holes. These sources were selected by Espaillat et al. (2011) based on their silicate feature strengths, and therefore the dif- ferent results obtained in this study are not surprising. CR Cha shows weak excess up to 2 µm and a typical Class II SED for longer wavelengths. The SED of WW Cha does not display any decrease in its IR emission, typical for transitional disks. Indeed, the Herschel images support one of the scenarios proposed by Espaillat et al. (2011): WW Cha is located on one of the cores in Cha I and presumably accretes at a high rate. Furthermore, it shows a strong excess along the whole wavelength range and therefore cannot be considered as a transitional disk, but is more likely a Class II source. The dust-rich environment around WW Cha might also contaminate the Herschel photometry and ac- count for part of the observed IR excess emission. These sources are then probably non-transitional. Moreover, the morphological analysis of the candidates shows that T54 is extended (Fig. 3) and hence a misclassified object. Conclusions for the non-detected sources are more compli- cated to draw, and they should be treated with caution, since a non-detection does not directly reject a candidate, but could sim- ply be due to a sensitivity bias. The computed upper limits for C7-1 and ISO-ChaII 29 exclude them as transitional disks ac- cording our selection criterion. ISO-ChaII 29 is a special case: the upper limit of 35 mJy in PACS 70 µm is lower than the de- tection of 56.90 ± 8.63 mJy in the MIPS 70 µm band indicated in Alcalá et al. (2008), and these two measurements are in- consistent. ISO-ChaII 29 shows both strong Li absorption and Hα emission, which confirms it as a YSO (Spezzi et al. 2008). However, it is the only transitional disk in the sample with pho- tospheric fluxes up to 24 µm in our and the Alcalá et al. (2008) sample. These authors also found it to have the steepest αexcess. This object is therefore probably misclassified in the Spitzer im- ages, as strongly suggested by the non-detection in any of the Herschel bands and by the outlier nature of the object if the MIPS detection is considered. We therefore reclassify it as a non- transitional source. We stress that our method is unable to detect transitional disks with weak excesses, and deeper observations should be made to confirm or reject the presence of disks and holes in these systems. In the case of CHXR 22E it is not possi- ble to extend the analysis further without making strong assump- tions about the disk mass and morphology. For this reason, we exclude it for the remainder of the study. As mentioned in Sect. 3.1, it is important to note that the pro- posed criterion will only select transitional objects with increas- ing slopes between 12 and 70 µm. This feature is unlikely to be produced by grain growth alone (see Williams & Cieza 2011, for a review on the topic). As a result, the proposed classifica- tion criterion may be biased toward detecting only transitional disks with large inner holes produced by photoevaporation, gap opening by unresolved companions, giant planet formation, or a combination of these scenarios. Physical interpretation of this peculiar SED shapes requires detailed modeling, and there is no full consensus yet on which physical phenomena can be safely attributed to each type of SED (see e.g. Birnstiel et al. 2012). A more detailed analysis of this topic will help to determine the real impact of this selection effect. From the initial sample of 12 transitional disk candidates in the Cha I and II regions we confirm six objects to be transitional disks, reject five sources by photometric or morphological crite- ria, and leave one object unclassified since it is not detected in the Herschel images. These numbers imply a significant (∼45%) observed contamination level in the transitional disk sample con- sidered in this study. Given the small number statistics, it is pre- mature to extend this result to other samples. However, this result calls for a revision of the known transitional disks: if applica- ble to the whole sample, this contamination level would imply a shorter transitional-phase lifetime and hence could shed some light on the mechanisms responsible for the evolution of proto- planetary disks. 4. Transitional disks in the sample We searched for additional photometric values in the literature for each of the transitional objects in our sample. Gauvin & Strom (1992) reported optical photometry for all sources in Cha I except for CHXR 22E, ISO-ChaI 52, and C7-1. We have queried the VizieR catalog service and retrieved additional data for these targets from GALEX (Martin et al. 2005), 2MASS (Skrutskie et al. 2006), DENIS (DENIS Consortium 2005), WISE (Wright et al. 2010), and AKARI (Murakami et al. 2007). To avoid pos- sible mismatching, we chose a search radius of 1 around the 2MASS coordinates. We rejected DENIS photometry for T25, T35, and ISO-ChaI 52, since it clearly disagreed with the rest of photometric data. (Sub)millimeter data at 870 µm and 1.3 mm were also included from Belloche et al. (2011) and Henning et al. (1993), respectively. Spitzer photometric measurements were in- cluded from Damjanov et al. (2007), Luhman et al. (2008), Luhman & Muench (2008), and Alcalá et al. (2008). We also retrieved the Spitzer IRS spectra from the CASSIS database (Lebouteiller et al. 2011). The resulting SEDs for all sources are shown in Figs. 4−6. Thumbnails of the transitional disks as seen in the Herschel 70 µm images can be found in Fig. 1. We note here that the cross-shaped PSF at 70 µm is produced by the par- allel mode observations, and does not represent resolved objects. We compared the Herschel fluxes of the sample of transi- tional disks with the Class II sources in the same region. For this purpose, we first inspected the SEDs of all Class II sources (after removing the transitional disks sample). We identified and removed one object (J11111083-7641574) previously clas- sified as an edge-on disk (Luhman & Muench 2008; Robberto et al. 2012). It could not be identified in the slope-slope dia- gram since it is only detected at 100 µm. The object is present in the Herschel images at 70 µm, but was not detected by Sussextractor with the selected threshold. We built the median SED of all Class II objects, extinction corrected and normalized to the J-band. We also computed SED of the first (<25%) and fourth (>75%) quartiles. Given the low detection numbers for the SPIRE bands, we used the lowest and highest values instead of the quartiles at those wavelengths. We included photometry from the R, I, 2MASS, Spitzer, and Herschel bands. We con- sidered all objects detected in each band (regardless of whether they were undetected in the other bands). The obtained values A115, page 6 of 11
- 7. Á. Ribas et al.: Identification of transitional disks in Chamaeleon with Herschel 10-1 100 101 102 103 Wavelength (µm) 10-13 10-12 10-11 10-10 10-9 λFλ(ergcm−2s−1) CS Cha 10-1 100 101 102 103 Wavelength (µm) 10-13 10-12 10-11 10-10 10-9 10-8 λFλ(ergcm−2s−1) SZ Cha 10-1 100 101 102 103 Wavelength (µm) 10-13 10-12 10-11 10-10 10-9 λFλ(ergcm−2s−1) T25 10-1 100 101 102 103 Wavelength (µm) 10-13 10-12 10-11 10-10 10-9 λFλ(ergcm−2s−1) T35 10-1 100 101 102 103 Wavelength (µm) 10-14 10-13 10-12 10-11 10-10 10-9λFλ(ergcm−2s−1) T56 10-1 100 101 102 103 Wavelength (µm) 10-13 10-12 10-11 10-10 λFλ(ergcm−2s−1) ISO-ChaI 52 Fig. 4. SEDs of the detected transitional disk candidates, confirmed by our classification criterion and updated with the fluxes from Herschel. Black dots are the dereddened observed values from the literature, downward black arrows are flux upper limits from the literature. Herschel data are represented in red (squares for detections, downward arrows for upper limits). Uncertainties are within symbol sizes. The IRS spectra from Manoj et al. (2011) (black solid lines) and the photospheres (dashed black lines from the NextGen models from Allard et al. 2012) are also plotted. The median Class II SED (blue solid line) and the first and fourth quartiles (blue area) are shown (see also Sect. 4 and Table 3). 10-1 100 101 102 103 Wavelength (µm) 10-13 10-12 10-11 10-10 10-9 10-8 λFλ(ergcm−2s−1) CR Cha 10-1 100 101 102 103 Wavelength (µm) 10-13 10-12 10-11 10-10 10-9 10-8 λFλ(ergcm−2s−1) WW Cha 10-1 100 101 102 103 Wavelength (µm) 10-13 10-12 10-11 10-10 10-9 10-8 λFλ(ergcm−2s−1) T54 Fig. 5. SEDs of transitional disk that do not fulfill our classification criteria. CR Cha and WW Cha display clear Class II SED. T54 appears extended in the Herschel images. Symbols are as in Fig. 4. 10-1 100 101 102 103 Wavelength (µm) 10-12 10-11 10-10 λFλ(ergcm−2s−1) C7-1 10-1 100 101 102 103 Wavelength (µm) 10-12 10-11 10-10 λFλ(ergcm−2s−1) CHXR 22E 10-1 100 101 102 103 Wavelength (µm) 10-13 10-12 10-11 10-10 10-9 λFλ(ergcm−2s−1) ISO-ChaII 29 Fig. 6. SED of the transitional disk candidates not detected by Herschel for which only flux upper limits could be estimated. Symbols are the same as in Fig. 4. The upper limits at 70 µm for C7-1 and ISO-ChaII 29 allow us to classify them as non-transitional with our selection criteria. A115, page 7 of 11
- 8. A&A 552, A115 (2013) Table 3. Normalized flux densities of the median SED, upper SED (fourth quartile) and lower SED (first quartile) of the Class II objects in Cha I and Cha II, after extinction correction. λ (µm) Median transitional Median Upper Lower Detections (Fλ arbitrary units) R 1.01 0.79 1.00 0.38 32 I 1.22 1.02 1.34 0.74 32 J 1.00 1.00 1.00 1.00 107 H 0.67 0.67 0.72 0.61 107 Ks 0.35 0.38 0.45 0.32 107 IRAC 3.6 7.1e-2 0.10 0.15 7.5e-2 78 IRAC 4.5 3.2e-2 5.5e-2 8.5e-2 4.0e-2 70 IRAC 5.8 2.0e-2 3.0e-2 4.5e-2 2.2e-2 86 IRAC 8.0 4.7e-3 1.5e-2 2.7e-2 1.1e-3 78 MIPS 24 3.5e-3 2.5e-3 4.4e-3 1.6e-4 95 PACS 70 1.8e-3 4.2e-4 7.0e-4 3.0e-4 23 PACS 100 6.8e-4 2.5e-4 3.5e-4 1.2e-4 41 PACS 160 3.5e-4 7.7e-5 1.5e-4 5.5e-5 19 SPIRE 250 5.7e-5 5.1e-5 1.2e-4 1.3e-5 9 SPIRE 350 1.9e-5 2.9e-5 7.5e-5 2.8e-6 9 SPIRE 500 5.2e-6 9.1e-6 2.3e-5 6.3e-7 7 Notes. Transitional disks are not included. The number of stars detected in each band is also indicated. For comparison, we also include the median value for the six transitional disks detected in this study, although we stress its very low number statistics. are given in Table 3. We also found the median SED not to vary significantly when only K or M type stars were considered. The comparison between the SEDs of transitional disks and the median SED of Class II objects in Cha I and II shows a sys- tematic difference in the 70−160 µm range. The six transitional disks found with the selection criterion used in this study display a clear excess over the obtained Class II median SED, and all of them are over the fourth quartile level (uncertainties for T35 are consistent with a flux value below this level). Even though this median SED was built with a relatively small statistical sample, this result clearlyshows that transitional disks are brighter at 70−160 µm than typical Class II sources in these regions. Similar phenomena were already tentatively described by Winston et al. (2012) in a preliminary study of the YSO pop- ulation of Cha I and by Cieza et al. (2011) for T Cha, but here we provide consistent results derived from a much larger sample of transitional disks. This excess was not previously found by large programs using the Spitzer Space Telescope, such as cores 2 disks (Evans et al. 2003, 2009). This can probably be explained by the lower sensitivity of Spitzer at 70 µm. A bias toward the brightest objects could affect these re- sults in two different ways: we might miss the faintest transi- tional disks and the faintest Class II sources. In the first case, the Herschel data are enough to classify eleven out of the twelve pre- viously known transitional objects in the sample (less than 10% objects missed). This suggests that the proposed method does not suffer from a strong bias effect. The existence of an unknown population of transitional disks not identified with Spitzer cannot be ruled out (although this possibility is unlikely, see Merín et al. 2010). However, this would not alter the systematic difference found at the 70−160 µm range between the detected previously known transitional disks and Class II objects in these regions. On the other hand, the second scenario (e.g. missing faint Class II sources) would imply lower values for the Class II median SED in the Herschel range, producing an even stronger difference be- tween transitional and Class II disks. As a result, the Class II median SED computed here should be considered as an upper limit. If the excess at PACS bands is a common feature of tran- sitional objects, two explanations can be proposed to explain it: (1) transitional disks are not the result of the evolution of Class II sources, but a parallel evolutionary path, or (2) the dis- crepancy between transitional disks and Class II objects is pro- duced during the transitional phase (maybe even by the same mechanism that causes the transitional disk evolution). In this case, the piling-up of mass at some point of the outer disk could produce the steep slope and the excess found at 70 µm (Williams & Cieza 2011). With the available data it is not possible to favor any of these scenarios, so we leave this question open to future studies. A larger and statistically more significant sample of transi- tional disks and modeling are required to confirm whether the difference found at the PACS bands applies to the whole transi- tional disk sample, to identify the real cause (or causes) of the excess, and to understand whether transitional disks are indeed a later stage of Class II objects or follow a different evolutionary path. 5. Conclusions We presented a new method for identifying transitional disks based on the slope between the WISE 12 µm and PACS 70 µm bands. We have applied this method to the whole sample of known Class II objects in the Cha I and II star-forming re- gions. We were able to separate known transitional sources from Class II objects, and reclassified five objects as possibly non- transitional. This method could produce false positives due to the presence of edge-on disks, and Hertzsprung–Russell diagrams should be used to reject underluminous sources. As a result, we found an observed contamination level of ∼45% among previ- ously identified transitional disks in these regions. The size of our sample is relatively small, and these results cannot be ap- plied to the whole transitional disk sample. However, a revision of the transitional disk population in other star-forming regions is warranted to determine the real contamination level and to ac- count for its effects. We built the median SED of Class II sources in the regions, and found significantly higher PACS fluxes in the transitional A115, page 8 of 11
- 9. Á. Ribas et al.: Identification of transitional disks in Chamaeleon with Herschel disks compared to it. This excess could be produced during the transitional phase, or be explained in terms of a different evolu- tionary path for transitional disks and Class II sources. Future studies of other star-forming regions observed by the Herschel Space Observatory will clarify the contamination level of the sample of known transitional objects, and will provide stronger evidence for a systematic excess at PACS wavelengths in transitional disks with respect to Class II sources. Acknowledgements. We thank the referee for his/her constructive comments. This work has been possible thanks to the ESAC Science Operations Division research funds, support from the ESAC Space Science Faculty and of the Herschel Science Centre. N.L.J.C. acknowledges support from the Belgian Federal Science Policy Office via the ESA’s PRODEX Program. PACS has been developed by a consortium of institutes led by MPE (Germany) and in- cluding UVIE (Austria); KUL, CSL, IMEC (Belgium); CEA, OAMP (France); MPIA (Germany); IFSI, OAP/AOT, OAA/CAISMI, LENS, SISSA (Italy); IAC (Spain). This development has been supported by the funding agencies BMVIT (Austria), ESA-PRODEX (Belgium), CEA/CNES (France), DLR (Germany), ASI (Italy), and CICT/MCT (Spain). SPIRE has been developed by a consor- tium of institutes led by Cardiff Univ. (UK) and including Univ. Lethbridge (Canada); NAOC (China); CEA, LAM (France); IFSI, Univ. Padua (Italy); IAC (Spain); Stockholm Observatory (Sweden); Imperial College London, RAL, UCL-MSSL, UKATC, Univ. Sussex (UK); and Caltech, JPL, NHSC, Univ. Colorado (USA). This development has been supported by national funding agencies: CSA (Canada); NAOC (China); CEA, CNES, CNRS (France); ASI (Italy); MCINN (Spain); SNSB (Sweden); STFC (UK); and NASA (USA).This study also makes use of the data products from the Two Micron All Sky Survey (2MASS), a joint project of the University of Massachusetts and IPAC/Caltech, funded by NASA and the National Science Foundation; data products from the Wide-field Infrared Survey Explorer (WISE), a joint project of the University of California, Los Angeles, and the Jet Propulsion Laboratory (JPL)/California Institute of Technology (Caltech); data produts from DENIS, a project partly funded by the SCIENCE and the HCM plans of the European Commission under grants CT920791 and CT940627; the NASA Infrared Processing and Analysis Center (IPAC) Science Archive; the SIMBAD database; and the Vizier service, operated at the Centre de Données astronomiques de Strasbourg, France. References Alcalá, J. M., Spezzi, L., Chapman, N., et al. 2008, ApJ, 676, 427 Alexander, R. D., Clarke, C. J., & Pringle, J. E. 2006a, MNRAS, 369, 216 Alexander, R. D., Clarke, C. J., & Pringle, J. E. 2006b, MNRAS, 369, 229 Allard, F., Homeier, D., & Freytag, B. 2012, Roy. Soc. London Philos. Trans. Ser. A, 370, 2765 André, P., Men’shchikov, A., Bontemps, S., et al. 2010, A&A, 518, L102 Andrews, S. M., Wilner, D. J., Hughes, A. M., Qi, C., & Dullemond, C. P. 2009, ApJ, 700, 1502 Andrews, S. M., Wilner, D. J., Hughes, A. M., Qi, C., & Dullemond, C. P. 2010, ApJ, 723, 1241 Andrews, S. M., Wilner, D. J., Espaillat, C., et al. 2011, ApJ, 732, 42 Apai, D., Pascucci, I., Bouwman, J., et al. 2005, Science, 310, 834 Appenzeller, I. 1977, A&A, 61, 21 Appenzeller, I., Krautter, J., & Jankovics, I. 1983, A&AS, 53, 291 Belloche, A., Schuller, F., Parise, B., et al. 2011, A&A, 527, A145 Birnstiel, T., Andrews, S. M., & Ercolano, B. 2012, A&A, 544, A79 Bryden, G., Chen, X., Lin, D. N. C., Nelson, R. P., & Papaloizou, J. C. B. 1999, ApJ, 514, 344 Calvet, N., D’Alessio, P., Hartmann, L., et al. 2002, ApJ, 568, 1008 Calvet, N., D’Alessio, P., Watson, D. M., et al. 2005, ApJ, 630, L185 Cieza, L. A., Schreiber, M. R., Romero, G. A., et al. 2010, ApJ, 712, 925 Cieza, L. A., Olofsson, J., Harvey, P. M., et al. 2011, ApJ, 741, L25 Cieza, L. A., Lacour, S., Schreiber, M. R., et al. 2013, ApJ, 762, L12 Clarke, C. J., Gendrin, A., & Sotomayor, M. 2001, MNRAS, 328, 485 Currie, T., & Kenyon, S. J. 2009, AJ, 138, 703 Damjanov, I., Jayawardhana, R., Scholz, A., et al. 2007, ApJ, 670, 1337 DENIS Consortium 2005, VizieR Online Data Catalog: II/263 Duchêne, G., McCabe, C., Pinte, C., et al. 2010, ApJ, 712, 112 Dullemond, C. P., & Dominik, C. 2005, A&A, 434, 971 Espaillat, C., Calvet, N., D’Alessio, P., et al. 2007, ApJ, 664, L111 Espaillat, C., Furlan, E., D’Alessio, P., et al. 2011, ApJ, 728, 49 Evans, II, N. J., Allen, L. E., Blake, G. A., et al. 2003, PASP, 115, 965 Evans, II, N. J., Dunham, M. M., Jørgensen, J. K., et al. 2009, ApJS, 181, 321 Fang, M., van Boekel, R., Wang, W., et al. 2009, A&A, 504, 461 Fedele, D., van den Ancker, M. E., Henning, T., Jayawardhana, R., & Oliveira, J. M. 2010, A&A, 510, A72 Furlan, E., Watson, D. M., McClure, M. K., et al. 2009, ApJ, 703, 1964 Gauvin, L. S., & Strom, K. M. 1992, ApJ, 385, 217 Griffin, M. J., Abergel, A., Abreu, A., et al. 2010, A&A, 518, L3 Guenther, E. W., Esposito, M., Mundt, R., et al. 2007, A&A, 467, 1147 Gutermuth, R. A., Megeath, S. T., Muzerolle, J., et al. 2004, ApJS, 154, 374 Haisch, Jr., K. E., Lada, E. A., & Lada, C. J. 2001, ApJ, 553, L153 Hartmann, L., Calvet, N., Gullbring, E., & D’Alessio, P. 1998, ApJ, 495, 385 Henize, K. G., & Mendoza, V, E. E. 1973, ApJ, 180, 115 Henning, T., Pfau, W., Zinnecker, H., & Prusti, T. 1993, A&A, 276, 129 Huélamo, N., Bouy, H., Pinte, C., et al. 2010, A&A, 523, A42 Huélamo, N., Lacour, S., Tuthill, P., et al. 2011, A&A, 528, L7 Hughes, A. M., Wilner, D. J., Qi, C., & Hogerheijde, M. R. 2008, ApJ, 678, 1119 Ireland, M. J., & Kraus, A. L. 2008, ApJ, 678, L59 Kessler-Silacci, J. E., Hillenbrand, L. A., Blake, G. A., & Meyer, M. R. 2005, ApJ, 622, 404 Kim, K. H., Watson, D. M., Manoj, P., et al. 2009, ApJ, 700, 1017 Lada, C. J., & Wilking, B. A. 1984, ApJ, 287, 610 Lada, C. J., Muench, A. A., Luhman, K. L., et al. 2006, AJ, 131, 1574 Lafrenière, D., Jayawardhana, R., Brandeker, A., Ahmic, M., & van Kerkwijk, M. H. 2008, ApJ, 683, 844 Lebouteiller, V., Barry, D. J., Spoon, H. W. W., et al. 2011, ApJS, 196, 8 Luhman, K. L. 2004, ApJ, 602, 816 Luhman, K. L. 2007, ApJS, 173, 104 Luhman, K. L., & Muench, A. A. 2008, ApJ, 684, 654 Luhman, K. L., Allen, L. E., Allen, P. R., et al. 2008, ApJ, 675, 1375 Manoj, P., Kim, K. H., Furlan, E., et al. 2011, ApJS, 193, 11 Martin, D. C., Fanson, J., Schiminovich, D., et al. 2005, ApJ, 619, L1 Matrà, L., Merín, B., Alves de Oliveira, C., et al. 2012, A&A, 548, A111 Meeus, G., Waters, L. B. F. M., Bouwman, J., et al. 2001, A&A, 365, 476 Merín, B., Brown, J. M., Oliveira, I., et al. 2010, ApJ, 718, 1200 Murakami, H., Baba, H., Barthel, P., et al. 2007, PASJ, 59, 369 Muzerolle, J., Allen, L. E., Megeath, S. T., Hernández, J., & Gutermuth, R. A. 2010, ApJ, 708, 1107 Nagel, E., Espaillat, C., D’Alessio, P., & Calvet, N. 2012, ApJ, 747, 139 Nguyen, D. C., Brandeker, A., van Kerkwijk, M. H., & Jayawardhana, R. 2012, ApJ, 745, 119 Olofsson, J., Augereau, J., van Dishoeck, E. F., et al. 2009, A&A, 507, 327 Ott, S. 2010, in Astronomical Data Analysis Software and Systems XIX, eds. Y. Mizumoto, K.-I. Morita, & M. Ohishi, ASP Conf. Ser., 434, 139 Papaloizou, J. C. B., Nelson, R. P., Kley, W., Masset, F. S., & Artymowicz, P. 2007, Protostars and Planets V, 655 Pilbratt, G. L., Riedinger, J. R., Passvogel, T., et al. 2010, A&A, 518, L1 Poglitsch, A., Waelkens, C., Geis, N., et al. 2010, A&A, 518, L2 Preibisch, T. 1997, A&A, 320, 525 Pringle, J. E. 1981, ARA&A, 19, 137 Rice, W. K. M., Wood, K., Armitage, P. J., Whitney, B. A., & Bjorkman, J. E. 2003, MNRAS, 342, 79 Robberto, M., Spina, L., Da Rio, N., et al. 2012, AJ, 144, 83 Roussel, H. 2012 [arXiv:1205.2576] Rydgren, A. E. 1980, AJ, 85, 444 Savage, R. S., & Oliver, S. 2007, ApJ, 661, 1339 Sicilia-Aguilar, A., Hartmann, L., Calvet, N., et al. 2006, ApJ, 638, 897 Sicilia-Aguilar, A., Henning, T., & Hartmann, L. W. 2010, ApJ, 710, 597 Skrutskie, M. F., Cutri, R. M., Stiening, R., et al. 2006, AJ, 131, 1163 Spezzi, L., Alcalá, J. M., Covino, E., et al. 2008, ApJ, 680, 1295 Spezzi, L., de Marchi, G., Panagia, N., Sicilia-Aguilar, A., & Ercolano, B. 2012, MNRAS, 421, 78 Stapelfeldt, K., & Moneti, A. 1999, in The Universe as Seen by ISO, eds. P. Cox, & M. Kessler, ESA SP, 427, 521 Strom, K. M., Strom, S. E., Edwards, S., Cabrit, S., & Skrutskie, M. F. 1989, AJ, 97, 1451 Takami, M., Bailey, J., & Chrysostomou, A. 2003, A&A, 397, 675 Tanaka, H., Himeno, Y., & Ida, S. 2005, ApJ, 625, 414 van Boekel, R., Min, M., Waters, L. B. F. M., et al. 2005, A&A, 437, 189 Vicente, S. M., & Alves, J. 2005, A&A, 441, 195 Vogt, N., Schmidt, T. O. B., Neuhäuser, R., et al. 2012, A&A, 546, A63 Whittet, D. C. B., Prusti, T., Franco, G. A. P., et al. 1997, A&A, 327, 1194 Williams, J. P., & Cieza, L. A. 2011, ARA&A, 49, 67 Winston, E., Cox, N. L. J., Prusti, T., et al. 2012, A&A, 545, A145 Wood, K., Lada, C. J., Bjorkman, J. E., et al. 2002, ApJ, 567, 1183 Wright, E. L., Eisenhardt, P. R. M., Mainzer, A. K., et al. 2010, AJ, 140, 1868 Young, K. E., Harvey, P. M., Brooke, T. Y., et al. 2005, ApJ, 628, 283 Pages 10 to 11 are available in the electronic edition of the journal at http://www.aanda.org A115, page 9 of 11
- 10. A&A 552, A115 (2013) Appendix A: Literature review of the individual transitional objects detected with Herschel A.1. CS Cha CS Cha was first studied by Gauvin & Strom (1992), who found evidence that it harbors a disk with inner holes. It is known to be a spectroscopic binary system, as confirmed by Guenther et al. (2007) (period ≥7 years, minimum mass of the compan- ion ∼0.1 M ), although previously Takami et al. (2003) sug- gested this option based on the large gap found in its disk. This previously unknown feature is probably the reason for the spectral type inconsistency found in the literature (Henize & Mendoza 1973; Appenzeller 1977; Rydgren 1980; Appenzeller et al. 1983; Luhman 2004). In this study we used the K6 spec- tral type found by Luhman (2007). The binary nature makes the disk around CS Cha into a circumbinary disk. The disk has been modeled intensively, initially excluding the effect of the binary system (Espaillat et al. 2007, 2011) and evidence of an inner hole of ∼40 AU was found. Espaillat et al. (2011) also pointed out the need for a different mass distribution in CS Cha com- pared to that of disks around single stars. A more recent analysis by Nagel et al. (2012) also accounted for the binary effect. To reproduce the variations found at the IR wavelengths, the model includes the emission from the inner disk structure generated by the double system, with a ring and streams of material falling from the ring to the circumstellar disks around the individual stars. Another 2MASS source is found at 5 away. It is 6 magni- tudes weaker than CS Cha in the 2MASS J band and undetected in the rest of the 2MASS bands. Contamination from this object is therefore very unlikely. CS Cha is located in front of a bright background. Therefore, the SPIRE fluxes are very likely underestimated because the background emission was probably overestimated during the photometry extraction. A.2. SZ Cha This source was cataloged as a K0 star by Rydgren (1980) and was first identified as a disk with a possible inner gap by Gauvin & Strom (1992). Luhman (2007) reviewed its properties, and it was lately confirmed by Kim et al. (2009) as a transitional disk. It has sometimes been referred to as a pretransitional disk, given the small excess found at 3−10 µm. The first modeling results by Kim et al. (2009) suggested an inner disk radius of ∼30 AU. Espaillat et al. (2011) modeled this object in detail, noting flux variations from IRS spectra at different epochs on periods shorter than three years. These variations are attributed to changes in the height of the optically thick disk wall (from 0.006 to 0.08 AU), and they do not modify the 10 µm silicate emission feature. SZ is known to be a wide binary (Vogt et al. 2012). A companion is found at ∼5 (projected distance of 845 AU), which could be causing truncation of the outer disk. The contribution of this source to the total measured fluxes in this study is likely to be negligible, since it is 4 magnitudes weaker than SZ Cha in the 2MASS J band. However, the possibility of an increase in its FIR measurements cannot be excluded. A.3. T25 T25 was identified as an M3 star by Luhman et al. (2008) and was found to be a transitional disk by Kim et al. (2009). The lack of IR excess at wavelengths <8 µm indicates that the inner regions of the disk are well depleted of small dust particles. The modeling by Kim et al. (2009) yields an inner radius of 8 AU for the disk. It is the only detected transitional object, together with T35, lacking the silicates feature at 10 µm, another indication of an efficient depletion of small particles in the inner disk region. T25 has no known stellar companions (Nguyen et al. 2012). A.4. T35 Gauvin & Strom (1992) classified this source as an M0 star, and it was later identified as a possible a pretransitional disk by Kim et al. (2009) because it displays weak excess at short IR wavelengths. In this case, the inner disk radius is located at 15 AU (Espaillat et al. 2011). As in T25, there is no sign of sili- cate emission. The excess at 70 µm is lower than in other cases, but does not resemble the typical Class II SED. It has no con- firmed known stellar or substellar companions (Nguyen et al. 2012). However, recent sparse aperture masking observations of this source by Cieza et al. (2013) showed and asymmetry in its K-band flux. On the basis of modeling, these authors found the inner disk radius to be ∼8.3 AU. They were also unable to distin- guish between the close-companion scenario and the asymmetry being produced by the starlight scattered off the disk itself. A.5. T56 This source was found to be an M0.5 start in Gauvin & Strom (1992). Kim et al. (2009) identified it as a transitional disk with a inner disk radius of 18 AU. As in the other transitional disks in this study, its excess is higher than the expected Class II flux at the PACS bands. It has no known bound companions (Nguyen et al. 2012). A.6. ISO-ChaI 52 ISO-ChaI 52 is an M4 star (Luhman 2004). Espaillat et al. (2011) proposed it as a transitional disk, finding the source to be an ex- treme case among their sample: based on variations of its Spitzer spectrum, models require the inner wall height to increase by about 400% (from 0.0006 to 0.003 AU). We also found it to be an outlier in the sense that it has the flattest SED between 12 and 70 µm. No bound companions are known for ISO-ChaI 52 (Nguyen et al. 2012). A.7. CR Cha CR Cha is an M0.5 star (Gauvin & Strom 1992). Furlan et al. (2009) found it to be an outlier in their sample when compar- ing the equivalent width of the silicates emission and the spec- tral slope between 13 and 31 µm: it was beyond the parameter space considered in their study. The explanation given in Furlan et al. (2009) is that this source could be a pretransitional disk. For this reason, Espaillat et al. (2011) included it in their sam- ple of transitional disks. In this study, we found this object to be compatible with a Class II object. It is also located among other Class II objects using the proposed classification method (Fig.2). Therefore, although we cannot completely rule out the possibility that this object is in a pretransitional disk phase given its strong silicates emission, it would be in a very early stage of the transitional phase. A115, page 10 of 11
- 11. Á. Ribas et al.: Identification of transitional disks in Chamaeleon with Herschel A.8. WW Cha This source was first classified as a K5 object by Gauvin & Strom (1992). It was included in the analysis of Espaillat et al. (2011) for the same reason as CR Cha, and modeled as a pretran- sitional disk. Comparison with the median SED of the Class II sources shows that WW Cha is well above the median. The SED of WW Cha resembles a typical Class II object, probably still embedded in the core, as suggested by its high extinction (Av ∼ 4.8 mag) and its position in the Herschel maps. The dusty environment in which it is located could significantly pollute the photometry and, hence, our conclusions about this object. A.9. T54 T54 is known to be a misclassified transitional disk (Matrà et al. 2012), and therefore we excluded it from our analysis. The Herschel images show contamination from close-by extended emission, which affected our photometry and, hence, our con- clusions. The non-transitional nature of this object is also sup- ported by the fact that it would be the only transitional disk in our sample with no excess emission at 70 µm with respect to the median SED Class II disks. A115, page 11 of 11