
Recommended
More Related Content
What's hot
What's hot (19)
Viewers also liked
Similar to 11 12 sfs ms mathematics scope & seq
Similar to 11 12 sfs ms mathematics scope & seq (20)
More from Ross
More from Ross (20)
11 12 sfs ms mathematics scope & seq
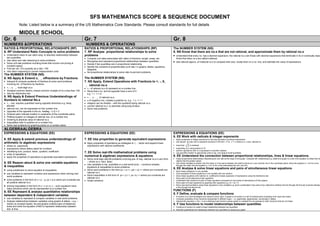
- 1. SFS MATHEMATICS SCOPE & SEQUENCE DOCUMENT Note: Listed below is a summary of the US Mathematics Core Standards. Please consult standards for full details MIDDLE SCHOOL Gr. 6 Gr. 7 Gr. 8 NUMBERS &OPERATIONS NUMBERS & OPERATIONS RATIOS & PROPORTIONAL RELATIONSHIPS (RP) RATIOS & PROPORTIONAL RELATIONSHIPS (RP) The NUMBER SYSTEM (NS) 6. RP Understand Ratio Concepts to solve problems 7. RP Analyse proportional relationships to solve 8. NS Know that there are no.s that are not rational, and approximate them by rational no.s Understand ration & use ration lang. to describe relationships between problems Understand that every no. has a decimal expansion; the rational no.s are those with decimal expansions that terminate in 0s or eventually repea two quantities Compute unit rates associated with ratios of fractions, length, areas, etc Know that other no.s are called irrational. Use ration and rate reasoning to solve problems Recognise and represent proportional relationships between quantities. Use rational approx..of irrational no.s to compare their size, locate them on a no. line, and estimate the value of expressions Solve unit rate problems including those that involve unit pricing & Decide if two quantities are in proportional relationship constant speed. Identify the constant of proportionality (unit rate ( in graphs, tables, equations, Find per cet. Of a quantity as a rate / 100 diagrams Use ration reasoning to convert measurement units Se proportional relationships to solve ratio & per/cent problems. The NUMBER SYSTEM (NS) 6. NS Apply & Extend x, ¸ offractions by Fractions The NUMBER SYSTEM (NS) Interpret & compute quotients of fractions & solve word problems 7. NS Apply, Extend Operations with Fractions to +, -, X, involving div. of fractions by fractions ¸ +, -, x, multi-digit no.s ¸ rational no.s +,- of rational no.s & represent on a number line Greatest common factors; lowest common multiple of no.s less than 100. Show that a no. and its opposite have a sum of 0 Use the distributive law. e.g. 1 + -1 = 0 6. NS Apply & Extend Previous Understandings of ¸ +, - , x , of rational no.s Numbers to rational No.s x of negative nos. creates a positive no. e.g. -1 x -1 = 1 +, - nos. express quantities having opposite directions e.g. temp, integers can be divided – with the quotients being rational no.s elevator convert rational no.s to decimals using long division rational nos. can be expressed on the number line. Solve real problems. Opposite of the opposite is the no. itselfeg. –(-3) = 3 Ordered pairs indicate location in quadrants of the coordinate plane. Plotting location on integers & rational nos. on a number line Ordering & absolute value of rational no.s Inequalities refer to position on a number line. Solve real problems by graphing points on a number plane ALGEBRAALGEBRA EXPRESSIONS & EQUATIONS (EE) EXPRESSIONS & EQUATIONS (EE) EXPRESSIONS & EQUATIONS (EE) 8. EE Work with radicals & integer exponents 6. EE Apply & extend previous understandings of 7. EE Use properties to generate equivalent expressions Apply properties of integer exponents to forming equivalent numerical expressions Use square & cube root to represent solutions in the form x2=p , x3 = p where p is a pos. rational no. arithmetic to algebraic expressions Apply properties of operations as strategies to +, -, factor and expand linear whole no. exponents expressions with rational coefficients know that 2 is irrational expressions where letters stand for numbers expanding no.s using powers of 10 identifying sum, product, factor, quotient, coefficient perform operations with no.s expressed in scientific notation 7. EE Solve real-life mathematical problems using use scientific notation & appropriate units to rep. very large & small quantities. order of operations apply the properties of operations to generate equivalent expressions numerical & algebraic expressions & equations 8. EE Understand the connection between proportional relationships, lines & linear equations. Solve multi-step real-life problems involving pos. & neg. rational no.s in any form Graph proportional relationships interpreting the unit rate as the slope of the graph. Compare diff. relationships e.g. dist& time graph to a dist- time equation to determine wh – whole no.s, fract. &dec. objects has the greater speed. 6. EE Reason about & solve one variable equations Use similar triangles to explain why the slope m is the same between two distinct points on a non-vertical; line in the coordinate plane; show the equation y = mx for a line Use variables to rep. quantities in a real-world prob. – construct simples through the origin and the equation y = mx +b for a line intercepting the vert. axis at b & inequalities equations & inequalities to solve problems. Solve word problems in the form px + q = r, p(x + q) = r where pro-numerals are 8. EE Analyse & solve linear equations and pairs of simultaneous linear equations using substitution to solve equation & inequalities Solve linear equations in one variable rational no.s Give examples of linear equations in one variable with one solution use variables to represent numbers and expressions when solving real- world problems Solve inequalities in the form of px + q > r, px +q < r where pro-numerals are Solve linear equations with rational no. coefficients include expansion of expressions using the distributive law rational no.s Solve pairs of simultaneous linear equations solve problems in the form of x + p – q, px = q in which pro-numerals are Graph solutions Understand that solutions of pairs of linear equations correspond to the points of intersections of their graphs all positive rational no.s Solve pairs of linear equations by graphing their equations e.g. 3x + 2y = 5 Solve real-world problems using linear equations in two variables e.g. given coordinates fr two pairs of pt,s determine whether the line through the first set of points intersec solving inequalities in the form of x > c or x< c – such equations have a line through the second set. many solutions which can be represented on a number line. 6. EE Represent & analyse quantitative relationships FUNCTIONS (F) 8. F Define, evaluate & compare functions between dependent & independent variables A function is a rule that assigns one output to every input. A graph of a function is a set of ordered pairs consisting of an input and output use variables to represent & compare variables in real world problems Compare properties of two functions represented in different ways – i.e. graphically, algebraically, numerically in tables Analyse relationships between variables using graphs & tables – e.g. – Interpret the equation y =mx + b as a defining linear function whose graph is a straight line as opposed to other functions that are not linear. motion at constant speed, list and graphs ordered pairs of distances, 8. F Use functions to model relationships between quantities times and write the equation d=65t to represent relationship between Construct a function to model a linear relationship between two quantities dist. & time Describe qualitatively the relationship between two quantities by analyzing a graph
- 2. GEOMETRY (G) GEOMETRY (G) 6. G Solve real- world & mathematical problems 7. G Draw, construct & describe geometrical figures & 8. G Understand congruence & similarity using physical models, transparencies, or geometrical involving area, surface area, and volume describe the relationships between them. software. Find the area of triangles, quadrilaterals, polygons by breaking them into Solve problems involving scale drawings of geometrical figures – including Verify properties of rotation, reflections, and translations known shapes i.e. triangles computing actual length and areas from scaled drawing & representing the scale 2D shapes are congruent if they can be obtained from each other by a series of rotations, reflections, translations & dilations Find the volume of a rectangular prism using unit cubes to show that the drawing at a different scale. use formal arguments to est. facts about the angles sum and exterior angles of triangles, about angles created by parallel lines cut by a transve formula for volume is L x B x H. Apply the formula Draw (freehand, with devices & technology) geometrical shapes with different Draw polygons in a coordinate plane given the coordinates for the 8. G Understand & apply the Pythagorean Theorem conditions. vertices, Represent 3D shapes using nets for rectangles, triangles, use the nets Describe 2D shapes made from slicing 3D shapes – rectangular prism, square explain a proof for the Pythagorean Theorem and its converse to find the area of these figures based pyramid Apply the Pythagorean Theorem to finding the unknown side of triangles Apply the Pythagorean Theorem to find the distance between two points in a coordinate system – number plane. 7. G Solve real-life & mathematical problems involving angles measure, area, surface area, and volume. 8. G Solve real-world & mathematical problems involving cylinders, cones and spheres. Know the formulas of the area & circumference of a circle and solve problems; Know and apply the formulas for the volume of cons, cylinders, and spheres Use facts about supplementary & complementary, vertical and adjacent angle to solve multistep equations for an unknown angle. Solve real-world problems involving area, volume & surface area of 2D & 3D objects – composed of triangles, quadrilaterals, polygons, cubes, and prisms STATISTICS & PROBABILITY(SP)STATISTICS& PROBABILITY (SP) 6.SP Develop understanding of statistical variability 7. SP Use random sampling to draw inferences about a 8. SP Investigate patterns of association in bivariate data. Recognise that statistics anticipates variability in data population Construct and interpret scatter plots for bivariate measurement data to investigate patterns of association between two quantities. Describe Understand that statistics can be used to gather information about a population patterns such as clustering, outliners, positive or negative association, linear association, and nonlinear association. Understands that data has a distribution described by its centre Know that straight lines are widely used to model relationships between two quantitative variables. (median), spread (range) and overall shape (frequency distribution) by examining a sample of the population, generalisations about the population from a sample are valid only if the sample is representative of that population. Use the equation of a linear model to solve problems in the context of bivariate measurement data, interpreting the slope and intercept. Understand that random sampling tends to produce representative samples and Understand that patterns of association can also be seen in bivariate categorical data by displaying frequencies and relative frequencies in a tw 6.SP Summarize & describe distributions. support valid inferences. way table. Construct such a table that summarises data on two categorical variables collected from the same subjects. Use relative frequencie Display data in plots on a number line – i.e. dot plots, histogram, box Use data from a random sample to draw inferences about a population with an calculated for rows or columns to describe possible association between two variables. plots unknown characteristic of interest. Summarises data according to: no. of observations; nature of the attribute, how it was measured and its units of measure; giving 7. SP Draw informal comparative inferences about two quantitative measures of centre (median, mean) and variability or populations. deviation. As well as describing any pattern or deviations from the pattern. Informally assess the degree of visual overlap of to numerical data distributions Relating choice of measures of centre and variability to the shape of the with similar variables. data distribution and the context in which the data was gathered. Use measures of centre and measures of variables for numerical data from random samples to draw informal comparative inferences about two populations. 7.SP Investigate chance processes and develop, se and evaluate probability models. Understand that the probability of chance expresses the likelihood of the event occurring – o indicate unlikely event; ½ indicates neutrality; 1 indicates event is likely to occur. Approximate the probability of chance by collecting data and observing its frequency and predict the relative frequency given the probability Develop a probability model and use it to find probabilities of events. Develop a uniform probability model by assigning equal probability to all outcomes and then use the model to determine probabilities of events. Find probabilities of compound events using lists, tables, tree diagrams, and simulation. Understand that the probability of a compound evetn is the fraction of outcomes in the sample space for which the compound event occurs. Represent sample space for compound events using lists, tables, tree diagrams, Identify the outcomes in the sample space which compose the event. Design and use a simulation to generate frequencies for compound events