1) Ionospheric TEC disturbances were observed in South Korea following the 2011 Tohoku earthquake in Japan. Impulsive TEC enhancements were first observed approximately 16.5 minutes after the earthquake.
2) Small-scale TIDs with a period of around 4 minutes were observed from 6:15-7:10 UT. Medium-scale TIDs with a period of around 15 minutes and duration of 60 minutes were also observed. The amplitude of the medium-scale TIDs was seen to dampen clearly over time.
3) Detailed analysis of GPS data from a station in South Korea found repeated short-period oscillations in TEC variations from 07:15-08:15 UT, indicating regular
Design For Accessibility: Getting it right from the start
Ionospheric TEC Disturbances over South KoreaFollowing the 2011 Great Tohoku Earthquake
1. Research Inventy: International Journal of Engineering And Science
Vol.6, Issue 6 (July 2016), PP -35-42
Issn (e): 2278-4721, Issn (p):2319-6483, www.researchinventy.com
35
Ionospheric TEC Disturbances over South KoreaFollowing the
2011 Great Tohoku Earthquake
1
Byung-Kyu Choi, 2
Sang Jeong Lee, 3
Ha Su Yoon
1,3
Space Geodesy Group, Space Science Division, Korea Astronomy and Space Science Institute (KASI)
2
Department of Electronics Engineering, Chungnam National University
Abstract: Ionospheric total electron contents (TEC) disturbances following the 2011 great Tohoku earthquake
on March 11, 2011 were observed by a GPS network in South Korea. The impulsive TEC enhancements were
first observed approximately 16.5 minutes after the beginning of the earthquake. Various types of seismic waves
were also observed over South Korea.To investigate more detailed disturbances in the TEC, we processed the
GPS data with a sampling rate of 1Hz and applied a band-pass filter with corner frequencies of 0.0 and 0.005
Hz. Small-scale traveling ionospheric disturbances (TIDs) with a period of approximately 4minutes (~250
seconds) were observed from 6:15 to 7:10 UT. These variations are considered to be a clear manifestation of the
acoustic resonance oscillations. We also observed medium-scale TIDs with a period of approximately 15
minutes and a duration of approximately 60 minutes. A remarkable finding is that the damping of the amplitude
of the medium-scale TIDs was observed clearly in the time series.
Keywords:ionosphere; earthquake; TEC; disturbance.
I. Introduction
Sudden ionospheric disturbances can be caused by a variety of factors, including solar flares,
geomagnetic storms, space weather and seismic events. Various studies of disturbances of the ionospheric total
electron content (TEC) following seismic eventshave been conducted with the global positioning system (GPS)
have been investigated for two decades (Heki and Ping, 2005; Otsuka et al., 2006, Choosakulet al., 2009).Heki
and Ping (2005) showed directivity and clear velocity of thecoseismic ionospheric disturbance (CID) triggered
by the 2003 Tokachi-Oki earthquake (Mw 8.0) with a GPS network in Japan. Otsuka et al. (2006)detected
ionospheric TEC enhancements induced by large earthquakes. Their report was based on GPS data from
Indonesia and Thailand. They also found the enhancement of ionospheric TEC on the northwards of the
epicenter with cycles of 14 to 40 minutes after the 2004 Sumatra-Andaman earthquake.In particular, Choosakul
et al. (2009) reported a periodic oscillation of ionospheric TEC measured by a GPS network following the 2004
Sumatra earthquake. It lasted for more than three hours in the vicinity of the epicenter and had an obvious
periodicity at 3.7 mHz and 4.4 mHz.
Recently,a massive earthquake with a magnitude of 9.0 occurred in the Tohoku area, on the east coast
of Honshu, Japan (38.322°N, 142.369°E, depth 32km) at 05:46:23 UT (universal time) on 11 March 2011. The
ionospheric disturbances generated by this large earthquakeand tsunami have been analyzed by many
investigators (Maruyama et al., 2011; Matsumura et al., 2011; Saito et al., 2011; Tsugawaet al., 2011; Tsai et al.,
2001; Liu et al., 2011; Rolland et al., 2011). Maruyama et al. (2011) observed ionospheric disturbances in
ionograms obtained at the four ionosondes in Japan. Matsumura et al. (2011)reported that ionospheric TEC
oscillations induced by the Tohoku earthquake show a good agreement with simulated atmospheric
perturbations. This result indicates that ionospheric oscillations are associated with the motion of the neutral
atmosphere. Saito et al. (2011) revealed that a displacement of the sea surface caused by the earthquake
inducedatmospheric waves, which propagated upwards to the thermosphere. Tsugawaet al. (2011) detected
ionospheric TEC disturbances following the Tohoku earthquake with a dense GPS network in Japan. They
calculated the vertical TECfrom data recorded at a GPS station and also found that the sudden depletions of the
TEC and the short-period oscillations after the earthquake were observed in the signals of some GPS satellites.
Tsai et al. (2011) studied the ionospheric signature induced by the Tohoku earthquake with a network of several
GPS facilities, including GEONET in Japan, 7 IGS sites, and Taiwan stations. These authors indicated that the
ionospheric perturbations are primarilyproduced by the earthquake. Liu et al. (2011) observed remarkable
signatures, including Rayleigh waves, acoustic gravity waves, and tsunami waves triggered by the M9.0 Tohoku
earthquake. These phenomena were observed from the ground-based GPS networks in Japan and Taiwan.
Rolland et al. (2011) analyzed the ionosphere TEC variations associated with the Tohoku earthquake. They also
observed three different types of wave: the Rayleigh surface waves, acoustic waves and gravity waves. These
observations show good agreement with the observations of Liu et al. (2011).
GPS data can be used to observe the ionospheric disturbances recorded following large earthquakes.
Ground-based GPS dataallow the detection of anomalies in the ionospheric TEC.In this paper, we processedGPS
2. Ionospheric TEC Disturbances Over South Korea Following The 2011 Great Tohoku Earthquake
36
data from 9 ground-based GPS reference stations in the Korean GPS network (KGN)to detect various types of
the ionospheric TEC disturbances induced by the 2011 great Tohoku earthquake.
This paper also focuses ona detailed investigation of a periodic oscillation and the high-resolution
observation of the TEC disturbancesinduced by the Tohoku earthquake. For this purpose, we used GPS data
with two different sampling parameters: a sampling interval of 30 sec and a sampling rate of 1Hz.
II. GPS Data And Method
To investigate ionospheric disturbances over South Korea following the Tohoku earthquake, we
processed the GPS data obtained from the KGN in South Korea (9 GPS stations designated as ‘daej’, ‘bhao’,
‘jeju’, ‘kohg’, ‘mlyn’, ‘mkpo’, ‘sbao’, ‘skch’ and‘skma’).The estimation methods used to extract TEC
information from GPS signals have beendescribed by several investigators (Klobuchar et al., 1994; Klobuchar,
1996; Jakowskiet al., 1996).
The fundamental equations for the code and carrier phase measurements can be expressed as follows
(Schaer, 1999).
P = ρ + c ∙ 𝑑𝑡 𝑠
− 𝑑𝑡 𝑟 + c ∙ 𝑑 𝑠
+ 𝑑 𝑟 + 𝑑𝑖𝑜𝑛 + 𝑑𝑡𝑟𝑜𝑝 + εP (1)
Φ = ρ + c ∙ 𝑑𝑡 𝑠
− 𝑑𝑡 𝑟 − 𝑑𝑖𝑜𝑛 + 𝑑𝑡𝑟𝑜𝑝 + λ ∙ N + εΦ(2)
Where,
ρtrue geometric range from satellite to receiver (m)
𝑑𝑡 𝑠
satellite clock error (s)
𝑑𝑡 𝑟receiver clock error (s)
𝑑 𝑠
satellite hardware bias (s)
𝑑 𝑟receiver hardware bias (s)
cspeed of light in a vacuum (m/s)
𝑑𝑖𝑜𝑛 ionospheric delay (m)
𝑑𝑡𝑟𝑜𝑝 tropospheric delay (m)
λwavelength of frequency (m)
N carrier phase integer ambiguity (cycle)
εmeasurement noises (m)
The estimated TEC values derived from the code measurements have a large uncertainty due to the
high noise. The carrier phase measurements are much more accurate than the code measurements, but carrier
phase measurements require the resolution of phase ambiguity and consideration of infrequent cycle slips. To
obtain better accuracy for the derived GPS-TEC, a smoothing technique is employed with the code and carrier
phase measurements. The smoothed code with the carrier phase is described as follows:
𝑃(𝑡) 𝑠𝑚 = ω ∙ P t + 1 − ω ∙ {𝑃 𝑡 − 1 𝑠𝑚 + λ ∙ Φ t − Φ t − 1 } (3)
WhereP(t)and Φ(t)are the pseudo-range and carrier phase measurements. The term ω is the
smoothing factor. The term𝑃(𝑡) 𝑠𝑚 is the smoothed code. To calculate the ionospheric TEC, we adopted the
common model in which the ionosphere consists of a thin shell at a fixed height, usually 350 km. Slant TEC is a
measure of the total electron content of the ionosphere along the ray path. It can be easily computed from the
following Eq.(4).
STEC =
1
40.3
(
𝑓1
2∙𝑓2
2
𝑓1
2−𝑓2
2)(𝑃2 − 𝑃1 + 𝐷 𝑠
+ 𝐷𝑟 ) (4)
Where,𝐷 𝑠
= 𝑑2
𝑠
− 𝑑1
𝑠
and 𝐷𝑟 = 𝑑2𝑟 − 𝑑1𝑟are the differential code bias (DCB) of the satellite and the
receiver, respectively. It is well known that these biases significantly affect the ionospheric TEC value (Ma and
Maruyama, 2003; Choi et al., 2011).The DCB values were obtained with weighted least squares and applied to
the daily averaged estimates.
In this study, we obtained TEC values from ground-based GPS data with a 30 secondsampling interval.
In addition, we processed GPS data with a 1Hz sampling rate from the ‘daej’GPS stationto allow more detailed
investigation of the TEC disturbances.The time-differenced vertical TEC for each GPS receiver-satellite pair
was considered to reveal the variation in the TEC due to the earthquake and the tsunami.To enhance the
coherence of the characteristics of seismic-wave propagation, aband-pass filter was also applied tothe TEC time
series.
3. Ionospheric TEC Disturbances Over South Korea Following The 2011 Great Tohoku Earthquake
37
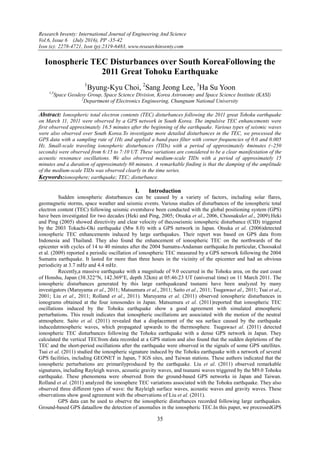
Figure1 The locations of 9 GPS reference stations in South Korea (green dots). The IPPs for the PRN 26 (red
line) and PRN 27 (blue line) satellite-receiver pairs on March 11, 2011. The digits represent the corresponding
UT hours.
Figure 2 The vertical TEC variations of the PRN 26 satellite observed from 9 GPS stations in South Korea on
March 11, 2011.
III. Results
To study the ionospheric disturbances over South Korea following the 2011 Tohoku earthquake, we
processed GPS data from the KGN in South Korea.
Figure 1 shows the IPPs for the PRN 26 and PRN 27 satellites. The IPPs for the PRN 26 satellite are
approaching the epicenter across the Korean Peninsula. The IPPs for the PRN 27 satellite resemble those of
PRN 26. They remained in the vicinity of South Korea for almost three hours after the onset of the earthquake.
The digits represent the corresponding time.
Figure 2shows the time series of the vertical TEC of the PRN 26 satellite observed by 9 GPS reference
stations in South Korea. The vertical TEC estimated from all GPS sites showed impulsive enhancements with
amplitudes of 0.5~1 TECU at 06:02 UT. After the impulsive TEC enhancements, sudden decreases in the
vertical TEC were observed. Compared with the TEC before the impulsive enhancements, the average
amplitude of the TEC decreases was approximately 1 TEC. Small-scale TEC perturbations, weaker than 0.5
TEC,appeared during short periods from 06:00 UT to 06:30 UT. Tsugawa et al. (2011) reported a decrease of 20%
in the TEC measurements relative to the previous TEC value (before the depletions occurred) over Japan.
Figure 3represents the time series of the time-differenced vertical TEC (TECU/30sec) of the PRN 26
satellite at 9 GPS stations. We considered the distance from the GPS stations to the epicenter.The ‘bhao’ station
in South Korea was closest to the epicenterand the ‘jeju’ station wasthe farthest from the epicenter. The
4. Ionospheric TEC Disturbances Over South Korea Following The 2011 Great Tohoku Earthquake
38
Figure 3 The time-differenced vertical TEC of the PRN 26 satellite at 9 GPS stations on March 11, 2011. The y-
axis shows the 4 characters used to represent the site name. The red line indicates the beginning of the
earthquake.
Figure 4 The vertical TEC variations of the PRN 27 satellite observed from 9 GPS stations in South Korea on
March 11, 2011.
behaviours of the time-differenced TEC (TEC/30 sec) before the earthquake were very quiet. No remarkable
variations in the TEC were observed over South Koreafor approximately16minutes after the earthquake.
Irregular fluctuations in the TEC were firstobserved at 06:02 UT over almost all of South Korea.However,few
time differences in the arrival of the disturbances were observed. It is known that the seismic perturbations
triggered by the earthquake affected the ionospheric TEC over South Korea. Liu et al. (2011) reported that these
perturbations are described as seismo-traveling ionospheric disturbances (STIDs). A remarkable finding is that
the impulsive variations in the TEC estimated by the ‘jeju’ station were relatively higher than those estimated by
the other stations. This difference could be associated with the direction of propagation of the first large-scale
circular waves triggered by the earthquake.According to Heki and Ping (2005), a CID is only detected in a
magnetic equatorward direction due to magnetic field inclination. Tohoku earthquake observations showed clear
north-south asymmetry of the CID exited by the Rayleigh wave (Yoshihoet al., 2013). Therefore our result is
related to an asymmetry of the CID.
Figure 4 shows thetime series of the vertical TECof the PRN 27 satellite observed by 9 GPS stations
from 05:00 UT to 09:00 UT. The TEC variations showed no remarkable features before 07:15 UT. Weak
fluctuations in the TEC variations with a period of approximately 15 min were just observable from 07:15to
08:15 UT.These fluctuations were identified as the slower CID propagated in all direction from the tsunami
source.
5. Ionospheric TEC Disturbances Over South Korea Following The 2011 Great Tohoku Earthquake
39
Figure 5 The time-differenced vertical TEC of the PRN 27 satellite at 9 GPS stations on March 11, 2011. The y-
axis shows the 4 characters used to represent the site name.
Figure 5shows the time series of the time-differenced vertical TEC(TEC/30 sec) of the PRN 27 satellite.
As shown in Figure 5(a), the initial ionospheric TEC disturbances appeared at 06:02 UT. The absolute amplitude
of the TEC variations in the short period wasapproximately0.3 TEC. Following the impulsive perturbations, no
further features of the TEC variations were observed until 07:15 UT. However, remarkable small TEC
fluctuations, not shown by Figure 6, were observed after 07:15 UT all over South Korea. As shown in Figure
5(b), our results indicate that regular wave patterns in the TEC variationswere clearly observed for one hour
from 07:15 UT to 08:15 UT. These waves, shown in Figure 5(b),also exhibited repeatedshort-period
oscillationsover a period of one hour.
Tsugawaet al. (2011) reported that medium-scale concentric waves with a wavelength of 200-300
kmwere observed until after 08:00 UT in western Japan after the propagation of the first large-scale circular
waves triggered by the Tohoku earthquake. Our findings are in good agreement with thisresult.
To investigate more detailed variations in the TEC over South Korea following the Tohoku earthquake,
we processed the GPS data with a sampling rate of 1Hz obtained from the ‘daej’ station and examined the
temporal variation of the TEC data. A band-pass filter with corner frequencies of 0.0 and 0.005 Hz was also
applied to enhance the coherence of the characteristics of seismic-wave propagation.
Figure 6 shows the TEC time series for satellite 26 at the ‘daej’station in South Korea. The behavior of
the vertical TEC decreased linearly approximately 15 minutesafter the beginning of the earthquake. A small
impulsive enhancement with an amplitude of 0.3 TECthen occurred at 06:02 UT.Following the impulsive
enhancement, the TEC showed rapid decreases until 06:07 UT. The amount of the depletion of TEC was
approximately 1.3 TECU relative to the TEC before the impulsive enhancement. The lower image in Figure 6
shows the time series of the time-differenced TEC (dTEC=TEC/1sec).The blue dotted line in Figure 6 represents
the time series of the dTEC obtained from 1Hz data at the‘daej’GPS station. The amplitude of the time-
differenced TEC for the PRN 26 satellite showed a maximum of ~0.03 TEC. From these results, we do not
observe coseismic signatures clearly. However, the application ofa band-pass filter to the TEC variations
allowed us to observe, the features in TEC fluctuations induced by the earthquake. The red line in Figure 6
represents the time series of the band-pass filtered TEC variations. The sudden disturbances of the TEC
variations at 06:02 UT are assumed to result fromthe main shock produced by the earthquake.After the main
shock, small-scale periodic oscillation with a period of about 4 minute was observed continuously. It is
explained that an acoustic wave triggered by a propagating Rayleigh wave shows an atmospheric resonance.
We could also observe remarkable features of theTEC variationsfor a longer time,as shown in Figure
7.Figure 7 presents the time series of the band-pass filtered TEC variationsfrom the PRN 27 satellite. We
observed two types of perturbations in the TEC variations followingthe Tohoku earthquake. Sudden
disturbances in the TEC variations are clearly visible at 06:02 UT. Small amplitude TEC variationswere
observed from 6:15 to 7:15 UT.We detected variations in TEC with a time period of approximately4minutes
(~250 seconds) and a duration of approximately1 hour.To calculate a period of the oscillation, an averaging time
of the consecutive peak-to-peak amplitude was used.The period was kept constant. These variations are
considered to represent a clear instance ofthe acoustic waves. Using 1 Hz sampling TEC data, we have found
that the short-period oscillations (4 minutes) caused by the acoustic resonanceare detected continuously for one
6. Ionospheric TEC Disturbances Over South Korea Following The 2011 Great Tohoku Earthquake
40
Figure 6 TEC time series for satellite 26 calculated with high-resolution GPS data (the sampling rate is 1Hz)
from 05:30-06:45 UT.The upper panelrepresents the TEC time series. The lower panel represents the time series
of the corresponding TEC variations. The red line representsthe band-pass filtered TEC variations, analyzed
using corner frequencies of 0.0 and 0.005 Hz.
Figure 7 TEC time series of satellite 27 calculated with the GPS data with a sampling rate of 1 Hz from 05:00-
09:00 UT.The upper panel represents the TEC time series. The lower panel represents the time series of the
corresponding TEC variations. The red line representsthe band-pass filtered TEC variations.
hours over South Korea. TheseTEC responses agreed with the results of earlier studies (Calais and Minster,
1995; Afraimovichet al., 2006). Moreover, we observed medium-scale TIDs with a period of 15 minutesand a
duration of 60 minutes. These perturbation structures appeared at approximately 07:30 UT and gradually
disappeared after 08:30 UT.They formedintensive quasi-periodic TEC variations. An interesting feature of these
structures is that the amplitude of medium-scale TIDs was clearly observed on the time series.The amplitude of
wave showed a gradual decrease. After 8:30UT, the amplitude became small. This is coincident with the report
by Saito et al. (2011). The amplitude change would be generated by the coupling of acoustic resonance between
the ground surface and the lower thermosphere. Further detailed analysis is necessary to discuss the relationship
between the amplitude change and the TEC variations.The GPS data with a 1 Hz sampling rate enables us to
obtain detailed observations ofthe propagation and attenuation of medium-scale TIDs. Such ionospheric
disturbances were observed for four hours at the northwest of the epicenter, tothe east of South Korea.
IV. Discussion And Summary
Ionospheric TEC disturbances induced by the 2011 Tohoku earthquake on March 11, 2011
wereinvestigated using a GPS network in South Korea. Impulsive TEC enhancements were first observed
7. Ionospheric TEC Disturbances Over South Korea Following The 2011 Great Tohoku Earthquake
41
approximately 16.5 minutes after the beginning of the earthquake. The CID associated with the Rayleigh wave
was observed in west direction (over South Korea) from the epicenter. Astafyevaand Heki(2009) explained that
the shape of the response depends on the location of sub-ionospheric points (SIPs) relative to the epicenter. In
our results, the amplitude of the waves reached the maximum value of 0.9 TECat the ‘jeju’ station and then
decreased to 0.1-0.2 TEC. The SIPsrecorded from the GPS stations in South Korea are located approximately
1,250 km away from the ionospheric epicenter. TheCID propagated with the velocity 1.26km/s from the
epicenter to South Korea. If it is assumed that the STIDs induced on the Earth’s surface reach the ionosphere at
approximately 05:53 UT, the wave speed is 2.31 km/s (1250km/540 seconds), which is within the range of
Rayleigh surface wave speeds.These features are also consistent with previous observations (Astafyevaet al.,
2009; Rolland et al., 2011).
Short-period TEC oscillations were observed more than one hour over South Korea after the
earthquake. Tsugawaet al. (2011) reported that medium-scale concentric waves were observed until after 08:30
UT in western Japan.Large earthquakes can generate acoustic waves and gravity waves which propagate into the
ionosphere and interact with the ionized gases. The oscillation of seismic-waves such as Rayleigh waves,
acoustic waves, gravity waves and tsunami waves triggered by Tohoku earthquakecontinued for four hours
above the epicenter.This implies that the resonance of the acoustic waves was lasted for four hours after
earthquake onset.
To investigate more detailed features of the TEC perturbations, the GPS data from the‘daej’ site with a
sampling rate of 1Hz were processed. We observedclear features of small-scale and medium-scale waves in the
TEC variations in the time series,as shown in Figure 6 and 7. In Figure 6, we could observe signatures of
Rayleigh surface waves and the acoustic gravity waves. The distance of the SIPs of the PRN 26 satelliteand the
ionospheric epicenter was approximately 510km. Therefore the velocity of wave can be easily calculated using
time difference in any direction. Its wave speed was about 1.05 km/s. Heki and Ping (2005) showed that the
acoustic wave speed is about0.6-1.1 km/s at 300 km altitude in the ionosphere. Using numerical simulations,
Matsumura et al. (2011) indicated that the atmospheric waves were generated by a sea surface displacement
induced from the large earthquake, not by a propagting tsunami.
As shown in Figure 7, the acoustic waves with a period of approximately 250 seconds (about 4 minutes)
and a duration of approximately 60 minutes were the first detailed aspects of the TEC variations found in 1 Hz
TEC data. They are considered to represent a manifestation of the acoustic resonance oscillations. These waves
were not seen in 30 seconds data.
We also observed medium-scale TIDs with a period of approximately 15 minutes and a duration of one
hour. These medium-scale TIDs structures appeared at approximately 07:30 UT over eastern South Korea. The
amplitude of the medium-scale waves tended to decrease with time. It is assumed that these waves are induced
by the tsunami due to the slow speed. These waves propagated for more than horizontal distance of 1,000 km
from the ionospheric epicenter.
The use of the GPS data with a 1 Hz sampling rate enabled us to observe clearly the seismic
wavesexpanding as far as horizontal distance of 1,000 km from the epicenter. This approach also enabled us
toobserve the details of the propagation and attenuation of the acoustic waveover South Korea.
References
[1]. Afraimovich, E.L., Astafieva, E.I., Kirushkin, V.V. Localization of the source of ionospheric disturbance generated during an
earthquake. Int. J. Geomagn. Aeron., 6, GI2002, doi:10.1029/2004GI000092, 2006.
[2]. Astafyeva, E., Heki, K. Dependence of waveform of near-field coseimic ionospheric disturbances on focal mechanisms. Earth
Planets Space., 61, 939-943, 2009.
[3]. Astafyeva, E., Heki, K., Kiryushkin, V., Afraimovich, E., Shalimov, S. Two-mode long-distance propagation of coseismic
ionosphere disturbances. J. Geophys. Res., 114, doi:10.1029/2008JA013853, 2009.
[4]. Calais, E., Minster, J.B. GPS detection of ionospheric perturbationsfollowing the January 17, 1994, Northridge earthquake.Geophys.
Res.Lett.,22, 1045–1048, 1995.
[5]. Chen, C.H., Saito, A., Lin, C.H., Liu, J.Y., Tsai, H.F.,Tsugawa, T., Otsuka, Y., Nishioka, M., Matsumura, M. Long-distance
propagationof ionospheric disturbance generated by the 2011 off the Pacific coastof Tohoku Earthquake. Earth Planets Space, 63,
881–884,2011.
[6]. Choi, B.K., Cho, J.H., Lee, S.J. Estimation and analysis of GPS receiver differential code biases using KGN in Korean Peninsula.
Adv. in Space Res., 47, 1590-1599, 2011.
[7]. Choosakul, N., Saito, A., Iyemori, T., Hashizume, M. Excitation of 4-min periodic ionospheric variations following the great
Sumatra-Andaman earthquake in 2004, J. Geophys. Res, 114, A10313, doi:10.1029/2008JA013915, 2009.
[8]. Grejner-Brzezinska, D., Wielgosz, P, Kashni, I., Smith, D.A., Spencer, P., Robertson, S., Mader, G.L. An analysis of the effects of
different network-based ionosphere estimation models on rover positioning accuracy. J. GPS., 3, 115-131, 2004.
[9]. Heki, K., Ping, J.S. Directivity and apparent velocity of the coseismic ionospheric disturbances observed with a dense GPS array.
Earth Planet. Sci. Lett., 236, 845–855, 2005.
[10]. Jakowski, N., Schlüter, S., Sardon, E. Total electron content of the ionosphere during the geomagnetic storm on 10 January 1997. J.
Atmos. Sol. Terr. Phys., 61, 299–307, 1999.
[11]. Klobuchar, J.A. Ionospheric Effects on GPS, in Global Positioning Systems: Theory and Applications, Vol. I, Proc. in Astronaut.
And Aeronaut., edited by Parkinson, B.W., Spilker, J.J, American Institute of Aeronautics and Astronautics, Washington, 485-515,
1996.
8. Ionospheric TEC Disturbances Over South Korea Following The 2011 Great Tohoku Earthquake
42
[12]. Klobuchar, J.A., Doherty, P.H., Bailey, G.J., Davies, K. Limitations in determining absolute total electron content from dual-
frequency GPS group delay measurements. In: Kersley, L. (Ed). Proceedings of the International Beacon Satellite
Symposium.,Aberystwyth, UK, 1-4, 1994.
[13]. Liu, J.Y., Tsai, H.F., Lin, C.H., Kamogawa, M., Chen, Y.I., Lin, C.H., Huang, B.S., Yu S.B., Yeh, Y.H. Coseismic ionospheric
disturbancestriggered by the Chi-Chi earthquake.J. Geophys. Res., 115, A08303,2010.
[14]. Liu, J.Y., Chen, C.H., Lin, C.H., Tsai, H.F., Chen,C.H., Kamogawa, M.Ionospheric disturbances triggered by the 11 March 2011
M9.0 Tohoku earthquake.J. Geophys. Res., 116, A06319, doi:10.1029/2011JA016761, 2011.
[15]. Ma, G., Maruyama, T. Derivation of TEC and estimation of instrumental biases from GEONET in Japan. Ann. Geophy., 21, 2083-
2093, 2003.
[16]. Maruyama, T., Tsugawa, T., Kato, H., Saito, A., Otsuka, Y.,Nishioka,M. Ionospheric multiple stratifications and irregularities
induced by the2011 off the Pacific coast of Tohoku Earthquake.Earth Planets Space,63, 869–873, 2011.
[17]. Matsumura, M., Saito, A.,Iyemori, T., Shinagawa, H.,Tsugawa, T., Otsuka, Y., Nishioka, M., Chen, C.H. Numerical simulations of
atmosphericwaves excited by the 2011 off the Pacific coast of TohokuEarthquake.Earth Planets Space, 63, 885–889, 2011.
[18]. Otsuka, Y., Kotake, N.,Tsugawa, T.,Shiokawa, K., Ogawa, T., Effendy, Saito, S., Kawamura, M., Maruyama, T.,Hemmakorn,
N.,Komolmis,T. GPS detection of total electron content variations over Indonesia andThailand following the 26 December 2004
earthquake.EarthPlanetsSpace, 58, 159–165, 2006.
[19]. Rolland, L.M., Lognonne, P., Astafyeva, E., Kherani, E.A., Kobayashi, N., Mann, M., Munekane, H. The resonant response of the
ionosphere imaged after the 2011 off the Pacific coast of Tohoku Earthquake. Earth PlanetsSpaceLett.,63, 853–857, 2011.
[20]. Saito, A., Tsugawa, T., Otsuka, Y.,Nishioka, M.,Iyemori, T., Matsumura,M., Saito, S., Chen, C.H.,Goi, Y.,Choosakul, N. Acoustic
resonanceand plasma depletion detected by GPS total electron content observationafter the 2011 off the Pacific coast of Tohoku
Earthquake.EarthPlanetsSpace, 63, 863–867, 2011.
[21]. Schaer, S., Mapping and Predicting the Earth’s Ionosphere Using the Global Positioning System, Ph.D. thesis, University of Berne,
Switzerland, 1999.
[22]. Tsai, H.F., Liu, J.Y., Liu, C.H.,Chen, C.H. Tracking the epicenter and the tsunami origin with GPS ionosphere observation. Earth
PlanetsSpace, 63, 859–863, 2011.
[23]. Tsugawa, T., Saito, A., Otsuka, Y.,Nishioka, M., Maruyama, T., Kato,H.,Nagatsuma, T., Murata, K.T. Ionospheric disturbances
detected byGPS total electron content observation after the 2011 off the Pacificcoast of Tohoku Earthquake.Earth Planets Space, 63,
875–879, 2011.
[24]. Yoshihiro, K., Masashi, K., Shigeto, W., Masatsugu, O., Toru, M., Liu, J.Y., Sun, Y.Y., Takuji, Y. Ionospheric ripples excited by
superimposed wave fronts associated with Rayleigh waves in the thermosphere. J. Geophys. Res., 118, doi:10.1002/jgra.50099,
2013.