2015 Results Presentation
•
0 likes•451 views

Repsol's adjusted net income for 2015 was €1,860 million, a 9% rise over 2014. Its net debt was reduced by over €1,100 million despite investments and interest payments. Production reached 697,000 barrels per day, up 88% year-over-year. Downstream business performed strongly with refining margins doubling versus prior year. Measures to reduce costs and investments will lower the breakeven price to $40 per barrel.

Recommended
More Related Content
What's hot
What's hot (20)
Viewers also liked
Similar to 2015 Results Presentation
Similar to 2015 Results Presentation (20)
More from Repsol
More from Repsol (20)
Recently uploaded
Recently uploaded (20)
2015 Results Presentation
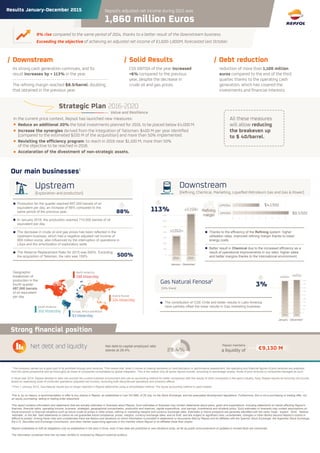
- 1. Repsol's adjusted net income during 2015 was 1,860 million Euros Results January-December 2015 9% rise compared to the same period of 2014, thanks to a better result of the Downstream business. Exceeding the objective of achieving an adjusted net income of €1,600-1,800M, forecasted last October. Net debt and liquidity Net debt-to-capital employed ratio stands at 29.4%. €9,130 M Repsol maintains a liquidity of29.4% Strong financial position CSS EBITDA of the year increased +6% compared to the previous year, despite the decrease in crude oil and gas prices. Solid Results reduction of more than 1,100 million euros compared to the end of the third quarter, thanks to the operating cash generation, which has covered the investments and financial interests. Debt reduction In the current price context, Repsol has launched new measures: Reduce an additional 20% the total investments planned for 2016, to be placed below €4,000 M. Increase the synergies derived from the integration of Talisman: $400 M per year identified (compared to the estimated $220 M of the acquisition) and more than 50% implemented. Revisiting the efficiency program: to reach in 2016 near $1,100 M, more than 50% of the objective to be reached in 2018. Acceleration of the divestment of non-strategic assets. Strategic Plan 2016-2020 Value and Resilience All these measures will allow reducing the breakeven up to $ 40/barrel. Its strong cash generation continues, and its result increases by + 113% in the year. The refining margin reached $8.5/barrel, doubling that obtained in the previous year. Downstream Production for the quarter reached 697,000 barrels of oil equivalent per day, an increase of 88% compared to the same period of the previous year. In January 2016, the production reached 714,000 barrels of oil equivalent per day. The decrease in crude oil and gas prices has been reflected in the Upstream business, which had a negative adjusted net income of 909 million euros, also influenced by the interruption of operations in Libya and the amortization of exploratory wells. The Reserve Replacement Ratio for 2015 was 500%. Excluding the acquisition of Talisman, the ratio was 159%. Geographic breakdown of production in the fourth quarter: 697,000 barrels of oil equivalent per day Downstream (Refining, Chemical, Marketing, Liquefied Petroleum Gas and Gas & Power) January - December1 2100 1800 1500 1200 900 600 300 0 €1,012M 2014 €2,150M 2015 0 1 2 3 4 5 6 7 8 $4,1/bbl12M2014 $8,5/bbl12M2015 January - December1 450 400 350 300 250 200 150 100 50 0 2015 €453M 2014 €441M Gas Natural Fenosa2 (30% Share) The contribution of CGE-Chile and better results in Latin America have partially offset the lower results in Gas marketing business. Upstream (Exploration and production) Our main businesses1 Thanks to the efficiency of the Refining system: higher utilisation rates, improved refining margin thanks to lower energy costs. Better result in Chemical due to the increased efficiency as a result of operational improvements in our sites, higher sales and better margins thanks to the international environment. Refining margin 113% South America: 302 kboe/day Europe, Africa and Brazil: 93 kboe/day North America: 198 kboe/day Asia & Russia: 104 kboe/day 88% 3% 500% 2 From 1 January 2014, Gas Natural results are no longer reported in Repsol statements using a consolidated method. The equity accounting method is used instead. This is, by no means, a recommendation or offer to buy shares in Repsol, as established in Law 24/1988, of 28 July, on the Stock Exchange, and the associated development regulations. Furthermore, this is not a purchasing or trading offer, nor an equity purchasing, selling or trading order elsewhere. This report contains information and statements that are actually estimates or forecasts about Repsol. Such estimates or forecasts may contain statements about plans, goals and expectations, including statements on trends affecting Repsol’s finances, financial ratios, operating income, business, strategies, geographical concentration, production and reserves, capital expenditure, cost savings, investments and dividend policy. Such estimates or forecasts may contain assumptions on future economic or financial situations such as future crude oil prices or other prices, refining or marketing margins and currency exchange rates. Estimates or future prospects are generally identified with the verbs ‘hope’, ‘expect’, ‘think’, ‘believe’, ‘estimate’, or the like. Said statements or claims do not guarantee future compliance, prices, margins, currency exchange rates, and so forth, and are subject to significant risks, uncertainties, changes or other factors beyond Repsol’s control or difficult to predict. Among these risks and uncertainties there are factors and situations on which information is provided in statements or documents filed by Repsol and its affiliates with the Spanish Stock Exchange, the Argentine Stock Exchange, the U.S. Securities and Exchange Commission, and other market supervising agencies in the markets where Repsol or its affiliates trade their shares. Repsol undertakes to fulfil its obligations only as established in the laws in force, even if new data are published or new situations arise, as far as public announcements of updated or revised facts are concerned. The information contained here has not been verified or reviewed by Repsol’s external auditors. 1 The company carries out a good part of its activities through joint ventures. This means that, when it comes to making decisions on fund allocation or performance assessment, the operating and financial figures of joint ventures are analysed from the same perspective and as thoroughly as those of companies consolidated by global integration. This is the reason why all sector figures include, according to percentage shares, those of joint ventures or companies managed as such. In fiscal year 2014, Repsol decided to take into account the current business environment and use an accounting method for better comparison with the results of other companies in the same industry. Now, Repsol reports its recurring net income based on restocking costs of continued operations (adjusted net income), excluding both discontinued operations and inventory effects.