+971581248768>> SAFE AND ORIGINAL ABORTION PILLS FOR SALE IN DUBAI AND ABUDHA...
ePortfolio- Mathematics
1. Emilio Solomon
IB Mathematics SL Internal Assessment
Infinite Summation
Introduction
𝑡0 = 1, 𝑡1 =
(𝑥 ln 𝑎)
1
, 𝑡2 =
(𝑥 ln 𝑎)
2 × 1
2
,𝑡3 =
(𝑥 ln 𝑎)
3 × 2 × 1
3
, 𝑡𝑛 =
(𝑥 𝑙𝑛 𝑎)
𝑛!
𝑛
In this task, the sum of infinite sequences will be investigated. With regards to the
given sequence above, a general sequence will be plotted using all three parameters,
𝑥, 𝑎, and 𝑛. The relationship between 𝑆𝑛, the sum of the general sequence and 𝑛,
the term, will be analyzed through various plotted general sequences using
technology.
The sum 𝑆𝑛, of the first n terms of the sequence below will be calculated for 0 ≤
𝑛 ≤ 10 using the following sequence.
(Eq.1)
1,
(ln 2)
1
,
(ln 2)2
2 × 1
,
(ln2)
3 × 2 × 1
3
…𝑡𝑛
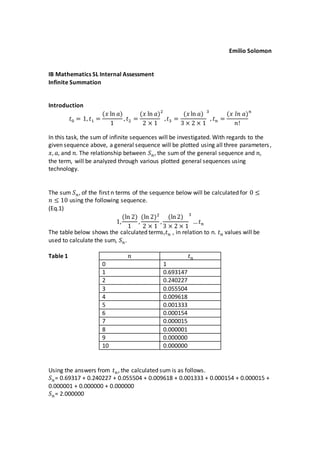
The table below shows the calculated terms,𝑡𝑛 , in relation to n. 𝑡𝑛 values will be
used to calculate the sum, 𝑆𝑛.
Table 1
Using the answers from 𝑡𝑛, the calculated sum is as follows.
𝑆𝑛= 0.69317 + 0.240227 + 0.055504 + 0.009618 + 0.001333 + 0.000154 + 0.000015 +
0.000001 + 0.000000 + 0.000000
𝑆𝑛= 2.000000
𝑛 𝑡𝑛
0 1
1 0.693147
2 0.240227
3 0.055504
4 0.009618
5 0.001333
6 0.000154
7 0.000015
8 0.000001
9 0.000000
10 0.000000
2. Thus, using the answers from 𝑡𝑛, in Table 1, the relationship between 𝑆𝑛 and n will
be plotted using technology. The relationship between 𝑆𝑛 and n will be shown
through both a table and a graph.
Table 2 Graph 1
According to Graph 1, the sequence begins to approach a limit. Therefore, this
suggests that as 𝑛 approaches +∞, the value of 𝑆𝑛, begins to increase less.
With regards to both Table 2, and Graph 2, it can be predicted that as 𝑛 approaches
+∞, the limit of 𝑆𝑛, will be a 2.
The following expression, the limit expression, can be derived to represent the
relationship between 𝑛 and 𝑡𝑛
(Eq. 2)
lim
𝑛→∞
(ln2)
𝑛!
𝑛
Another sequence where 𝑥 = 1 and 𝑎 = 3 will be considered. Like the previous
sequence, the sum 𝑆𝑛, will be calculated for 0 ≤ 𝑛 ≤ 10, where n is the term
number. Also, like the previous sequence, the relationship between 𝑆𝑛 and 𝑛 will be
plotted and shown through both a graph and a table. Both the first and second
sequence will be compared, with regards to both graphs and tables.
(Eq.3)
1,
(ln 3)
1
,
(ln 3)2
2 × 1
,
(ln3)
3 × 2 × 1
3
…𝑡𝑛
𝑛 𝑆𝑛
0 1
1 1.693147
2 1,933374
3 1,988878
4 1.998496
5 1.999829
6 1.999983
7 1.999998
8 1.999999
9 1.999999
10 1.999999
3. Table 3
Using the answers from 𝑡𝑛, the calculated sum, 𝑆𝑛 is as follows.
𝑆𝑛=1 + 1.098612 + 0.603474 + 0.220995 + 0.060697 + 0.013336 + 0.002442 +
0.000383 + 0.000053 + 0.000006 + 0.000001
𝑆𝑛= 2.999999
Table 4 Graph 2
According to Graph 2, the second sequence also approaches a limit as well.
Therefore again, this also suggests that as 𝑛 approaches ∞, the value of 𝑆𝑛, begins to
increase less and less. With regards to both Table 2, and Graph 2, it can be predicted
that as 𝑛 approaches +∞, the limit of 𝑆𝑛, will be a 3.
The limit expression, for the second sequence considered is as follows, depicting the
relationship between 𝑛 and 𝑡𝑛.
𝑛 𝑡𝑛
0 1
1 1.098612
2 0.603474
3 0.220995
4 0.060697
5 0.013336
6 0.002442
7 0.000383
8 0.000053
9 0.000006
10 0.000001
𝑛 𝑆𝑛
0 1
1 2.098612
2 2.792986
3 2.923081
4 2.983778
5 2.997114
6 2.999556
7 2.999939
8 2.999992
9 2.999998
10 2.999999
4. (Eq.4)
lim
𝑛→∞
(ln3)
𝑛!
𝑛
In general, both sequences reflect a general sequence where 𝑥 = 1
(Eq.5)
1,
(ln 𝑎)
1
,
(ln 𝑎)2
2 × 1
,
(ln 𝑎)
3 × 2 × 1
3
… 𝑡𝑛
Overall, this type of sequence has a limit. Nonetheless, as 𝑎 increases, the infinite
sum increases as well. This is clearly shown through the infinite sums where 𝑎 = 2
and where 𝑎 = 3.
The infinite sums where 𝑎 = 2 and where 𝑎 = 3 can be represented through sigma
notation.
(Eq.6) (Eq.7)
∑
(ln 2)𝑛
𝑛!
∞
𝑛=1
≈ 2 ∑
(ln 3)𝑛
𝑛!
∞
𝑛=1
≈ 3
In relation to the general sequence, the general sequence will be expanded, and thus
used for further analysis and comparison.
(Eq.8) (Eq.9)
1,
(ln𝑎)
1
,
(ln 𝑎)2
2 × 1
,
(ln 𝑎)
3 × 2 × 1
3
… 𝑡𝑛 1,
(𝑥 ln𝑎)
1
,
(𝑥 ln 𝑎)2
2 × 1
,
(𝑥 ln 𝑎)
3 × 2 × 1
3
…𝑡𝑛
By expanding the general sequence, 𝑥 will additionally be used. The sum of the first
𝑛 terms, for various values of 𝑎 and 𝑥 can be defined as…
𝑡𝑛(𝑎, 𝑥)
e.g. 𝑇9(2,𝑥) is the sum of the first nine terms when 𝑎 = 2 and 𝑥 = 5.
Another way of representing this is using the expanded general sequence.
(Eq.10)
1,
(𝑥 ln 2)
1
,
(𝑥 ln 2)2
2 × 1
,
(𝑥 ln 2)
3 × 2 × 1
3
… 𝑡𝑛
𝑡9(2,𝑥) will be calculated for various positive values of 𝑥, where 𝑎 = 2. In other
words, the sequence below will be calculated.
(Eq.11)
5. 𝑡9 = 1,
(𝑥 ln 2)
1
,
(𝑥 ln 2)2
2 × 1
,
(𝑥 ln 2)
3 × 2 × 1
3
…
(𝑥 ln 2)9
9!
Table 5 Graph 3
According to Graph 3, the sequence begins to approach a limit. Therefore, this
suggests that as 𝑛 approaches +∞, the value of 𝑡𝑛, begins to decrease.
With regards to both Table 2, and Graph 2, it can be predicted that as 𝑛 approaches
+∞ , the limit of 𝑡𝑛, will be 0.
Another sequence where 𝑎 = 3 will be considered. Like the previous sequence,
𝑡𝟗 (3,𝑥) will also be calculated for various positive values of 𝑥, where 𝑎 = 3.
(Eq.12)
𝑡9 = 1,
(𝑥 ln 3)
1
,
(𝑥 ln 3)2
2 × 1
,
(𝑥 ln 3)
3 × 2 × 1
3
…
(𝑥 ln 3)9
9!
Also, like the previous sequence, the relationship between 𝑇𝑛 and 𝑛 will be plotted
and shown through both a graph and a table. Both sequences of the expanded
general sequence will be compared, with regards to both graphs and tables.
Table 6 Graph 4
𝑛 𝑡𝑛
0 1
1 0.693147
2 0.480453
3 0.166651
4 0.038473
5 0.006667
6 0.000924
7 0.000107
8 0.000011
9 0.000009
𝑛 𝑡𝑛
0 1
1 1.098612
2 1.206949
3 0.662984
4 0.242788
5 0.066672
6 0.014652
7 0.002683
8 0.000421
9 0.000058
6. According to Graph 4, the sequence begins to approach a limit. Therefore, this
suggests that as approaches +∞, the value of 𝑡𝑛, begins to decrease.
With regards to both Table 6, and Graph 4, it can be predicted that as 𝑛 approaches
+∞ , the limit of 𝑡𝑛, will be also be 0, when 𝑎 = 3. However according to Graph 4, 𝑡,
begins to increase when 0 ≤ 𝑛 ≤ 2. 𝑇𝑛 and begins to decrease when 𝑛 ≥ 2.
While 𝑡𝑛 values decrease throughout the first sequence…
(Eq.11)
𝑡9 = 1,
(𝑥 ln 2)
1
,
(𝑥 ln 2)2
2 × 1
,
(𝑥 ln 2)
3 × 2 × 1
3
…
(𝑥 ln 2)9
9!
𝑡𝑛 values increase and decrease in the second sequence.
(Eq.12)
𝑡9 = 1,
(𝑥 ln 3)
1
,
(𝑥 ln 3)2
2 × 1
,
(𝑥 ln 3)
3 × 2 × 1
3
…
(𝑥 ln 3)9
9!
Further examples are considered in order to the test the validity of the general
statement, such as when 𝑎 = 1. 𝑡𝑛 values do not increase nor decrease when 𝑎 = 1
𝑡9 = 1,
(𝑥 ln 1)
1
,
(𝑥 ln 1)2
2 × 1
,
(𝑥 ln 1)
3 × 2 × 1
3
…
(𝑥 ln 1)9
9!
e.g.
(Eq.13)
𝑡1 =
(ln1)
1
𝑡1 = 0
𝑡2 =
(2ln 1)
2 × 1
𝑡2 = 0
𝑡3 =
(3ln 1)
3!
𝑡3 = 0
Therefore, for 𝑇𝑛(𝑎,𝑥) as 𝑛 approaches +∞, 𝑎 > 1, because when 𝑎 = 1, 𝑇𝑛 values
remain constant. In other words when 𝑎 = 1, the graph does not display any
relationship between 𝑇𝑛 and 𝑛.
Conclusion
The purpose of this task, was to investigate the sum of infinite sequences, such as
𝑇𝑛, where
(Eq. 1)
𝑡0 = 1, 𝑡1 =
(𝑥 ln 𝑎)
1
, 𝑡2 =
(𝑥 ln 𝑎)
2 × 1
2
,𝑡3 =
(𝑥 ln 𝑎)
3 × 2 × 1
3
, 𝑡𝑛 =
(𝑥 𝑙𝑛 𝑎)
𝑛!
𝑛
Using 𝑥, 𝑎 and 𝑛, as parameters in the sequences. Before using the expanded form
of the infinite sequence, only 𝑎 and 𝑛, was investigated through the following
infinite sequence.
7. 1,
(ln 𝑎)
1
,
(ln 𝑎)2
2 × 1
,
(ln 𝑎)
3 × 2 × 1
3
… 𝑡𝑛 =
(ln 𝑎)
𝑛!
𝑛
By using various positive 𝑎 values in the infinite sequence, it turned out that all the
sum of the infinite sequences would approach a limit. Nonetheless, the sum of the
infinite sequences increased as positive 𝑎 values increase. In general, this shows that
in an infinite sequence, as positive 𝑎 values increase, 𝑆𝑛 approaches a greater limit.
This is shown from sample calculations of the sequences using 𝑡𝑛 values fro Table 2
and Table 4.
In order to verify that limits exist in the infinite sequence, the infinite sequence was
further investigated using the expanded form.
𝑡0 = 1, 𝑡1 =
(𝑥 ln 𝑎)
1
, 𝑡2 =
(𝑥 ln 𝑎)
2 × 1
2
,𝑡3 =
(𝑥 ln 𝑎)
3 × 2 × 1
3
, 𝑡𝑛 =
(𝑥 𝑙𝑛 𝑎)
𝑛!
𝑛
By investigating the expanded form of the infinite sequence, various positive values
of 𝑥 were used with constant 𝑎, such as where 𝑎 = 2 or 𝑎 = 3, throughout the
infinite sequence. It turned out that limits also existed in the expanded form of the
infinite sequence. For example, when 𝑎 = 2 and 𝑎 = 3, 𝑡𝑛 would approach a limit. In
this case, the limit of 𝑡𝑛 when 𝑎 = 2 and 𝑎 = 3 is 0. However, limits only exist when
𝑎 > 1. When 𝑎 = 1, a limit does not exist because 𝑡𝑛 is constantly 0.
Therefore for the infinite sequence 𝑡𝑛 (𝑎, 𝑥), as 𝑛 approaches +∞, 𝑎 > 1.
Overall, since the sums of an infinite sequence approach a limit, the relationship
between 𝑡𝑛 and 𝑆𝑛 is that when 𝑡𝑛 infinitely decreases, 𝑆𝑛 infinitely increases.
Evaluation
Throughout the task, technology was used, which in turn, helped formulate a
general statement, for 𝑡𝑛(𝑎, 𝑥) .As 𝑛 approaches +∞, 𝑎 > 1. In the beginning of the
task, various values of 𝑎 and 𝑛 were plugged into a graphic display calculator (GDC)
using the infinite sequence until a pattern was shown. Furthermore, the patterns
𝑛 𝑆𝑛
0 1
1 1.693147
2 1,933374
3 1,988878
4 1.998496
5 1.999829
6 1.999983
7 1.999998
8 1.999999
9 1.999999
10 1.999999
𝑛 𝑆𝑛
0 1
1 2.098612
2 2.792986
3 2.923081
4 2.983778
5 2.997114
6 2.999556
7 2.999939
8 2.999992
9 2.999998
10 2.999999
8. were displayed through graphs, which helped me visualize the pattern. I noticed that
this type of infinite sequence approaches a limit. To test whether the assumption
was valid or not, various values of 𝑎 were investigated as well, aside from the values
given in the task.