A Method for the Analysis of Behavioural
Uncertainty in Evacuation Modelling
Enrico Ronchi*, Department of Fire Safety Engineering and Systems Safety,
Lund University, P.O. Box 118, 22100 Lund, Sweden
Paul A. Reneke and Richard D. Peacock, National Institute of Standards and
Technology, Gaithersburg, MD 20899, USA
Received: 4 April 2013/Accepted: 22 June 2013
Abstract. Evacuation models generally include the use of distributions or probabilis-
tic variables to simulate the variability of possible human behaviours. A single model
setup of the same evacuation scenario may therefore produce a distribution of differ-
ent occupant-evacuation time curves in the case of the use of a random sampling
method. This creates an additional component of uncertainty caused by the impact of
the number of simulated runs of the same scenario on evacuation model predictions,
here named behavioural uncertainty. To date there is no universally accepted quanti-
tative method to evaluate behavioural uncertainty and the selection of the number of
runs is left to a qualitative judgement of the model user. A simple quantitative
method using convergence criteria based on functional analysis is presented to
address this issue. The method permits (1) the analysis of the variability of model
predictions in relation to the number of runs of the same evacuation scenario, i.e. the
study of behavioural uncertainty and (2) the identification of the optimal number of
runs of the same scenario in relation to pre-defined acceptance criteria.
Keywords: Evacuation modelling, Behavioural uncertainty, Human behaviour in fire,
Functional analysis, Convergence criteria
1. Introduction
Uncertainty is divided into different components in the context of fire safety engi-
neering and modelling [1]: model input uncertainty, measurement uncertainty, and
intrinsic uncertainty.
(1) Model input uncertainty is associated with the parameters obtained from
experimental measurements that are used as model input, i.e. the assumptions
employed to derive model input from the experiments.
(2) Measurement uncertainty is associated with the experimental measurement
itself, i.e., the data collection techniques employed.
(3) Intrinsic uncertainty is the uncertainty associated with the physical and mathe-
matical assumptions and methods that are intrinsic to the model formulation.
* Correspondence should be addressed to: Enrico Ronchi, E-mail: [email protected]
Fire Technology, 50, 1545–1571, 2014
� 2013 Springer Science+Business Media New York. Manufactured in The United States
DOI: 10.1007/s10694-013-0352-7
12
In the case of evacuation data, uncertainty includes an additional component,
here named behavioural uncertainty. Behavioural uncertainty is uncertainty asso-
ciated with the stochastic nature of human behaviour, i.e. human behaviour is sto-
chastic per se [2], and a single experiment or model run may not be representative
of a full range of the behaviours of the occupants. In fa.
A Method for the Analysis of BehaviouralUncertainty in Evacu.docx
1. A Method for the Analysis of Behavioural
Uncertainty in Evacuation Modelling
Enrico Ronchi*, Department of Fire Safety Engineering and
Systems Safety,
Lund University, P.O. Box 118, 22100 Lund, Sweden
Paul A. Reneke and Richard D. Peacock, National Institute of
Standards and
Technology, Gaithersburg, MD 20899, USA
Received: 4 April 2013/Accepted: 22 June 2013
Abstract. Evacuation models generally include the use of
distributions or probabilis-
tic variables to simulate the variability of possible human
behaviours. A single model
setup of the same evacuation scenario may therefore produce a
distribution of differ-
ent occupant-evacuation time curves in the case of the use of a
random sampling
method. This creates an additional component of uncertainty
caused by the impact of
the number of simulated runs of the same scenario on
evacuation model predictions,
here named behavioural uncertainty. To date there is no
universally accepted quanti-
tative method to evaluate behavioural uncertainty and the
selection of the number of
2. runs is left to a qualitative judgement of the model user. A
simple quantitative
method using convergence criteria based on functional analysis
is presented to
address this issue. The method permits (1) the analysis of the
variability of model
predictions in relation to the number of runs of the same
evacuation scenario, i.e. the
study of behavioural uncertainty and (2) the identification of the
optimal number of
runs of the same scenario in relation to pre-defined acceptance
criteria.
Keywords: Evacuation modelling, Behavioural uncertainty,
Human behaviour in fire,
Functional analysis, Convergence criteria
1. Introduction
Uncertainty is divided into different components in the context
of fire safety engi-
neering and modelling [1]: model input uncertainty,
measurement uncertainty, and
intrinsic uncertainty.
(1) Model input uncertainty is associated with the parameters
obtained from
experimental measurements that are used as model input, i.e.
the assumptions
employed to derive model input from the experiments.
(2) Measurement uncertainty is associated with the experimental
measurement
itself, i.e., the data collection techniques employed.
3. (3) Intrinsic uncertainty is the uncertainty associated with the
physical and mathe-
matical assumptions and methods that are intrinsic to the model
formulation.
* Correspondence should be addressed to: Enrico Ronchi, E-
mail: [email protected]
Fire Technology, 50, 1545–1571, 2014
� 2013 Springer Science+Business Media New York.
Manufactured in The United States
DOI: 10.1007/s10694-013-0352-7
12
In the case of evacuation data, uncertainty includes an
additional component,
here named behavioural uncertainty. Behavioural uncertainty is
uncertainty asso-
ciated with the stochastic nature of human behaviour, i.e.
human behaviour is sto-
chastic per se [2], and a single experiment or model run may not
be representative
of a full range of the behaviours of the occupants. In fact,
‘‘evacuate the same
building with the same people starting in the same places on
consecutive days and
the answers could vary significantly’’ [2]. There is a subsequent
need for multiple
experimental data-sets to understand the possible variability of
occupant behav-
iours in each individual evacuation scenario [3]. Unfortunately,
experimental data-
4. sets on human behaviour in fire are scarce and single data-sets
are often the only
available reference for the study of an individual scenario.
Behavioural uncer-
tainty needs to be analysed in both experimental and modelling
studies. In this
context, the assessment of the variability of simulation results
in relation to
behavioural uncertainty is a key issue to be discussed. This is
reflected in the esti-
mation of the convergence of an individual evacuation
simulation scenario
towards an ‘‘average’’ predicted occupant evacuation time-
curve. It should be
noted that the term behavioural uncertainty is here introduced in
the context of
fire safety science, i.e. the term may have different meanings in
other research
fields.
Fire modellers and evacuation modellers treat uncertainty in
different ways.
Uncertainty is generally treated in fire models as a deterministic
problem, i.e., it is
studied by analysing the sensitivity of the model output in
relation to the variabil-
ity of the model input. This is driven by the fact that fire
models are generally
based on deterministic equations (e.g. [4, 5]). On the other
hand, evacuation mod-
els treat uncertainty as a stochastic problem. In fact, to address
the stochastic nat-
ure of human behaviour, evacuation models often employ
distributions or
stochastic variables to simulate people movement and
behaviours [6–10] (e.g. dis-
5. tribution of walking speeds, distribution of pre-evacuation
times, exit choice, etc.).
In fact, random numbers/seeds may be employed to solve space
conflict resolu-
tion, simulate exit choice, familiarity with the exit, queuing
behaviour, etc. When
distributions are created adopting a random sampling method,
multiple occupant-
evacuation time curves for the same scenario using the same
model inputs are
produced. Random variables may be intrinsic of the model
algorithms, and model
users may not have control/access to them (especially in closed-
source models).
This leads to the need for a study of the variability of the
results associated with
the random variables embedded in the models.
Therefore, evacuation modellers face the problem of selecting
the appropriate
number of runs to be simulated in order to be representative of
the average
model outcome. This problem arises both during the use of
evacuation models
for a fire safety design as well as during validation studies. In
fact, two main
questions can be asked during the simulation of evacuation
scenarios that
include distributions or stochastic variables: (1) Which
occupant-evacuation time
curve is representative of model predictions in a fire safety
design? (2) Which
occupant-evacuation time curve should be used as reference
during the compari-
son with experimental data in a validation study? To date, the
answers to these
6. questions are left to a qualitative judgment by the evacuation
model user. For
1546 Fire Technology 2014
instance, in the context of evacuation model validation, model
users may select
the best model prediction during the comparison with
experimental data [11] or
employ the model’s average total evacuation time (TET)
[possibly including
information on the standard deviation (SD)] as representative of
model predic-
tions. The study of the average TETs and their corresponding
SDs provides
insights only on the required safe escape time, rather than the
whole evacuation
process. There is instead a need for a method which investigates
the size of the
variation for the whole occupant-evacuation time curve.
Nevertheless, to date,
there is no universally accepted quantitative method to estimate
how these aver-
age predictions may vary over the number of runs.
In addition, complex evacuation scenarios may be
computationally expensive
to simulate. For instance, previous research on the use of
distribution curves for
Monte Carlo simulations for uncertainty analysis in evacuation
model predic-
tions have demonstrated the need for a large computational
effort [7]. Therefore
there is a need to optimize the selection of the number of runs
7. of the same sce-
nario in order to be representative of occupants’ ‘‘average
behaviour’’, and pro-
vide a quantitative and computationally inexpensive
measurement of the
variability associated with the simulated runs (and a subsequent
estimation of
the behavioural uncertainty associated with an individual
evacuation model
setup).
A useful method for the analysis of model predictions is
functional analysis.
This branch of mathematics represents curves as vectors, and
uses geometrical
operations on the curves. Functional analysis operations are
currently employed
during the comparison of fire model evaluations and
experimental data [12, 13]
and the comparison between evacuation model results and
experimental data [14].
Nevertheless, functional analysis has not been employed so far
to compare evacu-
ation model predictions against each other to analyse the
uncertainty associated
with the number of runs of the same evacuation scenario, i.e.
behavioural uncer-
tainty.
This paper proposes a set of convergence criteria for the
analysis of the vari-
ability of evacuation model predictions of the same evacuation
scenario (i.e. the
same model input which includes distributions or stochastic
variables) in relation
to the number of runs. A procedure for the definition of the
8. optimal number of
runs—in relation to the evacuation scenario, the model in use,
and the scope of
the simulations—is presented. The scope of the present work is
therefore to pro-
vide a quantitative method to assess the variability associated
with the number of
runs of the same evacuation scenario. The proposed method
allows the analysis of
behavioural uncertainty and the prediction of the average
occupant-evacuation
time curve in relation to pre-defined acceptance criteria.
A case study about the application of the method is presented.
The case study
is an explanatory example in which a fictitious data-set (i.e. a
data-set created
using a pseudo-random generator) is employed to show the
convergence criteria
and the evaluation procedure.
The last part of the paper discusses the benefits associated with
the use of the
convergence criteria and future work regarding their possible
uses.
Analysis of Behavioural Uncertainty 1547
2. Method
This section presents a proposed methodology for the analysis
of behavioural
uncertainty. It includes the definition of five convergence
criteria for the analysis
9. of the occupant-evacuation time curves produced by evacuation
models and a
procedure for the assessment of the optimal number of runs in
relation to pre-
defined acceptance criteria.
The proposed methodology is based on the definition of a set of
convergence
measures that sufficiently describe the distribution of occupant-
evacuation time
curves. This is addressed by constructing a series for each
measure and demon-
strating that the measure is sufficiently close to the expected
value, i.e. the series
converge to the average occupant-evacuation time curve.
A series S = {si,…, sn} converges to Sc if for any positive real
value e there is
an n such that Sc � snj j< e.
The series represents the evacuation time predictions of
evacuation models and
they are based on sample data. This will imply that the series
will likely not
smoothly converge, meaning that it might happen that Sc �
snþ1j j> Sc � snj j. In
order to increase the confidence that our series have sufficiently
converged, a
requirement that the last b values of the series (the convergence
measures) are
within Sc is added. For some series we might not know the
expected value Sc, i.e.,
the value to which the series is convergent. In those cases the
last current value of
the series is used as the best estimate of the value the series
converges to.
10. 2.1. Functional Analysis Concepts
Before discussion of convergence criteria, there is a need to
introduce three concepts
of functional analysis, namely the Euclidean Relative
Difference (ERD), the Euclid-
ean Projection Coefficient (EPC) and the Secant Cosine (SC).
Initial applications of
these concepts have been used in different research fields (e.g.,
mechanics [15], engi-
neering [16], etc.), including fire science (see Peacock et al.
[12] and Galea et al. [14]).
The single comparison of two individual points in a curve can
be made by find-
ing the norm of the difference between the two vectors
representing the data. A
norm represents the length of a vector. The distance between
two vectors corre-
sponds to the length of the vector resulting from the difference
of the two vectors.
For a generic vector x
*
; the norm is represented using the symbol jj x
*
jj: This con-
cept can be extended to multiple dimensions. The distance
between two generic
multi-dimensional vectors x
*
and y
11. *
is therefore the norm of the difference of the
vectors jj x
*
� y
*
jj. The ERD between two vectors can be normalized as a
relative
difference to the vector y
*
(see Equation 1).
ERD ¼
jj x
*
� y
*
jj
jj y
*
jj
¼
ffiffiffiffiffiffiffiffiffiffiffiffiffiffiffiffiffiffiffiffiffiffiffiffiffiffi
ffiffiffi
Pn
i¼1ðxi � yiÞ
12. 2
Pn
i¼1ðyiÞ
2
s
ð1Þ
The ERD represents, therefore, the overall agreement between
two curves.
Two components can be considered during the comparison of
two vectors,
namely the distance between two vectors and the angle between
the vectors.
1548 Fire Technology 2014
The concept of projection coefficient a is introduced. From a
geometric point of
view, the vector a x
*
is the projection of the vector y
*
onto the vector x
*
(see Figure 1).
13. a defines a factor which reduces the distance between two
vectors to its mini-
mum (see Figure 1). The solution of the minimum problem is
found and corre-
sponds to Equation 2.
a ¼
jj y
*
jj
jj x
*
jj
cos b ð2Þ
hx
*
; y
*
i is the inner product of two vectors, i.e., the product of the
length of the
two vectors and the cosine of the angle between them. The inner
product can be
interpreted as the standard dot product; producing Equation 3.
hx
*
; y
*
i¼
X
n
14. i¼1
ðxiyiÞ ð3Þ
The EPC is found by studying the minimum problem, i.e.,
studying when the
derivative of the function is zero (see Peacock et al. [12] for the
full solution of
the minimum) and it corresponds to:
a ¼ EPC ¼
hx
*
; y
*
i
jj y
*
jj2
¼
Pn
i¼1ðxiyiÞ
Pn
i¼1 y
2
i
ð4Þ
EPC defines a factor which when multiplied by each data point
of the vector y
*
15. reduces the distance between the vectors y
*
and x
*
to its minimum, i.e. the best
possible fit of the two curves.
The concept of SC is also introduced. It represents a measure of
the differences
of the shapes of two curves. This is investigated by analysing
the first derivative of
both curves.
For n data points, a multi-dimensional set of n - 1 vectors can
be defined to
approximate the derivative. This produces Equation 5 [12]:
SC ¼
hx
*
; y
*
i
x
*
�
�
�
�
18. Where:
t is the measure of the spacing of the data, i.e. t = 1 if there is a
data point for
each occupant;
s represents the number of data points in the interval;
n is the number of data points in the data-set;
Dxi�s ¼ xi � xi�s;
Dyi�s ¼ yi � yi�s;
Dti�1 ¼ ti � ti�1:
When the SC is equal to unity, the shapes of the two curves are
identical.
Depending on the value for s, the noise of the data is smoothed
out. An example
of the impact of different values of s on the SC is shown in
Figures 2 and 3. Fig-
ure 2 shows two hypothetical curves (obtained by 120 values for
x and y corre-
sponding to 120 arbitrary data-points) which include noise or no
noise. The
comparison between the shapes of the two curves is made using
different s values
(from s = 1 to s = 60 in this example), i.e., Figure 3 shows that
the use of higher
values for s reduces the impact of the noise in the comparison.
Nevertheless, s should not be too large, so that the natural
variations in the data
are kept. An example of this issue is provided in Figure 4,
where, considering a hypo-
thetical set of 4 data-points, different values for s generate
either SC = 1 for s = 4
(the shape of the curves appear identical) or SC „ 1 in the case
of s = 1 and s = 2.
19. 2.2. Convergence Measures
A set of variables are introduced in order to present the method
of analysis of
evacuation model predictions based on functional analysis and
convergence
criteria.
0
200
400
600
800
1000
1200
1400
1600
1800
0 20 40 60 80 100 120
A
rb
it
ra
20. ry
u
n
it
Arbitrary unit
Curve 1 (no noise) Curve 2 (including noise)
Figure 2. Hypothetical curves including noise (grey curve) and
not
including noise (black curve).
1550 Fire Technology 2014
The measured experimental data are represented using vector E
*
(see Equa-
tion 6), where Ei represents the measured evacuation time for
the ith occupant.
E
*
¼ E1; . . . ; Enð Þ ð6Þ
For example, in the case of i = 3 occupants, i.e., E
*
¼ E1; E2; E3ð Þ; E1 is the mea-
sured evacuation time corresponding to occupant 1, E2 is the
21. measured evacuation
time corresponding to occupant 2 and E3 is the measured
evacuation time corre-
sponding to occupant 3.
The simulated predicted times are represented by the vector m
*
(see Equation 7),
where mi is the simulated evacuation time for the ith occupant.
mn represents the
evacuation time corresponding to the last occupant out of the
building
m
*
¼ m1; . . . ; mnð Þ ð7Þ
Therefore, m
*
¼ m1; m2; m3ð Þ, where m1 is the simulated evacuation time
corre-
sponding to occupant 1, m2 is the simulated evacuation time
corresponding to
occupant 2 and m3 is the simulated evacuation time
corresponding to occupant 3.
0.4
0.5
0.6
0.7
22. 0.8
0.9
1.0
0 10 20 30 40 50 60
S
C
s
SC
Figure 3. SC in relation to different s values.
Figure 4. Schematic representation of the use of different values
for
s during the calculation of the SC.
Analysis of Behavioural Uncertainty 1551
Several runs of the same scenarios are simulated. The simulated
evacuation
times of each occupant i in each jth run are represented using n
vectors m
*
ij (see
Equation 8). Here, q is the total number of occupants and n is
the total number
of runs. One assumption is that occupants are ranked in
23. accordance to their evac-
uation time, i.e. occupants may evacuate the building in a
different order in differ-
ent runs.
m
*
ij ¼ m11; . . . ; mij; . . . ; mqn
� �
ð8Þ
Considering nine runs of the same evacuation scenario including
the same three
occupants, 9 vectors m
*
ij are obtained where i = 3 and j = 9, i.e., m
*
i1 ¼ m11;ð
m21; m31Þ; m
*
i2 ¼ m12; m22; m32ð Þ; . . . ; m
*
i9 ¼ m19; m29; m39ð Þ.
The next variable that is presented is associated with the
calculation of the
arithmetic mean of the values of the runs. The jth average curve
of evacuation
times produced by the model considering the arithmetic mean of
24. the values of all
runs is represented using an n dimensional vector M
*
j (see Equation 9), where
M1 ¼ 1n
Pn
j¼1 m1j;M2 ¼
1
n
Pn
j¼1 m2j; . . . ;Mn ¼
1
n
Pn
j¼1 mqj.
M
*
j ¼ M1; . . . ;Mj; . . . ;Mn
� �
ð9Þ
Considering the previous example, i.e. 3 occupants and 9 runs (i
= 3 and j = 9),
the average curve M
*
25. 1 corresponds to the values of the first run. The average curve
for a sub-set of 4 runs will generate M
*
4 which corresponds to the arithmetic
means of the values up to the fourth run. In the case of all 9
runs, M
*
9 corre-
sponds to the arithmetic means of the values of all runs.
Figure 5 presents vector M
*
j in relation to the number of runs under consider-
ation.
Hence if j ¼ 1;M
*
j ¼ðM1Þ, i.e. the average curve corresponds to the curve of
the first run. If 1 < j < n, M
*
j becomes M
*
j ¼ðM1; . . . ;MjÞ where
M1 ¼ 1j
P1 < j < n
26. j¼1 m1j; M2 ¼
1
j
P1 < j < n
j¼1 m2j; . . . ; Mj ¼
1
j
P1 < j < n
j¼1 mqj:M
*
j represents
then the average curve corresponding to 1 < j < n runs.
Considering 4 vectors m
*
ij
corresponding to the predicted evacuation times for three
occupants in j = 4 runs
out of n = 9 runs, M
*
4 ¼ M1 ¼ 14
P1 < 4 < 9
j¼1 m1j; M2 ¼
1
j
27. P1 < 4 < 9
j¼1 m2j;M3 ¼
�
1
4
P1 < 4 < 9
j¼1 m3jÞ: If j = n, M
*
j becomes M
*
n ¼ðM1; . . . ;MnÞ where M1 ¼ 1n
Pn
j¼1 m1j;
M2 ¼ 1n
Pn
j¼1 m2j; . . . ; Mj ¼
1
n
Pn
j¼1 mqj: Thus, M
*
j represents the average curve cor-
28. responding to all j = n runs. For instance, if n = 9 runs, M
*
9 ¼ðM1 ¼
1
9
P9
j¼1 m1j; M2 ¼
1
9
P9
j¼1 m2jM3 ¼
1
9
P9
j¼1 m3jÞ.
2.2.1. Convergence Measure 1: TET. The vector mn can also be
called TETj, TET
(also called Required Safe Egress Time in the context of
performance based
1552 Fire Technology 2014
design [17]), corresponding to the jth run. Therefore, there are
several simulated
TETj, each one corresponding to the jth run for a total of n
runs.
29. The jth TETs TETi for n runs of the same scenario simulated
with an evacua-
tion model can be represented using the vector TET
���*
¼ TET1; . . . ; TETnð Þ.
The arithmetic mean of the TETs for j runs can be expressed
using TETavj (see
Equation 10):
TETavj ¼
1
j
X
j
i¼1
TETi ð10Þ
The set of all n consecutive mean TETs TETavj of the same
scenario simulated
with an evacuation model is TETav = (TETav1,…, TETavn).
TETav1 is assumed to
correspond to the value in run 1, TETav2 is the average for j =
2,…, TETavn the
average for j = n.
Applying the law of large numbers, the consecutive mean TETs
TETavi can be
interpreted as a series converging to an expected value (the
mean TET). Hence, a
30. measure of the convergence of the series can be performed.
A measure of the convergence of two consecutive mean TETs
TETavj (e.g. TETav1
and TETav2) is obtained calculating TETconvj (see Equation
11). It is expressed
(in %) as the difference of two consecutive mean TETs divided
by the last mean
evacuation time. This convergence measure assumes that the
best approximation of
the expected value (the mean TET) is the last mean evacuation
time.
This produces a total of p = n-1 TETconvj.
TETconvj ¼ j
TETavj � TETavj�1
TETavj
j ð11Þ
Figure 5. Vector M
*
j in relation to the considered number of runs.
Analysis of Behavioural Uncertainty 1553
The last TETconvj value, corresponding to all n runs is
TETconvFIN (see Equa-
tion 12).
TETconvFIN ¼ j
TETavp � TETavp�1
31. TETavp
j ð12Þ
2.2.2. Convergence Measure 2: SD of TETs. Convergence
variables can also be
presented in terms of the SD of TETs.
The jth SD SDj for n runs of the TET of the same scenario
simulated with an
evacuation model can be represented by the vector SD
*
¼ SD1; . . . ; SDnð Þ.
Also in this case, the application of the law of large numbers
permits the inter-
pretation of the consecutive SDs of TETs SDj as a series
convergent to an expec-
ted value (the mean SDs of TETs). Therefore, a measure of the
convergence of
the series is possible.
A measure of the convergence of two consecutive SDs SDj (e.g.
SD1 and SD2)
is obtained by calculating SDconvj. It is expressed (in %) as the
difference of two
consecutive SDs divided by the last SD (see Equation 13). This
produces a total
of p = n-1 SDconvj. This convergence measure assumes that the
best approxima-
tion of the expected value (the mean SD of TETs) is the last SD
of TETs.
SDconvj ¼ j
32. SDj � SDavj�1
SDj
j ð13Þ
The last SDconvj value, corresponding to all n runs, is
SDconvFIN (see Equation 14).
SDconvFIN ¼ j
SDavp � SDavp�1
SDavp
j ð14Þ
2.2.3. Convergence Measure 3: ERD. A set of ERD can be
calculated, each one
corresponding to two consecutive pairs of vectors M
*
j representing the progressive
average occupant-evacuation time curves.
A vector ERD
���*
¼ ERD1; . . . ; ERDp
� �
is made of p consecutive ERDj where
p = j - 1, corresponding to average j runs of the same scenario
simulated with
an evacuation model. For instance, in the case of j = 4 runs,
ERD
���*
33. ¼ ERD1; ERD2; ERD3ð Þ where ERD1 is calculated from the
comparison
between M1 and M2, ERD2 is calculated from the comparison
between M2 and
M3 and ERD3 is calculated from the comparison between M3
and M4. M1 repre-
sents the curve from run 1, M2 represents the average curve
generated by the
arithmetic means of the individual occupant evacuation times
for run 1 and run 2,
M3 represents the average curve generated by the arithmetic
means of the individ-
ual occupant evacuation times for run 1, run 2 and run 3. M4
represents the
1554 Fire Technology 2014
average curve generated by the arithmetic means of the
individual occupant evac-
uation times for run 1, run 2, run 3 and run 4.
The consecutive ERDj can be interpreted as a series convergent
to the expected
value equal to 0 (the case of two curves identical in magnitude).
Hence, a measure
of the convergence of the series is possible. A measure of the
convergence of two
consecutive ERDs ERDj corresponding to two consecutive
average curves M
*
j can
34. be obtained calculating ERDconvj (see Equation 15). It is
expressed as the absolute
value of the difference of two consecutive ERDs ERDj and
ERDj-1.
ERDconvj ¼ jERDj � ERDj�1j ð15Þ
The last ERDconvj value, corresponding to the differences
between the latest aver-
age curves is ERDconvFIN (see Equation 16).
ERDconvFIN ¼ jERDp � ERDp�1j ð16Þ
Calculation of ERDconvj permits estimation of the impact of
the number of runs
on the overall differences between consecutive average curves.
ERDconvFIN repre-
sents therefore a tool to understand the behavioural uncertainty
associated with
multiple runs of an individual evacuation scenario.
2.2.4. Convergence Measure 4: EPC. The same type of
convergence measures can
be produced for the EPC.
The consecutive EPCj can be interpreted as a series convergent
to the expected
value equal to 1 (the best possible agreement between two
consecutive EPCj).
Hence, a measure of the convergence of the series can be
performed. This results
in Equations 17 and 18.
EPCconvj ¼ jEPCj � EPCj�1j ð17Þ
EPCconvFIN ¼ jEPCp � EPCp�1j ð18Þ
35. ERDconvj permits the estimation of the impact of the number of
runs on the possi-
ble agreement between two consecutive average curves.
ERDconvFIN is therefore
another indicator of the behavioural uncertainty associated with
multiple runs of
an individual evacuation scenario.
2.2.5. Convergence Measure 5: SC. Convergence measures can
be developed for
the SC. The consecutive SCj can be interpreted as a series
convergent to the
expected value equal to 1 (the case of two identical shapes of
consecutive curves).
Hence, a measure of the convergence of the series can be
performed and it is pre-
sented in Equations 19 and 20.
SCconvj ¼ jSCj � SCj�1j ð19Þ
Analysis of Behavioural Uncertainty 1555
SCconvFIN ¼ jSCp � SCp�1j ð20Þ
SCconvj allows understanding of the impact of the number of
runs on the possible
differences between the shapes of two consecutive average
curves. SCconvFIN repre-
sents therefore a variable to understand the behavioural
uncertainty associated
with the average shape of the simulated curves, given a certain
number of runs n
of the same evacuation scenario.
36. 2.3. The Evaluation Method
Five variables have been presented in the previous section,
namely TETconvFIN,
SDconvFIN, ERDconvFIN, EPCconvFIN, and SCconvFIN.
Those variables represent the
basis for a novel evaluation method. The proposed method
addresses two key
aspects of evacuation modelling:
(1) The analysis of behavioural uncertainty of an individual
evacuation scenario.
(2) The identification of the optimal number of runs to produce
a stable evacua-
tion curve of the same scenario in relation to the evacuation
scenario and the
model in use.
An iterative method is suggested for the evaluation of
evacuation model results.
The method is based on five steps (see Figure 6).
[1] Define the acceptance criteria
TRTET, TRSD, TRERD, TREPC, TRSC.
CONSIDERATIONS
Depending on the evacuation
scenarios, model in use, etc.
The users also needs to define how
many consecutive runs are needed
to satisfy the conditions.
37. [2] Simulate a finite set of n runs of
the same evacuation scenario
END
CONSIDERATIONS
The initial number of simulations is
an arbitrary number set by the model
user
[4] Compare the convergence units
with the acceptance criteria
YES
NO
[5] Simulate a set of additional runs m
so that the new set of runs for the
comparison is S=n+m
[3] Calculate the convergence units
TETconvj , Sdconvj , ERDconvj ,
EPCconvj , and SCconvj
[4bis] Are all conditions satisfied?
TETconvj < TRTET for b consecutive runs
SDconvj < TRSD for b consecutive runs
ERDconvj < TRERD for b consecutive runs
EPCconvj < TREPC for b consecutive runs
SCconvj < TRSC for b consecutive runs
38. Figure 6. Schematic flow chart of the proposed evaluation
method.
1556 Fire Technology 2014
Step 1. Define the acceptance criteria [see (1) in Figure 6].
The first step of the method consists of the identification of the
acceptable
thresholds to be achieved, i.e. the accepted behavioural
uncertainty associated
with the average curve obtained by multiple runs of the same
scenario. The aim
is to obtain an evacuation curve that is sufficiently stable given
the scope of the
analysis. For example, in the case of the use of evacuation
modelling in the con-
text of performance based design, the identification of these
acceptable thresh-
olds can be based on the estimated uncertainty during the
calculation of the
available safe escape time produced using a fire model. This
approach permits a
joint analysis of the uncertainty associated with both the fire
and evacuation sim-
ulations. Five thresholds (corresponding to the five convergence
measures) are
identified, namely TRTET, TRSD, TRERD, TREPC, TRSC. It
should be noted that
there is an additional acceptance criteria that needs to be
assessed, i.e., a finite
number of consecutive runs b for which the acceptable
thresholds must not be
39. crossed. This needs to be assessed in order to verify that the
convergence mea-
sures are stable under certain thresholds over a pre-defined
number of runs. This
requirement is based on the assumptions described in Section 2.
The larger is b,
the higher is the confidence that can be put on the fulfilment of
the acceptance
criteria.
The identification of the acceptance criteria may depend on
several factors
such as the evacuation scenario, the model in use, etc. The
selection of the accep-
tance criteria—which may or may not include all convergence
measures—may be
identified by the evacuation modeller itself or from a third
party.
Step 2. Simulate a finite set of n runs of the same evacuation
scenario [see (2) in
Figure 6].
Evacuation model users select an arbitrary initial number of
simulations of an
individual evacuation scenario, i.e., the same model input is
used. n vectors
m
*
ij ¼ m11; . . . ; mij; . . . ; mqn
� �
corresponding to the simulated evacuation times of
each occupant ith in each jth run are obtained. The occupant-
evacuation time
40. curves are produced ranking the occupants in relation to their
evacuation time.
The vector corresponding to the consecutive average curves M
*
¼ðM1; . . . ;MnÞ
is also generated.
In order to optimize the iterative process, the selection of the
initial arbitrary
number of runs may be based on a qualitative evaluation made
by the evacua-
tion modeller of the variability of the predicted outcome given
the model input
of the scenario under consideration. Nevertheless, this
judgment—which is the
current qualitative method adopted by evacuation modellers to
estimate the opti-
mal number of runs—is not mandatory, since the proposed
method permits a
quantitative study of the impact of the number of runs on the
occupant-evacua-
tion time curve produced by the model.
Step 3. Calculate the convergence measures [see (3) in Figure
6].
The convergence measures presented in the previous sections
are calculated for
all runs, i.e., TETconvj, SDconvj, ERDconvj, EPCconvj, and
SCconvj.
In order to perform the calculation of the SCs for all runs,
model users need
Analysis of Behavioural Uncertainty 1557
41. also to identify a finite set of values for s, needed for the
calculation of SCconvj.
As described in Section 2.1, the choice of the values for s relies
on the dataset
under consideration. SCconvj are calculated for all runs for as
many s values as
chosen by the model user.
Step 4-4bis. Compare the convergence measures with the
acceptance criteria [see
(4-4bis) in Figure 6].
The model user compares the calculated convergence measures
against the
acceptable thresholds defined during Step 1. This produces five
tests that need to
be accomplished:
Test 1:
TETconvj < TRTET for b consecutive number of runs ð21Þ
Test 2:
SDconvj < TRSD for b consecutive number of runs ð22Þ
Test 3:
ERDconvj < TRERD for b consecutive number of runs ð23Þ
Test 4:
EPCconvj < TREPC for b consecutive number of runs ð24Þ
42. Test 5:
SCconvj < TRSC for b consecutive number of runs ð25Þ
It should be noted that the criteria need to be satisfied for a pre-
defined finite
number of consecutive b runs (as defined during Step 1). The
values correspond-
ing to the jth run where the conditions are verified for b
consecutive runs repre-
sent TETconvFIN, SDconvFIN, ERDconvFIN, EPCconvFIN,
and SCconvFIN. If the five
conditions are all satisfied for a pre-defined number of
consecutive runs, the
curves generated by n number of runs meet the acceptance
criteria, i.e. the average
curve is estimated given an accepted behavioural uncertainty
associated with the
number of runs (based on the acceptance criteria). If one or
more of the condi-
tions are not satisfied, the model user needs to proceed with
Step 5.
Step 5. Simulate a set of additional simulations m so that the
new set of runs for
the comparison is S = n + m [see (5) in Figure 6].
1558 Fire Technology 2014
The model user sets an arbitrary number of additional
simulations to be run.
The definition of the additional runs can be set in accordance
with a qualitative
analysis of the failed tests. A new set of S ¼ n þ m S
43. *
ij vectors S
*
ij ¼
S11; . . . ; Sij; . . . ; SqS
� �
corresponding to the average simulated evacuation times of
each occupant ith in each jth run are obtained. The same
methodology of Step 2
is adopted to produce the occupant-evacuation time curves, i.e.,
the occupants
are ranked in relation to their evacuation time. The model user
can now re-start
the procedure starting from Step 3.
3. Case Study
An application of the method presented in Section 2 is
described to provide an
example of the concepts. Given the explanatory scope of the
example, data used in
this section are fictitious, i.e., they do not correspond to real
data. This choice has
been driven by the current lack of repeated experimental data,
i.e. the method has
been applied to study simulation results. Data are created in
order to be representa-
tive of the results obtained with an evacuation model for a
hypothetical evacuation
scenario. A fictitious set of numbers is produced using
Wichman and Hill’s [18]
pseudo-random generator. The pseudo-random numbers are used
44. as input to pro-
duce lognormal-distributed values. This choice was made in
order to be representa-
tive of a hypothetical evacuation scenario which is influenced
by pre-evacuation
times (which generally follow a log-normal distribution [17]).
The fictitious data are
then used to create fictitious individual evacuation times
calculated by progressively
summing the values obtained (in order to be representative of a
hypothetical real
case study where total evacuation times range approximately
between 1100 s and
1900 s). For example, if the first pseudo-random generated
number is 12.41 and the
second pseudo-random generated number is 18.18 s, the
evacuation time of the first
occupant out would correspond to 12.41 s and the evacuation
time of the second
occupant out would be 12.41 s + 18.18 s = 30.59 s. The
procedure is repeated for
all 120 occupants (see Table 1). An example of one possible
curve is provided in Fig-
ure 7. The assumed population consists of 120 occupants. The
evaluation of the
number of runs to be simulated is the unknown variable of this
example.
The steps of the evaluation method are applied as follows.
Step 1. Define the acceptance criteria.
This step deals with the definition of the five acceptable
thresholds TRTET,
TRSD, TRERD, TREPC, TRSC about the impact of the number
of runs on the
45. predicted outcome of the evacuation model for the same
evacuation scenario (see
Eqs. 26–30). The number of consecutive runs b = 10 for which
the acceptance
thresholds needs to be accomplished is also defined.
TRTET ¼ 0:5% ð26Þ
TRSD ¼ 5% ð27Þ
Analysis of Behavioural Uncertainty 1559
TRERD ¼ 1% ð28Þ
TREPC ¼ 1% ð29Þ
TRSC ¼ 1% ð30Þ
For instance, this means that the acceptance criteria are
satisfied if
TETconvj < TRTET for 10 consecutive runs, SDconvj < TRSD
for 10 consecutive
runs, etc.
It should be noted that the acceptance criteria have been
selected with the only
purpose of showing the procedure, i.e., they do not represent
recommended values
for use in real engineering analyses. Nevertheless, those criteria
represent possible
values in the context of fire safety engineering in relation to all
types of uncer-
tainty associated with modelling results. In fact, the authors
argue that thresholds
46. below 5% would permit the assessment of the required safe
egress time with a
reasonable degree of accuracy. The definition of the criteria
would be dependent
0
200
400
600
800
1000
1200
1400
1600
0 20 40 60 80 100 120
E
v
a
c
u
a
ti
o
47. n
t
im
e
(
s
)
Occupants out (n)
Figure 7. Fictitious data representing one possible curve of
evacua-
tion times.
Table 1
Example of Fictitious Data Representing One Possible
Occupant-
Evacuation Curve
Occupants out Pseudo-random generated number Evacuation
time (s)
1 12.41 12.41
2 18.18 30.59
3 20.22 50.81
4 8.43 59.24
… … …
120 … 1401.09
48. 1560 Fire Technology 2014
on several factors, such as the type of evacuation scenario, data
under consider-
ation, the scope of the analysis, etc.
Step 2. Run a finite set of n runs of the same evacuation
scenario.
An arbitrary initial number of simulations of the same scenario
is set to 35.
n = 35 vectors of 120 dimensions m
*
ij ¼ m11; . . . ; mij; . . . ; m12035
� �
corresponding
to the simulated evacuation times of each occupant ith (for a
total of 120 occu-
pants) in each jth run are obtained (for a total of 35 runs).
In the present example, the 35 fictitious curves have been
generated using the
method described at the beginning of Section 3. They result in
the 35 curves
showed in Figure 8. The curves presented in Figure 7 are
representative of a set
of repeated results of an evacuation model in the case of a
hypothetical evacua-
tion scenario for lognormal distribution of evacuation times
[19]. It should be
noted that the shape of the evacuation curves may be different
49. than the example
provided here (e.g. s-shaped occupant-evacuation curves). The
method is based
on convergence measures which are independent on the shape of
the curves, thus
it may be applicable for any type of curve.
The vector corresponding to the consecutive average curves
M
*
¼ðM1; . . . ;M35Þ is also generated.
Step 3. Calculate the convergence measures.
The convergence measures presented in the previous sections
are calculated for
all 35 runs, i.e., TETconvj, SDconvj, ERDconvj, EPCconvj, and
SCconvj in accordance
to Equations 11, 13, 15, 17, and 19, respectively. In this
example a single value
for s in Equation 19 has been used, namely s = 4. Results are
presented in
Table 2.
Step 4-4bis. Compare the convergence measures with the
acceptance criteria.
Results for 35 runs are compared with the acceptance criteria
defined in Step 1
(see also Equations 21–25). Table 3 shows the results of the
tests in relation to
the number of runs. When the box shows ‘‘FAILED’’, it means
that the test is
0
51. Figure 8. Fictitious data representing 35 runs of the same
hypotheti-
cal evacuation scenario.
Analysis of Behavioural Uncertainty 1561
failed. When the test is passed, the box is left blank. After 10
consecutive runs
(given the acceptance criteria defined in Step 1), when the test
is passed, the box
shows ‘‘OK’’, which means that the acceptance criteria have
been met.
In this example, Test 1 failed, Test 2 is passed after 25 runs,
Test 3 is accom-
plished after 26 runs, Test 4 is failed, and Test 5 is
accomplished after 15 runs.
This means that our predicted curve meet the acceptance criteria
with regards of
the SD of the TET, the ERD and the SC. Nevertheless, there are
two criteria
that have not been met (TET and EPC). It is therefore necessary
to proceed with
Step 5 by conducting additional runs.
Table 2
RESULTS Corresponding to 35 Runs of the Same Evacuation
Scenario
(Expressed in %)
Run (n) TETconvj (%) SDconvj (%) ERDjconv (%) EPCjconv
(%) SCjconv (%)
54. Step 5. Simulate a set of additional simulations m so that the
new set of runs for
the comparison is S = n + m.
Another set of runs m = 35 of the same scenario—corresponding
to addi-
tional 35 occupant-evacuation time curves—are considered for a
total of
S = n + m = 35 + 35 = 70 runs. In this example, additional
fictitious data
are produced using the same method as the first 35 curves. A
new set of
S = n + m S
*
ij vectors S
*
ij ¼ S11; . . . ; Sij; . . . ; SqS
� �
corresponding to the average
simulated evacuation times of each of the 120 occupant ith in
each of the 70 jth
run S are produced.
Table 3
Summary of the Results of the Tests in Step 4
Run Test 1 Test 2 Test 3 Test 4 Test 5
1 / / / / /
57. The evaluation method is now repeated for S = 70 runs, starting
from Step 3,
called here Step 3.2.
Step 3.2. Calculate the convergence measures.
The failing convergence measures are calculated for S = 70
runs, i.e.,
TETconvFIN, and EPCconvFIN for our case study.
Step 4.2-4.2bis. Compare the convergence measures with the
acceptance criteria.
Results for S = 70 runs are compared again with the acceptance
criteria
defined in Step 1. Table 4 shows the results of the tests that
were previously fail-
ing in relation to the number of runs.
Table 4 shows that Test 4 is accomplished after 40 runs. An
example of the
number of runs required to accomplish different criteria for
TRTET (where
TETconvj < TRTET for 10 consecutive runs) for the fictitious
data-set under consid-
eration is shown in Figure 9. The grey dashed vertical line
refers to the acceptance
criteria TRTET = 0.5% which has been selected for the analysis
of the TET in
Step 1. Test 1 is passed after 61 runs if the convergence criteria
are TETconvj <
0.5% for 10 consecutive runs. This means that our predicted
curve now meet all
acceptance criteria.
58. Table 4
Results of Test 1 and Test 4 for 70 Runs
Run Test 1 Test 4 Run Test 1 Test 4 Run Test 1 Test 4
1 24 47
2 Failed 25 48
3 Failed Failed 26 Failed 49
4 Failed Failed 27 Failed 50
5 Failed Failed 28 51 Failed
6 Failed Failed 29 Failed Failed 52
7 30 Failed 53
8 Failed Failed 31 54
9 Failed Failed 32 Failed 55
10 Failed Failed 33 56
11 Failed 34 57
12 Failed 35 58
13 Failed 36 59
14 Failed 37 60
15 Failed Failed 38 61 OK
16 Failed 39 62
59. 17 Failed 40 Failed OK 63
18 Failed Failed 41 64
19 Failed 42 Failed 65
20 Failed 43 66
21 44 67
22 45 68
23 Failed 46 69
70
1564 Fire Technology 2014
4. Discussion
The analysis of the trend of the convergence measures is useful
to obtain general
information on the type of data-set under consideration. For
example, it is possi-
ble to assess behavioural uncertainty and therefore estimate the
impact of the use
of stochastic variables/distributions on evacuation model
results.
An example from the data of the case study in Section 3.1 is
presented in Fig-
ure 10 where TETconvj and SDconvj are shown as well as
Figure 11 where ERDconvj,
60. EPCconvj, and SCconvj are shown (convergence measures are
calculated for a total
of 140 consecutive average number of runs, i.e., 70 additional
runs have been ana-
lysed).
0
10
20
30
40
50
60
70
0.0 0.5 1.0 1.5 2.0 2.5 3.0 3.5 4.0 4.5 5.0
N
u
m
b
e
r
o
f
61. ru
n
s
(
n
)
Criteria for TRTET (%)
Figure 9. Number of required runs in relation to different
criteria for
TRTET.
0
2
4
6
8
10
12
14
16
18
0 20 40 60 80 100 120 140
62. %
Number of runs (n)
TETconvj SDconvj TRtet TRsd
Figure 10. TETconvj, SDconvj in relation to the consecutive
average
number of runs (expressed in %).
Analysis of Behavioural Uncertainty 1565
Figures 10 and 11 show that the SD of the evacuation time
SCconvj of the last
occupant is the slowest converging variable. Together with
TETconvj, those vari-
ables are useful to understand the variability of the TET in
relation to the number
of runs. An estimation of uncertainty (including behavioural
uncertainty) associ-
ated with the TET is a key aspect of fire safety engineering
analysis since it repre-
sents the required safe egress time (RSET) [19], the time needed
by all occupants
to perform a safe evacuation.
The analysis of the convergence of ERDconvj, EPCconvj, and
SCconvj is also a sig-
nificant contribution to the understanding of behavioural
uncertainty, since it per-
mits the analysis of the variability of the predicted occupant-
evacuation time
curves in relation to the number of runs. In the example
63. provided here, the con-
vergence measures are below 2.5% after 17 runs, thus
permitting the estimation of
the average occupant-evacuation time curve with an admitted
2.5% variability in
a relatively small number of runs.
The simulation of additional 70 runs (for a total of 140 runs in
Figures 10
and 11) shows that, as expected, results continue to converge
and the effect of
behavioural uncertainty on average occupant evacuation time is
progressively
reduced. Nevertheless, if the acceptance criteria include the
requirement of being
below the thresholds for a sufficient number of consecutive runs
(i.e. a critical
number that the model user should select in relation to the
scenario under consid-
eration in order to verify the stability of the convergence), the
simulation of addi-
tional runs does not provide any additional benefits to the
modeller. The selection
of the number of runs is optimised in relation to the pre-defined
acceptance crite-
ria and there is no need to simulate additional runs.
A statistical estimation of the uncertainty associated with the
use of the conver-
gence measures can be performed in relation to the number of
runs. This includes
the study of the uncertainty of the sample average TETs and the
sample SDs.
0
2
64. 4
6
8
10
12
14
16
18
0 20 40 60 80 100 120 140
%
Number of runs (n)
ERDjconv EPCjconv
SCjconv TRerd = TRepc = TRsc
Figure 11. ERDconvj, EPCconvj, and SCconvj in relation to the
consecu-
tive average number of runs (expressed in %).
1566 Fire Technology 2014
Assume that each TET in the vector TET
*
is a sum of random variables corre-
sponding to the inter-temporal times between each occupant.
Applying the central
limit theorem, the series corresponding to the vector TET
65. *
consists of normally dis-
tributed values TETj � N(l, r2), where l is the true mean value
and r2 is the true
variance. The sample variance is:
s2 ¼
Pn
j¼1 TETj � TETavj
� �2
n � 1
ð31Þ
where n is the number of runs. Applying Cochran’s theorem, s2
� r2n�1 v
2
n�1, a Chi
squared distribution with n - 1 degrees of freedom. Then, the
variance of the
sample variance, Var(s
2
), corresponds to:
Varðs2Þ¼ Var
r2
n � 1
v2n�1
� �
66. ¼
r2
n � 1
� �2
Var v2n�1
� �
¼
r2
n � 1
� �2
2 n �1ð Þ¼
2r4
n �1
ð32Þ
The sample SD s is distributed as a chi distribution with n - 1
degrees of free-
dom, i.e., s � rffiffi
n
p
�1 vn�1. Hence the variance of the SDs of the sample data
corre-
sponds to:
Var sð Þ¼ Var
68. 4
3
5
ð33Þ
where C(n) is a gamma function. Hence, it is possible to
estimate the relative SD
(the relative difference between the use of sample SDs and the
SDs corresponding
to the true distribution):
relative Std sð Þ¼
ffiffiffiffiffiffiffiffiffiffiffiffiffiffiffiffiffiffiffiffiffiffiffiffiffiffi
ffiffiffiffiffiffiffiffiffiffiffiffiffiffiffiffiffiffi
n � 1� 2 C
n
2ð Þ
C n�1
2ð Þ
2
" #
n � 1
v
u
69. u
u
u
t
ð34Þ
This information permits an estimation of the uncertainty
associated with the use
of the estimate SDs SDj employed in the evaluation method in
relation to the
number of runs under consideration.
It is also possible to perform an estimation of the uncertainty
associated with
the use of the estimate variance of the sample data s
2
when calculating the aver-
age sample TET TETavj. In fact, the average of the TET TETavj
is distributed as
Analysis of Behavioural Uncertainty 1567
s
ffiffi
n
p tn�1 þ l, where tn-1 is a Student t random variable with n-1
degrees of free-
70. dom.
Therefore the variance of the sample average TETavj
corresponds to:
Var TETavj
� �
¼
s2
n
n � 1
n � 3
ð35Þ
And the uncertainty of the TETavj is:
SD TETavj
� �
¼ s
ffiffiffiffiffiffiffiffiffiffiffiffiffiffiffiffiffi
n �1
nðn �3Þ
s
ð36Þ
It is therefore possible to estimate the uncertainty associated
with the number of
runs given the use of the sample TETavj.
71. To date, behavioural uncertainty is generally treated only in a
qualitative man-
ner (performing a qualitative evaluation of the number of runs
to be simulated). It
is argued that the present work would encourage evacuation
model users to per-
form a quantitative treatment of this type of uncertainty given
the simplicity of
the method proposed.
The benefits obtained from the use of the method apply to
design studies as
well as model validation. The proposed method permits an
estimation of the con-
vergence of the simulated occupant-evacuation curve towards
the average curve,
thus increasing the understanding of the model predictions. This
is reflected in a
better understanding of the variability of RSET and the possible
estimation of the
margin of safety of a specific design in relation to behavioural
uncertainty.
From a model validation perspective, to date, two antithetical
approaches may
be used to present model comparison with experimental data,
namely (1) the use
of the best model estimation for the occupant-evacuation time
curve, or (2) the
average occupant-evacuation time curve. The method presented
in this section
increases the usability of the second approach, since it allows a
thorough quanti-
tative understanding of the average curves produced by
evacuation models. Future
work based on the presented method is therefore a definition of
72. an evacuation
model validation protocol which uses the convergence measures
to assess the dif-
ferences between model predictions and experimental data by
taking into account
behavioural uncertainty.
A possible application of the method presented in this paper
may be its use for
the comparison of model predictions produced by different
evacuation models. It
would be in fact possible to quantify the impact of the
stochastic variables and
assumptions used by different evacuation models given the same
evacuation sce-
nario.
5. Limitations
A set of limitations of the proposed method can be identified
both in terms of its
assumptions as well as its applicability.
1568 Fire Technology 2014
The first limitation of the method is that it uses the concepts of
convergence in
mean and the central limit theorem rather than a statistical
estimation of the
expected values. Hence, the choice of the requirement for the
finite number of
consecutive runs b for which the acceptable thresholds must not
be crossed should
be carefully evaluated by the modeller in relation to the data
73. under consideration.
This limitation is tempered by the simplicity of the proposed
method, i.e., it can
be applied by evacuation modellers to analyse behavioural
uncertainty without a
complex inferential statistical treatment of the data, which may
require time and
user expertise.
Another limitation of the method is associated with the
assumptions that evacu-
ation curves can be identical between model runs even in the
case of different
behaviours occurring, i.e., the arrival rates to the exits are the
same but they refer
to different occupants or different exits.
With regards of the method applicability, multiple data-sets of a
single evacua-
tion scenario are rarely available in the literature. This makes it
difficult to study
the impact of behavioural uncertainty on experimental data.
Given the current
stage of experimental evacuation research, the proposed method
is mainly applica-
ble to the analysis of behavioural uncertainty in simulation
results. Once addi-
tional experimental data on individual scenarios will be
available, researchers will
be able to use the same concepts introduced in this paper for the
analysis of
behavioural uncertainty in experimental data.
Without multiple experimental data, a single experiment often
represents the
only reference on that specific evacuation scenario, but it is not
74. clear whether it
represents average behaviour or it is a tail of the curve. In fact,
the assessment of
experimental and evacuation model results may also include the
analysis of the
tails of the distribution rather than the analysis of the peaks (i.e.
average values).
Nevertheless, the authors argue that the study of the average
model predictions
together with the variability of results around the average is
deemed to be a useful
method to analyse behavioural uncertainty. The research
community of human
behaviour in fire is aware of the lack of experimental data and
the need to fill this
gap with data collection efforts [2]. In recent years, significant
data collection
efforts have been carried out (e.g. several projects were
performed for different
aspects/conditions of the evacuation process using several tool
to aid the collec-
tion and quality of data [20, 21]). Therefore, it can be argued
that considering a
long-term perspective, it will be possible to assess behavioural
uncertainty also for
experimental data (thus making the method proposed in the
paper applicable also
for that issue).
The method is presented using a case study based on pseudo-
random generated
numbers. Future work can be based on the analysis of the
results of an evacua-
tion model from a real world case study.
6. Conclusions
75. This paper introduces a simple methodology to analyse the
variability of evacua-
tion model predictions of an individual evacuation scenario in
relation to the
Analysis of Behavioural Uncertainty 1569
number of test cases. The method allows increasing the
understanding of the
uncertainty in evacuation model results, which depend on the
stochastic nature of
human behaviour, here called behavioural uncertainty.
This paper presents a step forward towards a more accurate
interpretation of
evacuation model results, because it introduces a novel method
to perform quanti-
tative estimation of the convergence of evacuation model
predictions. In fact, the
use of functional analysis operators permitted the analysis of
the entire occupant-
evacuation time curves, rather than a study focused on the
average and SDs of
evacuation times only.
This paper represents the starting point for a better quantitative
interpretation
of evacuation behaviour. In fact, future applications are
associated with the inter-
pretation of behavioural experimental data as well as the
development of a stan-
dard model validation protocol.
76. Acknowledgments
The authors wish to acknowledge Erica Kuligowski, Craig
Weinschenk, Thomas
Cleary, Anthony Hamins, and Rita Fahy for a comprehensive
review of the paper
before publication. Enrico Ronchi thanks Daniel Nilsson for the
fruitful discus-
sions which have led to the idea of this paper. Finally, the
authors wish to thank
Blaza Toman for her valuable suggestions for the assessment of
the uncertainty
associated with the proposed criteria.
References
1. Hamins A, McGrattan K (2007) Verification and validation of
selected fire models for
nuclear power plant applications. Final Report NUREG-1824.
U.S. Nuclear Regula-
tory Commission
2. Averill JD (2011) Five grand challenges in pedestrian and
evacuation dynamics. In:
Proceedings of the 5th international pedestrian and evacuation
dynamics conference,
pp 1–11
3. Kuligowski E (2011) Predicting human behavior during fires.
Fire Technol 49:101–120
4. McGrattan K, Hostikka S, Floyd J, Baum H, Rehm R, Mell
W, McDermott R (2007)
Fire dynamics simulator (version 5) technical reference guide.
NIST special publication
77. 1018-5
5. Jones WW, Peacock RD, Forney G, Reneke PA (2009)
CFAST—consolidated model
of fire growth and smoke transport (version 6). Technical
reference guide. NIST special
publication 1026
6. Kuligowski ED, Peacock RD, Hoskins BL (2010) A review of
building evacuation
models, 2nd edn. Fire Research Division, National Institute of
Standards and Technol-
ogy, Technical Note 1680
7. Lord J, Meacham B, Moore A, Fahy R, Proulx G (2005)
Guide for evaluating the pre-
dictive capabilities of computer egress models. National
Institute of Standards and
Technology. NIST GCR 06-886
1570 Fire Technology 2014
8. Ronchi E, Kinsey M (2011) Evacuation models of the future.
Insights from an online
survey on user‘s experiences and needs. In: Proceedings of the
advanced research work-
shop: evacuation and human behaviour in emergency situations,
pp 145–155
9. Capote JA, Alvear D, Abreu O, Cuesta A, Alonso V (2012) A
stochastic approach for
simulating human behaviour during evacuation process in
78. passenger trains. Fire Tech-
nol 48:911–925
10. Ronchi E, Nilsson D, Gwynne SMV (2012) Modelling the
impact of emergency exit
signs in tunnels. Fire Technol 48:961–988
11. Galea ER, Filippidis L, Deere S, Brown R, Nicholls, Hifi Y,
Besnard B (2012) IMO
information paper—the SAFEGUARD validation data-set and
recommendations to
IMO to update MSC/Circ. 1238. Safeguard passenger evacuation
seminar, 30 Nov
2012, London
12. Peacock RD, Reneke PA, Davis WD, Jones WW (1999)
Quantifying fire model evalua-
tion using functional analysis. Fire Saf J 33:167–184.
doi:10.1016/S0379-7112(99)00029-6
13. International Standards Organization (2008) ISO/FDIS
16730. Fire safety engineer-
ing—assessment, verification and validation of calculation
methods. ISO/TC92/SC4
14. Galea ER, Deere S, Brown R, Filippidis L (2013) An
Evacuation validation data set
for large passenger ships. In: Proceedings of the pedestrian and
evacuation dynamics
2012 conference
15. Prugovecki E (1981) Quantum mechanics in Hilbert space,
2nd ed. Pure and applied
79. mathematics, a series of monographs and textbooks. Academic
Press, New York
16. Bains R (1992) Applied functional analysis and variational
methods in engineering. Eng
Anal Bound Elem 9:365–366
17. Purser DA, Bensilum M (2001) Quantification of behaviour
for engineering design stan-
dards and escape time calculations. Saf Sci 38(2):157–182
18. Wichmann BA, Hill ID (1982) Algorithm AS 183: an
efficient and portable pseudo-ran-
dom number generator. Appl Stat 31:188–190
19. Ronchi E, Nilsson D (2013) Modelling total evacuation
strategies for high-rise build-
ings. Build Simul. doi:10.1007/s12273-013-0132-9
20. Gwynne SMV, Kuligowski ED, Nilsson D (2012)
Representing evacuation behavior in
engineering terms. J Fire Prot Eng 22(2):133–150
21. Gwynne SMV (2013) Improving the collection and use of
human egress data. Fire
Technol 41(1):83–99
Analysis of Behavioural Uncertainty 1571
http://dx.doi.org/10.1016/S0379-7112(99)00029-6
http://dx.doi.org/10.1007/s12273-013-0132-9
Reproduced with permission of the copyright owner. Further
80. reproduction prohibited without
permission.
c.10694_2013_Article_352.pdfA Method for the Analysis of
Behavioural Uncertainty in Evacuation
ModellingAbstractMethodFunctional Analysis
ConceptsConvergence MeasuresConvergence Measure 1:
TETConvergence Measure 2: SD of TETsConvergence Measure
3: ERDConvergence Measure 4: EPCConvergence Measure 5:
SCThe Evaluation MethodCase
StudyDiscussionLimitationsConclusionsAcknowledgmentsRefer
ences
Escape behavior in factory workshop fire emergencies:
a multi-agent simulation
Kefan Xie • Jia Liu • Yun Chen • Yong Chen
Published online: 24 May 2014
� Springer Science+Business Media New York 2014
Abstract In this study, a multi-agent simulation is con-
ducted to explore the relationship between fire escape
survival rate and occupants’ risk preferences and stress
capacity. The results indicate that, the escape survival rates
for occupants with different risk preferences and stress
capacities can be significantly different. More specifically,
the simulation shows that the smaller the number of
81. occupants is in a fire, the higher the survival rate can be
expected. In addition, the simulation shows that the larger
the number of individuals with stronger stress capacities is
in a group, the higher the escape survival rate the group
has. Moreover, the simulation shows that the more disperse
the individuals’ risk preferences is in a group, the higher
the escape survival rate the group has. Based on the sim-
ulation results, the paper proposes a framework of
E-evacuation system to guide the rational escape and
evacuation when enterprise workshop fire occurs. Sugges-
tions for increasing escape survival rates during fires are
provided.
Keywords E-evacuation � Risk preference � Stress
ability � Multi-agent system � Fire � Evacuation � Escape
survival rate
1 Introduction
Fire is one of the most common emergencies. It may cause
huge property damages and casualties, especially in places
such as cinemas and factories. In such places, it is extre-
82. mely hard for occupants to escape. If occupants have not
received any escape training before or a well prepared
escape plan is not available, they can hardly survive. This
is simply because in such emergent conditions, occupants
have to make a correct decision right away and take proper
actions immediately. The correct escape decision and
proper actions in scene of a fire means the difference
between life and death.
In the past decades, scholars have explored occupants’
decision making and escape behaviors in emergencies. For
example, Kelley and Condry [13] find that the more the
losses are, the lower the escape survival rate is; and that the
bigger a group is, the fewer group numbers escape suc-
cessfully. They also find that if the behaviors of group
members are guided by each other, the escape results will
change; and that a positive expression of a group’s confi-
dence will substantially increase the group’s success
escape rate. Helbing et al. [10] explore the irrational
83. characteristics of the group panic escape behaviors in
emergencies. Saloma et al. [23] study the self-organized
queuing and scale-free behavior in real escape panic. Joo
et al. [11] conducted agent-based simulation of affordance-
based human behaviors in emergency evacuation. Lv et al.
[16] examine evacuation decision-making behaviors and
risk analysis under multiple uncertainties in emergencies.
Ozbay et al. [18] model the emergency evacuation in
Northern New Jersey based on a regional transportation
planning tool. Pereira et al. [19] employ a finite automata
approach to simulate the evacuation of a congested popu-
lation in emergency. Sun et al. [29] develop an emergency
K. Xie � J. Liu � Y. Chen (&)
School of Management, Wuhan University of Technology,
Hubei 430070, People’s Republic of China
e-mail: [email protected]
Y. Chen
Old Dominion University, Norfolk, VA 23529, USA
123
84. Inf Technol Manag (2014) 15:141–149
DOI 10.1007/s10799-014-0185-1
evacuation information system in order to make emergency
decision-making more effective. Numerous other authors
have studied emergency situations [5, 6, 24, 25, 33, 34, 36].
All of these studies focus on observing occupants’
escape behavior characteristics directly. However, they did
not pay attention to how occupants’ risk preferences and
stress capacity impact their escape behaviors. More spe-
cifically, few researches explore how occupants’ risk
preferences and stress capacity impact escape survival rate
in fires. Risk preference represents an individual’s attitude
to risks. Engelmann and Tamir [4] prove that individuals’
risk preferences have influences on their decision-making
processes with neuroscience methods. Risk preferences can
be divided into risk loving and risk avoiding. According to
Abrahamsson and Johansson [1], the majority of social
85. emergencies resulting in death are related with risk seeding
behaviors. Their further study points out that individual
risk preferences are influenced by circumstances and that
group risk preferences exist. Stress capacity refers to an
individual’s ability to deal with stress when he/she
encounters critical, complex, and difficult situations [31].
Stress capacity can impact the quality of decision [3] and
decision-making process [14, 17]. As such, this paper
adopts a multi-agent simulation to simulate occupants’
emergency escape decision-making process and actions
during a fire in the context of labor-intensive factory
workshops. The goal of this paper is to explore the rela-
tionship between escape survival rate and occupants’ risk
preferences and stress capacity.
The rest of this paper is organized as follows: In Sect. 2,
background of fires occurring in factory workshops is
provided. Occupants’ escape behaviors and the main
challenges for their decision-making during a fire are dis-
86. cussed as well. Section 3 provides an overview of the
multi-agent programming language and modeling envi-
ronment that this paper adopts to simulate factory work-
shop fires. Parameters settings are introduced in this
section. Section 4 lists the behavior rules for agents in this
simulation. In Sect. 5, the operation process of the per-
formed simulation is introduced. Results of the simulation
are discussed in Sect. 6. Based on the simulation, a
framework of E-evacuation system for enterprise workshop
fire emergency is proposed in Sect. 7. At the end, Sect. 8
concludes the whole paper and provides suggestions for
increasing escape survival rates during fires.
2 Background
Occupants in factory workshops must have certain risk
preferences and stress capacities in order to make the
correct decision and take proper actions to escape because
fires occurring in factory workshops are very dangerous
and might cause unexpected losses. The texture and
87. quantity of materials stored in workshops will affect the
speed at which a fire spreads. Specifically, whether the
materials in a workshop are flammable and the degree of
flammability play important roles in fire spreading speeds:
the higher the degree of flammability is, the quicker a fire
spreads. For example, textile workshops are usually full of
combustible materials. Once a textile workshop is on fire,
these materials will cause the fire to spread quickly. As a
result, workers have very little time to escape and suffer
great pressure. Fires occurring in chemical workshops are
more dangerous because other than flammable materials,
toxic substances and explosives are usually stored in these
places. The opportunity for workers to escape from such
fires is pretty slim. In addition, the amount of materials in a
workshop can directly affect the spreading speed of a fire
and occupants escaping routes. Large amount of materials
means many flammable things, long burning time, and
large scale of fire. Meanwhile, the stacked material can
88. block occupants escaping routes. This will slow down the
escaping speed. Furthermore, the logistic model chosen by
a company will affect the inventory in a workshop. Spe-
cifically, the options of first-party, second-party or third-
party logistics by a company will significantly influence the
changing speed of workshop inventory per unit time, which
thereby affects the patency of occupants escaping routes.
Finally, workshop building design is an important factor
that impact workers’ escape. The lack of exits will cause
congestion during the evacuation in a fire.
According to Chu and Sun [2], how long occupant
evacuation last depends on ‘‘fire detection and alarm,
occupant characteristics (such as age, sex, physical and
mental ability, sleeping or waking, and population density),
human behavior in fire (such as seeking information,
informing others, collecting belongings, and choosing an
exit) and building characteristics (such as corridor width,
exit numbers and widths), etc.’’ (p. 1126). Occupants’
89. escape behaviors vary in factory workshop fires. For
example, on August 27, 2011, Bao Dongsheng Plastic
Products Factory in Longgang District, Shenzhen, China
was on fire. Disconcerted workers looked for ways to
escape. In the chaos, two flustered workers jumped from
the workshop building, one dead and another seriously
injured. On December 14, 2009, a workshop at a third floor
with 45 workers in Runsen Shoe Factory in FuZhou, China
caught fire. Because the fire blocked the emergency exit,
workers had to go upstairs and jumped from the 4th floor,
14 seriously injured. In contrast, workers in a workshop fire
breaking out in Ningbo China escaped successfully by
hitting a hole in the wall when the emergency exits was
blocked by the fire.
Fire escape behaviors in factory workshops are the
results of occupants’ decision making that are influenced
142 Inf Technol Manag (2014) 15:141–149
123
90. by many variables, such as interactions between the
occupants, the building, and the developing fire [22]. Dif-
ferent people have different levels of awareness of what is
happening in their surrounding environment [20]. Once
they realize that a fire occurs, occupants make their deci-
sions based on the result of their risk assessment. For
example, they can put out the fire first and then escape, or
escape first and come back later with help to put out the
fire, or take an active but risky way to rush out of the fire
scene, or just wait for rescue. Table 1 shows the main
problems in occupants’ decision making process in a fac-
tory workshop fire.
The key point is that occupants must make their deci-
sions immediately. Sime [28] points out that delays in
occupants starting to move and movement other than
escape could be a major feature of human behavior in fires.
Shields and Boyce [26] indicate that a primary factor
91. contributing to fire deaths is not travel distance to exits, but
delays in warning occupants and extended times before
movement commenced. According to Proulx and Sime [21]
and Sime [28], the delay in starting positive evacuation
actions can be much longer than the time to travel the
distances to and through exits. Occupants do not have
much time to think over the options listed in Table 1. The
condition of workshop can easily boost quick spread fires.
Panic occupants will worsen the chaos at fire scene. Even
worse, emergency exits might be blocked by fires. In such
emergent situations, occupants’ individual risk preferences
and stress capacities play important roles in their decision-
making processes.
Prior research has proved that training, more specifically
risk preference and stress capacity trainings, impact indi-
viduals’ decision making and behaviors in a fire. Fire drill
can help occupants make correct decisions and take proper
actions during a fire. For example, on April 1, 2010, a
92. 2000 m
2
workshop with 1,078 workers in YierKang Shoe
Company in Zhejiang, China was on fire. Thanks to the
regular fire evacuation drills, these workers covered wet
towels on their mouths, followed the scheduled escape
route, and fled the fire in an orderly manner. Fortunately,
the fire did not cause any casualty.
3 Simulation and parameters setting
This study conducts a simulation based on Netlogo to
explore the relationship between escape survival rate and
occupants’ risk preferences and stress capacities. NetLogo
is a multi-agent programming language and modeling
environment for simulating natural and social phenomena
[32]. It allows researchers to give instructions to huge
number of independent ‘‘agents’’ who are operating con-
currently. In this regard, NetLogo can help researchers
‘‘explore connections between micro-level behaviors of
93. individuals and macro-level patterns that emerge from their
interactions’’ [32]. Figure 1 shows the interface of the
established multi-agent simulation applied in this study.
The simulation consists of machinery, equipment, walk-
ways, workshop facades, workshop exits, and safety zones.
Suppose that workshop exterior walls, machinery, and
equipment are taller than an ordinary person’s height and
that no one can stand or walk on the top of the machinery,
equipment or workshop exterior walls.
The simulated event is a fire that occurred at KPT Fit-
ness Equipment Co., Ltd. in Dongguan China. Established
in 1993, KPT has solid experiences in indoor fitness
equipment R&D and manufacturing. It specializes in pro-
ducing electric treadmills, exercise bikes, and elliptical
machines. On March 6, 2012, welding sparks ignited a fire
in one of its workshop on a second floor. Very soon the fire
burned down all windows. Raw materials, such as foam,
burned quickly and stuck together. This caused the work-
94. shop full of a pungent odor. Although 256 occupants were
trapped, they were well organized and escaped in order.
Fortunately, they all survived in this terrible fire.
The multi-agent simulation accepts different parameters
within a certain range. Therefore, various scenarios in
factory workshop fires can be simulated. For example, the
position of the start point of a fire is controlled by hori-
zontal axis (Fire-Start-Point-X [ [-16, 16]) and vertical
axis (Fire-Start-Point-Y [ [-16, 16]). The speed at which a
fire spreads is controlled by fire spread speed (Fire-Spread-
Speed [ [1, 20]). People count (People-count [ [1, 300])
Table 1 Main problem in occupants’ decision making process in
a
factory workshop fire
Decision making
problems
Initial decision Subsequent decision
General decision 1. Fight against
the fire
2. Escape and
95. evacuation
1. Choose fire fight first, when
fire cannot be weakened,
even bigger and more
dangerous, choose to escape
2. Escape successful and
come back to fight against
the fire
Self-save and
waiting for
rescue decision
1. Be active to
escape
2. Wait for the
rescue
1. Not successful in escape,
then wait for the rescue
2. No result in the external
96. rescue, then seek for self-
rescue
Channel (exit)
selection
decision
1. Follow other
occupants to
escape
2. Choose a
nearby exit to
flee
When exit is blocked, choose
some means, such as
smashing windows, hitting
hole in walls, to flee through
the broken exits
Inf Technol Manag (2014) 15:141–149 143
123
97. represents that the number of occupants that are evenly
distributed in the walkways. Stress capacity proportion
(Stress-Capacity-Proportion [ [1, 10]) is the ratio between
the number of occupants with strong stress capacities and
the reciprocal of the value of Stress-Capacity-Proportion.
Risk preference proportion (Risk-Preference-Proportion [
[1, 10]) is the ratio between the number of occupants who
are risk loving and the reciprocal of the value of Risk-
Preference-Proportion. Results vary if different parameters
are set.
4 Behavior regulations for agents
Each unit area in a factory workshop, such as safety zone,
exterior wall, exit, walkway, machine, equipment, and other
fixed facilities, is set as Patch, whereas each occupant is set as
Turtle in this simulation. A Turtle has four attributes, namely
life value, risk preference, stress capacity, and escape direc-
tion. Risk preference has two values: ‘‘0’’ and ‘‘1’’. The former
represents risk loving while the latter means risk avoiding.
98. Similarly, stress capacity has two values: ‘‘0’’ and ‘‘1’’ as well.
The former means weak stress capacity and the latter repre-
sents strong stress capacity. Escape direction have four values,
namely ‘‘1’’, ‘‘2’’, ‘‘3’’, ‘‘4’’. These four values indicate the
directions of the exits that occupants head for and they rep-
resent northwest, northeast, southeast, and southwest respec-
tively. During a factory workshop fire, occupants’ eyesight
might be blocked by smoke or equipment easily. In such an
urgent situation, it is very hard for them to make correct
judgments about what is the shortest way to the nearest exit. In
Netlogo simulation, one Patch usually accommodates one
Turtle. But in factory workshop fires crowded occupants are
trapped in limited spaces. Therefore, in this simulation, a
Patch is set to accommodate two Turtles.
Gwynne et al. [9] and Sime [27] point out that instead of
heading towards the nearest exit, occupants prefer to move
toward other more distant exits with which they have had
previous experience and with which they feel more confi-
99. dent. However, in this simulation, if occupants are familiar
with all formal exits, those who have strong stress capacity
are more likely to calmly observe their surroundings and to
find the shortest way to the nearest exit, whereas those who
have weak stress capacity tend to run about aimlessly
because they randomly choose one exit to escape. In such a
case, stress capacity impact occupants’ decision processes.
However, risk preferences do not have any impact. There-
fore, the study first sets the following rules for Turtles’
decision making in the simulation:
Rule A1: If Turtles are familiar with all formal exits,
those with strong stress abilities choose to escape from
the nearest one;
Rule A2: If Turtles are familiar with all formal exits,
those with weak stress abilities randomly choose one to
escape.
Fig. 1 The interface of system
simulation
144 Inf Technol Manag (2014) 15:141–149
100. 123
In some cases, alternative exits exist but occupants do
not know where they are. Since those with strong stress
abilities prefer to find a nearest exit and those with weak
stress abilities randomly select an exit, all of them have to
face a challenge if their preference is an alternative exit.
Alternative exits are not used often and few occupants
know how to access them and how they work, so it is very
risky to pick an alternative exit during a factory workshop
fire whether this exit is a nearest one or a randomly selected
one. Due to the risks, alternative exits are not crowded as
formal ones. In such a case, risk loving occupants tend to
choose alternative exits, whereas risk avoiding occupants
prefer formal ones. Combining the effects of stress abilities
and risk preferences, the paper continues to set the fol-
lowing rules for Turtles’ decision making in the simulation:
Rule B1: If Turtles only are familiar with formal exits,
101. those risk loving Turtles with high stress capacities
choose to escape from the nearest alternative exit;
Rule B2: If Turtles only are familiar with formal exits,
those risk avoiding Turtles with high stress capacities
choose to escape from the nearest formal exit;
Rule B3: If Turtles only are familiar with formal exits,
those risk loving Turtles with low stress capacities
randomly choose an alternative exit to escape.
Rule B4: If Turtles only are familiar with formal exits,
those risk avoiding Turtles with low stress capacities
randomly choose a formal exit to escape.
5 Simulating operation process
Once the parameters are set, the initialization of the sim-
ulation is done. In the initialization stage, Patches are built
up, including machinery, equipment, walkways, workshop
facades, workshop exits, and scenes of safety zones. Preset
Turtles are randomly distributed to the walkways. In
addition, the attributes of each Turtle are configured based
102. on preset risk preference proportion and stress ability
proportion values.
Next, the simulation moves to the running stage. Turtles
follow the established rules and select an exit first. On one
hand, they need to calculate whether the space in front of a
Patch is big enough to accommodate them. If yes, they can
move on to the next step. If no, their next movement
depends on their positions. For example, if a Turtle is at a
crossing, it can choose a different direction. Otherwise, it
has to take a step backward. When a Turtle arrives at a
target exit, the system will automatically set its location as
a safe area. Accordingly, observation on this Turtle is done.
On the other hand, Turtles need to figure out the intensity
of the fire. The fire will spread at a preset speed, so in a
given period of time a Patch will catch fire. When the fire
reaches a Turtle’s Patch, the turtle’s life value will minus 1.
If a Turtle’s life value is less than 0, the Turtle is dead. The
fire can reach any place inside the workshop other than safe
103. areas. When all areas inside the workshop are covered by
fire, the simulation ends (Fig. 2).
6 Analysis of simulation results
The simulation has three phases. In phase 1, the goal is to
explore how fast the spread speed of fire (FSS) is and the total
number of occupants (PA) that impacts the final escape sur-
vival rate (APA). So risk preference proportion (RPP) and
stress ability proportion (SAP) are both set as 2. Figure 3
shows results of four typical cases, in which FSS are set as 2, 5,
20, and 5 respectively and PA are set as 300, 300, 300, and 150
respectively. All four diagrams indicate that as time goes by
during fires, the number of survival occupants declines. This
means that the longer fires last, the fewer occupants can sur-
vive. According to diagram (1), diagram (2), and diagram (3),
lower speeds of fire cause fewer numbers of deaths. Diagram
(2) and diagram (4) show that the smaller the total number of
occupants is, the higher the survival rate is. Fewer occupants
will cause less congestion, so occupants have less troubles and
104. can escape faster. This result proves the finding reported by
Kelley and Condry [13].
In phase 2, the goal is to explore how stress capacity
ratio impacts the final escape survival rate (APA). Risk
preference ratio is the proportion of the risk preferences of
individuals in a group. Stress capacity ratio refers to the
proportion of the stress capacities of individuals in a group.
The two ratios can be calculated after risk preference
proportion (RPP), stress ability proportion (SAP), and total
number of occupants (PA) are set. In this phase, fire-caught
point is set as the start point (0, 0) and spread speed of fire
(FSS) is set as 5.
Tables 2, 3 and 4 show three cases, in which SAP are set
as 0.1, 0.5, and 1.0 respectively and PA are set as 100, 200,
and 300 respectively. Suppose that occupants are familiar
with all four formal exits, and that they show the analog
value of the escape survival ratio in the group with dif-
ferent individual stress capacity. In each case, the simula-
105. tion runs ten times and generates ten different values of
escape survival rate. The final escape survival rate is the
arithmetic average of these ten values. The three tables
show that the more individuals with strong stress capacities
are in a group, the higher escape survival rate this group
has. This is because individuals with strong stress capaci-
ties are capable of making independent judgments and
choosing a nearest exit, while those with weak stress
capacities are not able do so.
When high stress ability proportion of individuals is
close to 100 %, the highest ratio of escape survival can be
Inf Technol Manag (2014) 15:141–149 145
123
achieved. This is because in such a case everyone escapes
from the nearest exit. When all occupants are evenly dis-
tributed to exits, the selection of each exit is approximately
same. This is the way to minimize congestion and to
106. achieve the best escape survival rate. Meanwhile, the tables
also show that the larger the number of occupants is, the
smaller the escape survival ratio will be eventually.
In phase 3, the goal is to explore how risk preference
ratio and stress ability ratio interactively impact the final
escape survival rate (APA). Most settings are the same as
those in phase 2. The only difference is that phase 3 adds
risk preference proportion (RPP) to the setting list. In three
cases showed in Tables 5, 6, and 7, RPP are set as 0.1, 0.5,
and 1.0 respectively. Suppose that occupants are familiar
with both two formal exits, and that they show the analog
value of the escape survival ratio in the group with
different individual stress ability. In each case, the simu-
lation runs ten times and generates ten different values of
escape survival rate. The final escape survival rate is the
arithmetic average of these ten values.
Tables 5, 6, and 7 demonstrate that when alternative
exits exist, the finding in phase 2 is still valid. The more
107. individuals with strong stress capacities are in a group, the
higher escape survival rate this group has. In addition,
when the group risk preference ratio is set as 0.5, the
highest escape survival rate is achieved. This is because in
this setting the number of risk loving occupants is the same
as the number of risk avoiding ones. Risk loving occupants
choose alternative exits while risk avoiding ones chooses
formal exits. Occupants’ selections drive them to different
exits and congestions are minimized, so the final escape
survival rate rises. This result proves the findings reported
Establish
Circumstances
Patch
Randomly
Distributed Turtle
Setting Turtle’s
Atributes
Low stress ability
Turtle choose exits
at random
108. T
urtle
fam
il iar
w
ith
all
exi ts?
High stress ability
Turtle choose the
nearest exit
Turtle Choose
Escape Exit
High stress ability
and risk loving
Turtle choose the
nearest spare exit
Low stress ability
and risk averse
Turtle choose the
familiar exit at
random
Low stress ability
109. and risk loving
Turtle choose the
spare exit at random
High stress ability
and risk averse
Turtle choose the
nearest familiar exit
The fire spread to an
additional area
The fire not spread
The intensity of fire
gets more serious?
Turtle’s action is
according to the
rules
Full of fire
everywhere
End of Simulation
Turtle is in
walkway?
Turtle, no action
Life - 1
110. Turtle’s walkway
caught fire?
Life, no change
Turtle’s life is
less than 0?
Turtle is dead
Previous Patch has
Two Turtle?
Go one step further
Change to another
direction
Turtle is at the
crossing?
Draw one step back
Turtle is at the exit?
Configure Turtle to a
safe area at random
Y N
Y
N
Y N
111. Y N
N
Y N
Y N
Y
Y
Y
N
T
urtle’s
A
cti o n
R
ule
T
urtle
E
s cape
D
ecision
R
ul es
113. in
S
ystem
O
p erat io n
Purchase amount
Logistics category
Cargo flammability
Fires preading
speed
Logistics category
Fig. 2 Simulation operation process
146 Inf Technol Manag (2014) 15:141–149
123
by Abrahamsson and Johansson [1]. When stress capacity
ratio is set as 1, and risk preference proportion is set as 0.5,
a comparatively high escape survival rate can be achieved.
But it is still lower than the rate when all occupants know
all formal exits. This is because when risk loving/avoiding
114. occupants with high stress capacities choose a formal/
alternative exit that is nearest to them, it is better for them
to know all exits. If they do not, the one they choose might
not be the nearest one.
7 A framework of E-evacuation system for enterprise
workshop fire emergency
Risk management of enterprise workshop fire emergency
covers each stage of fire management, namely beforehand,
concurrent, and afterwards. The key part is how to prepare,
organize, and conduct an orderly evacuation. Information
technology plays an important role in evacuation prepara-
tion, organization, and implementation. As such, this paper
proposes an enterprise workshop fire E-evacuation system
Fig. 3 Some typical simulation
results
Table 2 The 100 occupants
case (all occupants are familiar
with four exits)
SAP 0.1 0.5 1.0
115. APA 78.1 87.1 99.5
Table 3 The 200 occupants
case (all occupants are familiar
with four exits)
SAP 0.1 0.5 1.0
APA 153.0 174.2 197.5
Table 4 The 300 occupants
case (all occupants are familiar
with four exits)
SAP 0.1 0.5 1.0
APA 181.4 221.4 271.3
Table 5 The 100 occupants
case (all occupants are familiar
with two exits)
RPP SAP
0.1 0.5 1.0
0.1 77.2 84.8 88.7
0.5 80.6 87.1 94.8
1.0 79.9 81.8 89.9
116. Table 6 The 200 occupants
case (all occupants are familiar
with two exits)
RPP SAP
0.1 0.5 1.0
0.1 106.5 124.5 139.5
0.5 144.8 150.9 156.7
1.0 102.3 112.1 126.7
Table 7 The 300 occupants
case (all occupants are familiar
with two exits)
RPP SAP
0.1 0.5 1.0
0.1 135.6 135.9 164.7
0.5 164.8 183.7 187.4
1.0 119.2 130.1 145.9
Inf Technol Manag (2014) 15:141–149 147
123
117. shown in Fig. 4. First, enterprises should conduct regular
workshop fire risk evaluation and identify potential risks. A
workshop fire risk early-warning system should be estab-
lished. Once a workshop fire potential risk is found, an in-
time warning should be available. Second, when a work-
shop fire occurs, the E-evacuation system should send out a
fire alarm immediately, start automatic spraying systems,
start electronic contingency plans, and mobilize timely the
fire brigade to put out the fire. Meanwhile, workshop
occupants should make correct decisions and take proper
actions to evacuate. When a fire alarm rings, safe exit signs
should be on.
8 Conclusions
Modeling and simulation has many application domains [7,
8, 12, 15, 30, 35]. This paper conducts a multi-agent simu-
lation to explore the relationship between escape survival
rate and occupants’ risk preferences and stress capacities.
The results verify that the escape survival rates of occupants
118. with different risk preferences and stress capacities are sig-
nificantly different. More specifically, the simulation proves
the finding in Kelley and Condry [13] that the smaller the
total number of occupants is in a fire, the higher the survival
rate is. In addition, the simulation shows that the more
individuals with strong stress abilities are in a group, the
higher escape survival rate this group has. Moreover, the
simulation shows that the more disperse the individuals’ risk
preferences is in a group, the higher the escape survival rate
this group has. These results prove the findings in Abra-
hamsson and Johansson [1] and Kelley and Condry [13].
The following suggestions can be made from the simu-
lation results to increase escape survival rates during fires.
First, make sure that every exit works properly and that
occupants are familiar all available exits. Second, provide
occupants fire escape training so that their stress abilities can
be improved. Third, if alternative exits are available, move
risk-loving workers to work close to these exits. Fourth,
119. conduct fire drills and let occupants be familiar with evac-
uation process. These suggestions can be applied not only to
enterprise workshop fire prevention and evacuation, but also
to emergency management in other densely populated
places.
In addition, enterprises can take the following measures to
manage their fire evacuation process: (1) Help employees
identify safe exit signs. Safe exit signs usually are in green
lights indicating directions in walkways. By following the
green lights, employees can find the exits; (2) Maintain
smooth communication. When fire occurs, emergency notice
should be immediately broadcasted to every corner of the
workshop. The start point of fire should be identified
immediately and reported to the manager. If a fire is out of
workers’ control, emergency call should be made right away
for outside help. The manager(s) should assign workers
immediately to shut down equipment and fight against fire.
Meanwhile, the manager(s) should move important docu-
120. ments and data to safe places; (3) Organize workers to escape
orderly. When a workshop is on fire, the team leaders should
keep calm, count team members, and let them stay where
they are. Then each team should find the nearest safe exit sign
and follow the directions to escape. Workers on the first floor
can jump out of windows directly if the way to exit is
blocked. Workers on the second floor need to hang on the
windowsill first to minimize the height to ground and then
jump. Workers on the third floor and above should close
doors and irrigate them so that the fire can be separated. They
should use a damp cloth mask to prevent inhalation of toxic
gas, and make noises let firefighters know where they are.
They also need to lower their bodies close to the floor
because air in higher position is not good for breath. Occu-
pants should not consider jumping to the ground because it is
easy to get serious hurt or even die. If the condition allows,
occupants can help themselves escape. Otherwise, they
should remain in a safe place and wait for help. When a fire
121. occurs, elevators should not be taken because elevators are
very easy to get stuck due to power outage. Furthermore,
elevator shafts often become chimneys during fires. It is very
risky and dangerous to use elevators during fires. If there are
ladders, occupants can use them and climb to the roof sur-
faces waiting help there.
Acknowledgments This study was supported by National
Natural
Science Foundation of China (90924010) and Independent
Innovation
Research Fund of Wuhan University of Technology (2013-lv-
002).
References
1. Abrahamsson M, Johansson H (2006) Risk preferences
regarding
multiple fatalities and some implications for societal risk
decision
making—an empirical study. J Risk Res 9(7):703–715
Fire Emergency
Risk Evaluation
Fire Emergency Risk
Early-warning
122. Fire Emergency Alarm
Start Electronic
Predominated Plans
Start Automatic
Spraying Systems
Start the Electronic Display of
the Evacuation Paths and Exits
Start the Fire Brigade
Start Internal Workshop
Fire Self-help
Carry out an Orderly
Evacuation
Fig. 4 Framework of E-evacuation system for enterprise
workshop
fire emergency
148 Inf Technol Manag (2014) 15:141–149
123
2. Chu G, Sun J (2008) Decision analysis on fire safety design
based
on evaluating building fire risk to life. Saf Sci 46(7):1125–1136
3. D’Zurilla TJ, Sheedy CF (1991) Relation between social
prob-
123. lem-solving ability and subsequent level of psychological stress
in college students. J Pers Soc Psychol 61(5):841–846
4. Engelmann JB, Tamir D (2009) Individual differences in risk
preference predict neural responses during financial decision-
making. Brain Res 1290:28–51
5. Fang S, Xu L, Pei H, Liu Y (2014) An integrated approach to
snowmelt flood forecasting in water resource management.
IEEE
Trans Ind Inform 10(1):548–558
6. Fang S, Xu L, Zhu Y, Ahati J (2014) An integrated system
for
regional environmental monitoring and management based on
internet of things. IEEE Trans Ind Inform.
doi:10.1109/TII.2014.
2302638
7. Feng S, Xu L (1996) Integrating knowledge-based simulation
with aspiration-directed model-based decision support system.
Syst Eng Electron 7(2):25–33
8. Gao Q, Xu L, Liang N (2001) Dynamic modeling with an
inte-
124. grated ecological knowledge-based system. Knowl-Based Syst
14(5–6):281–287
9. Gwynne S, Galea ER, Owen M, Lawrence PJ (1999) Escape
as a
social response. Society of Fire Protection Engineers, Boston
10. Helbing D, Farkas I, Vicsek T (2000) Simulating dynamical
features of escape panic. Nature 407(6803):487–490
11. Joo J, Kim N, Wysk RA, Rothrock L, Son YJ, Oh YG, Lee S
(2013) Agent-based simulation of affordance-based human
behaviors in emergency evacuation. Simul Model Pract Theory
32:99–115
12. Kataev M, Bulysheva L, Emelyanenko A, Emelyanenko V
(2013)
Enterprise systems in Russia: 1992–2012. Enterp Inf Syst
7(2):169–186
13. Kelley HH, Condry JC Jr (1965) Collective behavior in a
simu-
lated panic situation. J Exp Soc Psychol 1(1):20–54
14. Kobasa SC (1979) Stressful life events, personality, and
health:
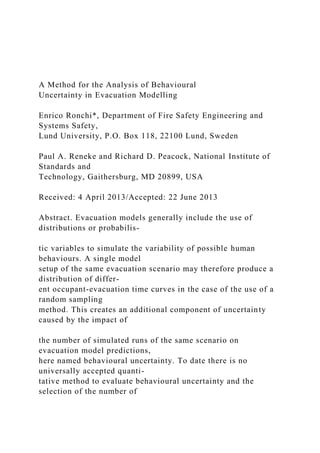
![runs is left to a qualitative judgement of the model user. A
simple quantitative
method using convergence criteria based on functional analysis
is presented to
address this issue. The method permits (1) the analysis of the
variability of model
predictions in relation to the number of runs of the same
evacuation scenario, i.e. the
study of behavioural uncertainty and (2) the identification of the
optimal number of
runs of the same scenario in relation to pre-defined acceptance
criteria.
Keywords: Evacuation modelling, Behavioural uncertainty,
Human behaviour in fire,
Functional analysis, Convergence criteria
1. Introduction
Uncertainty is divided into different components in the context
of fire safety engi-
neering and modelling [1]: model input uncertainty,
measurement uncertainty, and
intrinsic uncertainty.
(1) Model input uncertainty is associated with the parameters
obtained from
experimental measurements that are used as model input, i.e.
the assumptions
employed to derive model input from the experiments.
(2) Measurement uncertainty is associated with the experimental
measurement
itself, i.e., the data collection techniques employed.](data:image/gif;base64,R0lGODlhAQABAIAAAAAAAP///yH5BAEAAAAALAAAAAABAAEAAAIBRAA7)