Mexico-Colorado Trading Relationship Analysis 2004-2010
•
0 likes•175 views

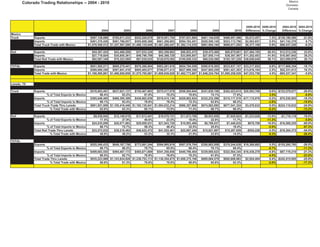
The document summarizes Colorado's trading relationships with Mexico from 2004-2010, broken down by truck and rail trade through major ports like Laredo, Eagle Pass, and Del Rio. It shows that over 80% of total trade with Mexico passed through Laredo, characterized by high truck trade volumes, while Eagle Pass had a more significant portion of rail trade. Del Rio accounted for a negligible share of total trade. Overall, Colorado's trade with Mexico declined slightly from 2004-2010, with truck exports through Laredo decreasing nearly 30% and comprising a smaller portion of total exports.

Recommended
Recommended
More Related Content
What's hot
What's hot (19)
Viewers also liked
Viewers also liked (20)
Similar to Mexico-Colorado Trading Relationship Analysis 2004-2010
Similar to Mexico-Colorado Trading Relationship Analysis 2004-2010 (17)
More from Ports-To-Plains Blog
More from Ports-To-Plains Blog (20)
Recently uploaded
Recently uploaded (20)
Mexico-Colorado Trading Relationship Analysis 2004-2010
- 1. Mexico Colorado Trading Relationships -- 2004 - 2010 Domestic Canada 2009-2010 2009-2010 2004-2010 2004-2010 2004 2005 2006 2007 2008 2009 2010 Difference % Change Difference % Change Mexico Truck Exports $597,138,086 $765,811,233 $932,526,678 $819,951,754 $787,931,084 $461,144,039 $466,957,496 $5,813,457 1.3% -$130,180,590 -21.8% Imports $481,370,426 $561,786,057 $555,608,368 $661,308,693 $594,183,451 $520,550,145 $523,113,796 $2,563,651 0.5% $41,743,370 8.7% Total Truck Trade with Mexico $1,078,508,512 $1,327,597,290 $1,488,135,046 $1,481,260,447 $1,382,114,535 $981,694,184 $990,071,292 $8,377,108 0.9% -$88,437,220 -8.2% Rail Exports $54,367,425 $43,468,208 $37,833,326 $83,309,862 $66,853,475 $39,475,466 $66,879,661 $27,404,195 69.4% $12,512,236 23.0% Imports $27,719,924 $35,855,361 $49,796,709 $45,368,720 $33,805,857 $27,055,114 $38,307,567 $11,252,453 41.6% $10,587,643 38.2% Total Rail Trade with Mexico $82,087,349 $79,323,569 $87,630,035 $128,678,582 $100,659,332 $66,530,580 $105,187,228 $38,656,648 58.1% $23,099,879 28.1% TOTAL Exports $651,505,511 $809,279,441 $970,360,004 $903,261,616 $854,784,559 $500,619,505 $533,837,157 $33,217,652 6.6% -$117,668,354 -18.1% Imports $509,090,350 $597,641,418 $605,405,077 $706,677,413 $627,989,308 $547,605,259 $561,421,363 $13,816,104 2.5% $52,331,013 10.3% Total Trade with Mexico $1,160,595,861 $1,406,920,859 $1,575,765,081 $1,609,939,029 $1,482,773,867 $1,048,224,764 $1,095,258,520 $47,033,756 4.5% -$65,337,341 -5.6% Laredo, TX Truck Exports $516,003,491 $637,021,137 $755,467,803 $575,417,078 $556,504,944 $341,830,106 $362,423,814 $20,593,708 6.0% -$153,579,677 -29.8% % of Total Exports to Mexico 86.4% 83.2% 81.0% 70.2% 70.6% 74.1% 77.6% 3.5% -8.8% Imports $385,648,465 $468,395,309 $436,662,838 $519,415,136 $429,802,924 $332,232,586 $315,117,510 -$17,115,076 -5.2% -$70,530,955 -18.3% % of Total Imports to Mexico 80.1% 83.4% 78.6% 78.5% 72.3% 63.8% 60.2% -3.6% -19.9% Total Truck Trade Thru Laredo $901,651,956 $1,105,416,446 $1,192,130,641 $1,094,832,214 $986,307,868 $674,062,692 $677,541,324 $3,478,632 0.5% -$224,110,632 -24.9% % Total Trade with Mexico 83.6% 83.3% 80.1% 73.9% 71.4% 68.7% 68.4% -0.2% -15.2% Rail Exports $9,536,942 $12,146,619 $17,613,441 $19,578,741 $11,073,760 $9,053,850 $7,820,824 -$1,233,026 -13.6% -$1,716,118 -18.0% % of Total Exports to Mexico 17.5% 27.9% 46.6% 23.5% 16.6% 22.9% 11.7% -11.2% -5.8% Imports $24,035,090 $26,071,863 $29,009,031 $21,943,720 $10,993,480 $6,768,037 $7,446,835 $678,798 10.0% -$16,588,255 -69.0% % of Total Imports to Mexico 86.7% 72.7% 58.3% 48.4% 32.5% 25.0% 19.4% -5.6% -67.3% Total Rail Trade Thru Laredo $33,572,032 $38,218,482 $46,622,472 $41,522,461 $22,067,240 $15,821,887 $15,267,659 -$554,228 -3.5% -$18,304,373 -54.5% % Total Trade with Mexico 40.9% 48.2% 53.2% 32.3% 21.9% 23.8% 14.5% -9.3% -26.4% TOTAL Exports $525,540,433 $649,167,756 $773,081,244 $594,995,819 $567,578,704 $350,883,956 $370,244,638 $19,360,682 5.5% -$155,295,795 -29.5% % of Total Exports to Mexico 80.7% 80.2% 79.7% 65.9% 66.4% 70.1% 69.4% -0.7% -11.3% Imports $409,683,555 $494,467,172 $465,671,869 $541,358,856 $440,796,404 $339,000,623 $322,564,345 -$16,436,278 -4.8% -$87,119,210 -21.3% % of Total Imports to Mexico 80.5% 82.7% 76.9% 76.6% 70.2% 61.9% 57.5% -4.5% -23.0% Total Trade Thru Laredo $935,223,988 $1,143,634,928 $1,238,753,113 $1,136,354,675 $1,008,375,108 $689,884,579 $692,808,983 $2,924,404 0.4% -$242,415,005 -25.9% % Total Trade with Mexico 80.6% 81.3% 78.6% 70.6% 68.0% 65.8% 63.3% -2.6% -17.3%
- 2. Mexico Colorado Trading Relationships -- 2004 - 2010 Domestic Canada 2009-2010 2009-2010 2004-2010 2004-2010 2004 2005 2006 2007 2008 2009 2010 Difference % Change Difference % Change Eagle Pass, TX Truck Exports $2,536,232 $1,046,890 $7,822,528 $3,952,526 $17,637,459 $8,179,320 $2,074,992 -$6,104,328 -74.6% -$461,240 -18.2% % of Total Exports to Mexico 0.4% 0.1% 0.8% 0.5% 2.2% 1.8% 0.4% -1.3% 0.0% Imports $6,151,126 $6,443,254 $6,589,832 $8,764,202 $30,421,944 $56,267,083 $73,932,497 $17,665,414 31.4% $67,781,371 1101.9% % of Total Imports to Mexico 1.3% 1.1% 1.2% 1.3% 5.1% 10.8% 14.1% 3.3% 12.9% Total Truck Trade Thru Eagle Pass $8,687,358 $7,490,144 $14,412,360 $12,716,728 $48,059,403 $64,446,403 $76,007,489 $11,561,086 17.9% $67,320,131 774.9% % Total Trade with Mexico 0.8% 0.6% 1.0% 0.9% 3.5% 6.6% 7.7% 1.1% 6.9% Rail Exports $29,123,680 $29,966,052 $17,990,128 $55,114,641 $44,427,793 $22,268,126 $34,789,956 $12,521,830 56.2% $5,666,276 19.5% % of Total Exports to Mexico 53.6% 68.9% 47.6% 66.2% 66.5% 56.4% 52.0% -4.4% -1.5% Imports $0 $273,098 $684,399 $205,274 $1,088,597 $417,362 $1,500,649 $1,083,287 259.6% $1,500,649 #DIV/0! % of Total Imports to Mexico 0.0% 0.8% 1.4% 0.5% 3.2% 1.5% 3.9% 2.4% 3.9% Total Rail Trade Thru Eagle Pass $29,123,680 $30,239,150 $18,674,527 $55,319,915 $45,516,390 $22,685,488 $36,290,605 $13,605,117 60.0% $7,166,925 24.6% % Total Trade with Mexico 35.5% 38.1% 21.3% 43.0% 45.2% 34.1% 34.5% 0.4% -1.0% TOTAL Exports $31,659,912 $31,012,942 $25,812,656 $59,067,167 $62,065,252 $30,447,446 $36,864,948 $6,417,502 21.1% $5,205,036 16.4% % of Total Exports to Mexico 4.9% 3.8% 2.7% 6.5% 7.3% 6.1% 6.9% 0.8% 2.0% Imports $6,151,126 $6,716,352 $7,274,231 $8,969,476 $31,510,541 $56,684,445 $75,433,146 $18,748,701 33.1% $69,282,020 1126.3% % of Total Imports to Eagle Pass 1.2% 1.1% 1.2% 1.3% 5.0% 10.4% 13.4% 3.1% 12.2% Total Trade Thru Laredo $37,811,038 $37,729,294 $33,086,887 $68,036,643 $93,575,793 $87,131,891 $112,298,094 $25,166,203 28.9% $74,487,056 197.0% % Total Trade with Mexico 3.3% 2.7% 2.1% 4.2% 6.3% 8.3% 10.3% 1.9% 7.0% Del Rio, TX Truck Exports $245,719 $472,614 $24,444 $104,165 $112,584 $23,021 $86,010 $62,989 273.6% -$159,709 -65.0% % of Total Exports to Mexico 0.0% 0.1% 0.0% 0.0% 0.0% 0.0% 0.0% 0.0% 0.0% Imports $2,874 $0 $0 $6,880 $0 $217,050 $1,372,584 $1,155,534 532.4% $1,369,710 47658.7% % of Total Imports to Mexico 0.0% 0.0% 0.0% 0.0% 0.0% 0.0% 0.3% 0.2% 0.3% Total Truck Trade Thru Del Rio $248,593 $472,614 $24,444 $111,045 $112,584 $240,071 $1,458,594 $1,218,523 507.6% $1,210,001 486.7% % Total Trade with Mexico 0.0% 0.0% 0.0% 0.0% 0.0% 0.0% 0.1% 0.1% 0.1% Rail Exports $0 $0 $0 #DIV/0! $0 #DIV/0! % of Total Exports to Mexico 0.0% 0.0% #DIV/0! #DIV/0! #DIV/0! #DIV/0! #DIV/0! #DIV/0! Imports $0 $0 $0 #DIV/0! $0 #DIV/0! % of Total Imports to Mexico 0.0% 0.0% #DIV/0! #DIV/0! #DIV/0! #DIV/0! #DIV/0! #DIV/0! Total Rail Trade Thru Del Rio $0 $0 $0 #DIV/0! $0 #DIV/0! % Total Trade with Mexico 0.0% 0.0% $0 $0 0.0% 0.0% 0.0% 0.0% TOTAL Exports $245,719 $472,614 $24,444 $104,165 $112,584 $23,021 $86,010 $62,989 273.6% -$159,709 -65.0% % of Total Exports to Mexico 0.0% 0.1% 0.0% 0.0% 0.0% 0.0% 0.0% 0.0% 0.0% Imports $2,874 $0 $0 $6,880 $0 $217,050 $1,372,584 $1,155,534 532.4% $1,369,710 47658.7% % of Total Imports to Mexico 0.0% 0.0% 0.0% 0.0% 0.0% 0.0% 0.2% 0.2% 0.2% Total Trade Thru Del Rio $242,845 $472,614 $24,444 $111,045 $112,584 $240,071 $1,458,594 $1,218,523 507.6% $1,210,001 500.6% % Total Trade with Mexico 0.0% 0.0% 0.0% 0.0% 0.0% 0.0% 0.1% 0.1% 0.1%
- 3. Mexico Colorado Trading Relationships -- 2004 - 2010 Domestic Canada 2009-2010 2009-2010 2004-2010 2004-2010 2004 2005 2006 2007 2008 2009 2010 Difference % Change Difference % Change GPITC Truck Exports $518,785,442 $638,540,641 $763,314,775 $579,473,769 $574,254,987 $350,032,447 $364,584,816 $14,552,369 4.2% -$154,200,626 -29.7% % of Total Exports to Mexico 86.9% 83.4% 81.9% 70.7% 72.9% 75.9% 78.1% 2.2% -8.8% Imports $391,802,465 $474,838,563 $443,252,670 $528,186,218 $460,224,868 $388,716,719 $390,422,591 $1,705,872 0.4% -$1,379,874 -0.4% % of Total Imports to Mexico 81.4% 84.5% 79.8% 79.9% 77.5% 74.7% 74.6% 0.0% -6.8% Total Truck Trade Thru Alliance $910,587,907 $1,113,379,204 $1,206,567,445 $1,107,659,987 $1,034,479,855 $738,749,166 $755,007,407 $16,258,241 2.2% -$155,580,500 -17.1% % Total Trade with Mexico 84.4% 83.9% 81.1% 74.8% 74.8% 75.3% 76.3% 1.0% -8.2% Rail Exports $38,660,622 $42,112,671 $35,603,569 $74,693,382 $55,501,553 $31,321,976 $42,610,780 $11,288,804 36.0% $3,950,158 10.2% % of Total Exports to Mexico 71.1% 96.9% 94.1% 89.7% 83.0% 79.3% 63.7% -15.6% -7.4% Imports $24,035,090 $26,344,961 $29,693,430 $22,148,994 $12,082,077 $7,185,399 $8,947,484 $1,762,085 24.5% -$15,087,606 -62.8% % of Total Imports to Mexico 86.7% 73.5% 59.6% 48.8% 35.7% 26.6% 23.4% -3.2% -63.3% Total Rail Trade Thru Alliance $62,695,712 $68,457,632 $65,296,999 $96,842,376 $67,583,630 $38,507,375 $51,558,264 $13,050,889 33.9% -$11,137,448 -17.8% % Total Trade with Mexico 76.4% 86.3% 74.5% 75.3% 67.1% 57.9% 49.0% -8.9% -27.4% TOTAL Exports $557,446,064 $680,653,312 $798,918,344 $654,167,151 $629,756,540 $381,354,423 $407,195,596 $25,841,173 6.8% -$150,250,468 -27.0% % of Total Exports to Mexico 85.6% 84.1% 82.3% 72.4% 73.7% 76.2% 76.3% 0.1% -9.3% Imports $415,837,555 $501,183,524 $472,946,100 $550,335,212 $472,306,945 $395,902,118 $399,370,075 $3,467,957 0.9% -$16,467,480 -4.0% % of Total Imports to Mexico 81.7% 83.9% 78.1% 77.9% 75.2% 72.3% 71.1% -1.2% -10.5% Total Trade Thru Alliance $973,277,871 $1,181,836,836 $1,271,864,444 $1,204,502,363 $1,102,063,485 $777,256,541 $806,565,671 $29,309,130 3.8% -$166,712,200 -17.1% % Total Trade with Mexico 83.9% 84.0% 80.7% 74.8% 74.3% 74.1% 73.6% -0.5% -10.2%
- 4. Mexico Colorado Trading Relationships -- 2004 - 2010 Domestic Canada Leading Exports from Colorado to Mexico (Surface Leading Exports from Colorado to Mexico 2010 Transportation) 2010 2010 (Surface Transportation) 2010 Rank Export Rank Coahuila Export 1 2 Meat and edible meat offal $146,096,800 1 31 Fertilizers $4,603,512 2 37 Photographic or cinematographic goods $110,494,807 2 39 Plastics and Articles $1,721,372 3 84 Nuclear reactors; boilers; machinery and mechanical $31,685,882 3 84 Computer-Related Machinery and Parts $1,335,007 4 4 Dairy produce; Birds' eggs; Natural honey; Edible $30,998,995 4 27 Mineral Fuels; Oils and Waxes $1,180,157 5 27 Mineral fuels; mineral oils and products of their $29,608,019 5 73 Articles of Iron and Steel $946,912 6 39 Plastics and articles thereof $17,904,199 6 96 Miscellaneous Manufactured Articles $717,892 7 73 Articles of iron or steel $15,622,790 7 85 Electrical Machinery; Equipment and Parts $717,319 8 76 Aluminum and articles thereof $15,353,274 8 64 Footwear $707,953 9 90 Optical; photographic; cinematographic; measuring; $12,964,430 9 82 Tools of Base Metal $392,426 10 87 Vehicles; other than railway or tramway rolling stock; $12,701,378 10 87 Vehicles Other than Railway $349,743 2010 Leading Imports to Colorado from Mexico (Surface 2010 Rank Import 2010 Leading Exports from Colorado from Mexico 2010 1 87 Vehicles Other than Railway $76,172,265 Nuevo Leon Export 2 40 Rubber and Articles $76,019,703 1 2 Meat and Edible Offal $40,662,217 3 84 Computer-Related Machinery and Parts $67,822,718 2 76 Aluminum and Articles $8,765,124 4 90 Measuring and Testing Instruments $47,178,411 3 84 Computer-Related Machinery and Parts $7,420,199 5 37 Photographic Goods $43,066,434 4 10 Cereals $2,053,959 6 73 Articles of Iron and Steel $40,928,021 5 83 Miscellaneous Articles of Base Metals $1,390,653 7 85 Electrical Machinery; Equipment and Parts $40,736,667 6 85 Electrical Machinery; Equipment and Parts $1,098,956 8 94 Furniture; Lamps and Prefabricated Buildings $25,407,077 7 48 Paper and Paperboard $1,065,237 9 71 Pearls; Stones; Metals and Imitation Jewelry $18,733,855 8 21 Miscellaneous Edible Preparations $806,328 10 72 Iron and Steel $16,790,160 9 39 Plastics and Articles $597,449 10 7 Edible Vegetables and Roots $590,076 2010 Leading Exports from Colorado from Mexico 2010 Tamaulipas Export 1 2 Meat and Edible Offal $7,822,360 2 84 Computer-Related Machinery and Parts $2,044,127 3 56 Wadding; Felt and Nonwovens $999,914 4 48 Paper and Paperboard $856,777 5 96 Miscellaneous Manufactured Articles $646,514 6 73 Articles of Iron and Steel $439,503 7 39 Plastics and Articles $318,262 8 4 Dairy Products $113,976 9 70 Glass $87,135 10 87 Vehicles Other than Railway $78,046
- 5. Mexico Colorado Trading Relationships -- 2004 - 2010 Domestic Canada Rail Truck Rail Truck Change Change Domestic -- Change Change Domestic 2002 Domestic -- 2007 2002-2007 2002-2007 2015 2002-2015 2002-2015 Exports Rail Truck Exports Rail Truck Exports Rail Truck Colorado $0 Colorado Colorado Montana 76 462 9% Montana 747 7% -100% 62% Montana 13 780 7% -83% 69% Nebraska 722 12% Nebraska 1,117 11% 0% 55% Nebraska 10 2,203 19% #DIV/0! 205% New Mexico 653 11% New Mexico 1,926 18% 0% 195% New Mexico 8 1,888 16% #DIV/0! 189% North Dakota 0 0% North Dakota 120 1% 0% 100% North Dakota 123 1% #DIV/0! #DIV/0! Oklahoma 240 4% Oklahoma 420 4% 0% 75% Oklahoma 64 416 4% #DIV/0! 73% South Dakota 187 3% South Dakota 227 2% 0% 21% South Dakota 261 2% #DIV/0! 39% Texas 338 2,264 43% Texas 275 3,304 34% -19% 46% Texas 162 3,129 28% -52% 38% Wyoming 1,105 18% Wyoming 2,337 22% 0% 111% Wyoming 1 2,883 24% #DIV/0! 161% Total ($m) 414 5,633 Total ($m) 275 10,198 100% -34% 81% Total ($m) 257 11,683 100% -38% 107% 6,047 10,473 73% 11,940 97% Millions Imports Rail Truck Imports Rail Truck Imports Rail Truck Colorado Colorado Colorado Montana 46 0 1% Montana 80 1% -100% Montana 48 103 1% 5% #DIV/0! Nebraska 298 1,267 24% Nebraska 223 1,589 17% -25% 25% Nebraska 244 2,107 18% -18% 66% New Mexico 9 407 7% New Mexico 561 5% -100% 38% New Mexico 5 937 7% -41% 130% North Dakota 39 1% North Dakota 0% 0% -100% North Dakota 80 320 3% #DIV/0! 722% Oklahoma 675 11% Oklahoma 73 881 9% 100% 31% Oklahoma 76 974 8% #DIV/0! 44% South Dakota 137 2% South Dakota 249 2% 0% 82% South Dakota 3 281 2% #DIV/0! 105% Texas 167 2,653 44% Texas 84 5,488 52% -50% 107% Texas 95 6,164 47% -43% 132% Wyoming 90 603 11% Wyoming 232 1,179 13% 158% 96% Wyoming 231 1,610 14% 157% 167% Total ($m) $610 $5,781 Total ($m) 612 10,027 100% 0% 73% Total ($m) 783 12,496 100% 28% 116% $6,391 10,639 66% 13,280 108% Millions TOTALS Rail Truck TOTALS Rail Truck TOTALS Rail Truck Colorado Colorado Colorado Montana 122 462 5% Colorado 827 4% -100% 79% Colorado 883 4% -100% 91% Nebraska 298 1,989 18% Nebraska 223 2,706 14% -25% 36% Nebraska 254 4,310 18% -15% 117% New Mexico 9 1,060 9% New Mexico 2,487 12% -100% 135% New Mexico 2,825 11% -100% 167% North Dakota 39 0% North Dakota 120 1% 0% 208% North Dakota 444 2% #DIV/0! 1038% Oklahoma 915 7% Oklahoma 73 1,301 7% -100% 42% Oklahoma 140 1,390 6% #DIV/0! 52% South Dakota 324 3% South Dakota 476 2% 0% 47% South Dakota 541 2% #DIV/0! 67% Texas 505 4,917 44% Texas 359 8,792 43% -29% 79% Texas 257 9,293 38% -49% 89% Wyoming 90 1,708 14% Wyoming 232 3,516 18% 158% 106% Wyoming 232 4,493 19% 158% 163% Total ($m) $1,024 $11,414 Total ($m) 887 20,225 100% -13% 77% Total ($m) 883 24,179 100% -14% 112% $12,438 21,112 70% 25,062 101%
- 6. Mexico Colorado Trading Relationships -- 2004 - 2010 Domestic Canada 2009- 2009-2010 2010 % 2004-2010 2004-2010 2004 2005 2006 2007 2008 2009 2010 Difference Change Difference % Change Canada Truck Exports $1,337,778,190 $1,418,648,772 $1,448,187,809 $1,375,580,782 $1,600,947,218 $1,135,946,533 $1,136,831,970 $885,437 0.1% -$200,946,220 -15.0% Imports $807,034,746 $1,026,499,418 $1,022,955,601 $1,341,899,044 $1,093,022,099 $765,862,827 $843,615,754 $77,752,927 10.2% $36,581,008 4.5% Total Truck Trade with Canada $2,144,812,936 $2,445,148,190 $2,471,143,410 $2,717,479,826 $2,693,969,317 $1,901,809,360 $1,980,447,724 $78,638,364 4.1% -$164,365,212 -7.7% Rail Exports $63,037,304 $90,232,684 $190,346,988 $190,532,462 $304,885,103 $135,141,806 $91,535,129 -$43,606,677 -32.3% $28,497,825 45.2% Imports $491,471,483 $588,450,141 $486,572,576 $526,011,674 $402,082,084 $201,745,947 $230,684,240 $28,938,293 14.3% -$260,787,243 -53.1% Total Rail Trade with Canada $554,508,787 $678,682,825 $676,919,564 $716,544,136 $706,967,187 $336,887,753 $322,219,369 -$14,668,384 -4.4% -$232,289,418 -41.9% TOTAL Exports $1,400,815,494 $1,508,881,456 $1,638,534,797 $1,566,113,244 $1,905,832,321 $1,271,088,339 $1,228,367,099 -$42,721,240 -3.4% -$172,448,395 -12.3% Imports $1,298,506,229 $1,614,949,559 $1,509,528,177 $1,867,910,718 $1,495,104,183 $967,608,774 $1,074,299,994 $106,691,220 11.0% -$224,206,235 -17.3% Total Trade with Canada $2,699,321,723 $3,123,831,015 $3,148,062,974 $3,434,023,962 $3,400,936,504 $2,238,697,113 $2,302,667,093 $63,969,980 2.9% -$396,654,630 -14.7% Raymond, MT Truck Exports $2,114,767 $3,817,348 $4,834,138 $10,542,544 $11,160,573 $6,942,388 $5,971,708 -$970,680 -14.0% $3,856,941 182.4% % of Total Exports to Canada 0.2% 0.3% 0.3% 0.8% 0.7% 0.6% 0.5% -0.1% 0.4% Imports $10,885,418 $22,029,119 $26,301,061 $69,337,561 $39,279,681 $21,715,400 $48,684,149 $26,968,749 124.2% $37,798,731 347.2% % of Total Imports to Canada 1.3% 2.1% 2.6% 5.2% 3.6% 2.8% 5.8% 2.9% 4.4% Total Truck Trade Thru Raymond $13,000,185 $25,846,467 $31,135,199 $79,880,105 $50,440,254 $28,657,788 $54,655,857 $20,744,720 90.7% $41,655,672 320.4% % Total Trade with Canada 0.6% 1.1% 1.3% 2.9% 1.9% 1.5% 2.8% 1.3% 2.2% Rail Exports $0 $0 $0 #DIV/0! $0 #DIV/0! % of Total Exports to Canada 0.0% 0.0% 0.0% 0.0% 0.0% 0.0% 0.0% 0.0% 0.0% Imports $0 $0 $0 #DIV/0! $0 #DIV/0! % of Total Imports to Canada 0.0% 0.0% 0.0% 0.0% 0.0% 0.0% 0.0% 0.0% 0.0% Total Truck Trade Thru Raymond $0 $0 $0 $0 $0 $0 $0 #DIV/0! $0 #DIV/0! % Total Trade with Canada 0.0% 0.0% 0.0% 0.0% 0.0% 0.0% 0.0% 0.0% 0.0% TOTAL Exports $2,114,767 $3,817,348 $4,834,138 $10,542,544 $11,160,573 $6,942,388 $5,971,708 -$970,680 -14.0% $3,856,941 182.4% % of Total Exports to Canada 0.2% 0.3% 0.3% 0.7% 0.6% 0.5% 0.5% -0.1% 0.3% Imports $10,885,418 $22,029,119 $26,301,061 $69,337,561 $39,279,681 $21,715,400 $48,684,149 $26,968,749 124.2% $37,798,731 347.2% % of Total Imports to Canada 0.8% 1.4% 1.7% 3.7% 2.6% 2.2% 4.5% 2.3% 3.7% Total Trade Thru Raymond $13,000,185 $25,846,467 $31,135,199 $79,880,105 $50,440,254 $28,657,788 $54,655,857 $20,744,720 90.7% $41,655,672 320.4% % Total Trade with Canada 0.5% 0.8% 1.0% 2.3% 1.5% 1.3% 2.4% 1.1% 1.9%
- 7. Mexico Colorado Trading Relationships -- 2004 - 2010 Domestic Canada 2009- 2009-2010 2010 % 2004-2010 2004-2010 2004 2005 2006 2007 2008 2009 2010 Difference Change Difference % Change Sweet Grass, MT Truck Exports $166,037,392 $101,300,639 $126,171,357 $142,233,429 $155,903,677 $119,109,854 $141,927,729 $22,817,875 19.2% -$24,109,663 -14.5% % of Total Exports to Canada 12.4% 7.1% 8.7% 10.3% 9.7% 10.5% 12.5% 2.0% 0.1% Imports $166,269,963 $253,011,190 $322,036,110 $554,925,178 $405,452,097 $199,825,669 $190,703,628 -$9,122,041 -4.6% $24,433,665 14.7% % of Total Imports to Canada 20.6% 24.6% 31.5% 41.4% 37.1% 26.1% 22.6% -3.5% 2.0% Total Truck Trade Thru Sweet Grass $332,307,355 $354,311,829 $448,207,467 $697,158,607 $561,355,774 $318,935,523 $332,631,357 $222,643,544 4.3% $324,002 0.1% % Total Trade with Canada 15.5% 14.5% 18.1% 25.7% 20.8% 16.8% 16.8% 0.0% 1.3% Rail Exports $200,101 $185,912 $3,433,293 $5,441,705 $8,387,930 $12,386,208 $16,958,495 $4,572,287 36.9% $16,758,394 8375.0% % of Total Exports to Canada 0.3% 0.2% 1.8% 2.9% 2.8% 9.2% 18.5% 9.4% 18.2% Imports $46,254,973 $43,969,655 $26,082,075 $73,928,126 $24,930,431 $18,069,641 $33,684,411 $15,614,770 86.4% -$12,570,562 -27.2% % of Total Imports to Canada 9.4% 7.5% 5.4% 14.1% 6.2% 9.0% 14.6% 5.6% 5.2% Total Rail Trade Thru Sweet Grass $46,455,074 $44,155,567 $29,515,368 $79,369,831 $33,318,361 $30,455,849 $50,642,906 $22,641,928 66.3% $4,187,832 9.0% % Total Trade with Canada 8.4% 6.5% 4.4% 11.1% 4.7% 9.0% 15.7% 6.7% 7.3% TOTAL Exports $166,237,493 $101,486,551 $129,604,650 $147,675,134 $164,291,607 $131,496,062 $158,886,224 $27,390,162 20.8% -$7,351,269 -4.4% % of Total Exports to Canada 11.9% 6.7% 7.9% 9.4% 8.6% 10.3% 12.9% 2.6% 1.1% Imports $212,524,936 $296,980,845 $348,118,185 $628,853,304 $430,382,528 $217,895,310 $224,388,039 $6,492,729 3.0% $11,863,103 5.6% % of Total Imports to Canada 16.4% 18.4% 23.1% 33.7% 28.8% 22.5% 20.9% -1.6% 4.5% Total Trade Thru Sweet Grass $378,762,429 $398,467,396 $477,722,835 $776,528,438 $594,674,135 $349,391,372 $383,274,263 $245,285,472 9.7% $4,511,834 1.2% % Total Trade with Canada 14.0% 12.8% 15.2% 22.6% 17.5% 15.6% 16.6% 1.0% 2.6% Portal, ND Truck Exports $18,094,321 $49,836,713 $96,311,604 $73,267,550 $176,161,505 $257,015,286 $132,704,744 -$124,310,542 -48.4% $114,610,423 633.4% % of Total Exports to Canada 1.4% 3.5% 6.7% 5.3% 11.0% 22.6% 11.7% -11.0% 10.3% Imports $10,975,196 $23,714,096 $20,863,660 $32,653,675 $27,021,253 $16,086,418 $32,207,301 $16,120,883 100.2% $21,232,105 193.5% % of Total Imports to Canada 1.4% 2.3% 2.0% 2.4% 2.5% 2.1% 3.8% 1.7% 2.5% Total Truck Trade Thru Portal $29,069,517 $73,550,809 $117,175,264 $105,921,225 $203,182,758 $273,101,704 $164,912,045 -$108,224,124 -39.6% $135,842,528 467.3% % Total Trade with Canada 1.4% 3.0% 4.7% 3.9% 7.5% 14.4% 8.3% -6.0% 7.0% Rail Exports $21,863,019 $34,323,996 $30,290,980 $37,310,017 $84,150,181 $30,325,811 $3,937,798 -$26,388,013 -87.0% -$17,925,221 -82.0% % of Total Exports to Canada 34.7% 38.0% 15.9% 19.6% 27.6% 22.4% 4.3% -18.1% -30.4% Imports $34,378,309 $8,750,519 $5,731,277 $9,496,557 $18,861,897 $2,819,844 $4,610,480 $1,790,636 63.5% -$29,767,829 -86.6% % of Total Imports to Canada 7.0% 1.5% 1.2% 1.8% 4.7% 1.4% 2.0% 0.6% -5.0% Total Rail Trade Thru Portal $56,241,328 $43,074,515 $36,022,257 $46,806,574 $103,012,078 $33,145,655 $8,548,278 -$23,568,169 -74.2% -$47,693,050 -84.8% % Total Trade with Canada 10.1% 6.3% 5.3% 6.5% 14.6% 9.8% 2.7% -7.2% -7.5% TOTAL Exports $39,957,340 $84,160,709 $126,602,584 $110,577,567 $260,311,686 $287,341,097 $136,642,542 -$150,698,555 -52.4% $96,685,202 242.0% % of Total Exports to Canada 2.9% 5.6% 7.7% 7.1% 13.7% 22.6% 11.1% -11.5% 8.3% Imports $45,353,505 $32,464,615 $26,594,937 $42,150,232 $45,883,150 $18,906,262 $36,817,781 $17,911,519 94.7% -$8,535,724 -18.8% % of Total Imports to Canada 3.5% 2.0% 1.8% 2.3% 3.1% 2.0% 3.4% 1.5% -0.1% Total Trade Thru Portal $85,310,845 $116,625,324 $153,197,521 $152,727,799 $306,194,836 $306,247,359 $173,460,323 -$131,792,293 -43.4% $88,149,478 103.3% % Total Trade with Canada 3.2% 3.7% 4.9% 4.4% 9.0% 13.7% 7.5% -6.1% 4.4%
- 8. Mexico Colorado Trading Relationships -- 2004 - 2010 Domestic Canada 2009- 2009-2010 2010 % 2004-2010 2004-2010 2004 2005 2006 2007 2008 2009 2010 Difference Change Difference % Change Wild Horse 0 Truck Exports $0 $0 $0 $0 $0 $0 $0 $0 #DIV/0! $0 #DIV/0! % of Total Exports to Canada 0.0% 0.0% 0.0% 19.4% 0.0% 0.0% 0.0% 0.0% 0.0% Imports $61,889 $161,646 $234,364 $114,476 $0 $68,524 $68,524 #DIV/0! $68,524 #DIV/0! % of Total Imports to Canada 0.0% 0.0% 0.0% 0.0% 0.0% 0.0% 0.0% 0.0% 0.0% Total Truck Trade Thru GPITC $0 $61,889 $161,646 $234,364 $114,476 $0 $68,524 $0 #DIV/0! $68,524 #DIV/0! % Total Trade with Canada 0.0% 0.0% 0.0% 0.0% 0.0% 0.0% 0.0% 0.0% 0.0% Rail Exports $0 $0 $0 $0 #DIV/0! $0 #DIV/0! % of Total Exports to Canada 0.0% 0.0% 0.0% 0.0% 0.0% 0.0% 0.0% 0.0% 0.0% Imports $0 $0 $0 $0 #DIV/0! $0 #DIV/0! % of Total Imports to Canada 0.0% 0.0% 0.0% 0.0% 0.0% 0.0% 0.0% 0.0% 0.0% Total Rail Trade Thru GPITC $0 $0 $0 $0 $0 $0 $0 $0 #DIV/0! $0 #DIV/0! % Total Trade with Canada 0.0% 0.0% 0.0% 0.0% 0.0% 0.0% 0.0% 0.0% 0.0% TOTAL Exports $0 $0 $0 $0 $0 $0 $0 $0 #DIV/0! $0 #DIV/0! % of Total Exports to Canada 0.0% 0.0% 0.0% 0.0% 0.0% 0.0% 0.0% 0.0% 0.0% Imports $0 $61,889 $161,646 $234,364 $114,476 $0 $68,524 $68,524 #DIV/0! $68,524 #DIV/0! % of Total Imports to Canada 0.0% 0.0% 0.0% 0.0% 0.0% 0.0% 0.0% 0.0% 0.0% Total Trade Thru GPITC $0 $61,889 $161,646 $234,364 $114,476 $0 $68,524 $0 #DIV/0! $68,524 #DIV/0! % Total Trade with Canada 0.0% 0.0% 0.0% 0.0% 0.0% 0.0% 0.0% 0.0% 0.0% GPITC #DIV/0! Truck Exports $186,246,480 $154,954,700 $227,317,099 $226,043,523 $343,225,755 $383,067,528 $280,604,181 -$102,463,347 -26.7% $94,357,701 50.7% % of Total Exports to Canada 13.9% 10.9% 15.7% 16.4% 21.4% 33.7% 24.7% -9.0% 10.8% Imports $179,359,926 $280,604,523 $347,895,554 $598,355,761 $443,748,399 $222,854,475 $228,951,161 $6,096,686 2.7% $49,591,235 27.6% % of Total Imports to Canada 22.2% 27.3% 34.0% 44.6% 40.6% 29.1% 27.1% -2.0% 4.9% Total Truck Trade Thru GPITC $365,606,406 $435,559,223 $575,212,653 $824,399,284 $786,974,154 $605,922,003 $509,555,342 $120,391,128 -15.9% $143,948,936 39.4% % Total Trade with Canada 17.0% 17.8% 23.3% 30.3% 29.2% 31.9% 25.7% -6.1% 8.7% Rail Exports $22,063,120 $34,509,908 $33,724,273 $42,751,722 $92,538,111 $42,712,019 $20,896,293 -$21,815,726 -51.1% -$1,166,827 -5.3% % of Total Exports to Canada 1.6% 2.4% 2.3% 3.1% 5.8% 3.8% 1.8% -1.9% 0.2% Imports $80,633,282 $52,720,174 $31,813,352 $83,424,683 $43,792,328 $20,889,485 $38,294,891 $17,405,406 83.3% -$42,338,391 -52.5% % of Total Imports to Canada 10.0% 5.1% 3.1% 6.2% 4.0% 2.7% 4.5% 1.8% -5.5% Total Rail Trade Thru GPITC $102,696,402 $87,230,082 $65,537,625 $126,176,405 $136,330,439 $63,601,504 $59,191,184 -$926,241 -6.9% -$43,505,218 -42.4% % Total Trade with Canada 4.8% 3.6% 2.7% 4.6% 5.1% 3.3% 3.0% -0.4% -1.8% TOTAL Exports $208,309,600 $189,464,608 $261,041,372 $268,795,245 $435,763,866 $425,779,547 $301,500,474 -$124,279,073 -29.2% $93,190,874 44.7% % of Total Exports to Canada 14.9% 12.6% 15.9% 17.2% 22.9% 33.5% 24.5% -9.0% 9.7% Imports $259,993,208 $333,324,697 $379,708,906 $681,780,444 $487,540,727 $243,743,960 $267,246,052 $23,502,092 9.6% $7,252,844 2.8% % of Total Imports to Canada 20.0% 20.6% 25.2% 36.5% 32.6% 25.2% 24.9% -0.3% 4.9% Total Trade Thru GPITC $468,302,808 $522,789,305 $640,750,278 $950,575,689 $923,304,593 $669,523,507 $568,746,526 $119,464,887 -15.1% $100,443,718 21.4% % Total Trade with Canada 17.3% 16.7% 20.4% 27.7% 27.1% 29.9% 24.7% -5.2% 7.4%
- 9. Mexico Colorado Trading Relationships -- 2004 - 2010 Domestic Canada Leading Exports from Colorado to Canada 2010 Leading Exports from Colorado to Canada (Su 2009 2010 (Surface Transportation) 2010 Rank Export Rank Alberta Export 1 2 Meat and Edible Offal $235,999,449 1 84 Computer-Related Machinery and Parts $51,563,345 2 27 Mineral Fuels; Oils and Waxes $201,498,538 2 73 Articles of Iron and Steel $20,561,915 3 84 Computer-Related Machinery and Parts $182,928,842 3 63 Other Made up Textile Articles $14,580,004 4 90 Measuring and Testing Instruments $80,561,414 4 90 Measuring and Testing Instruments $13,008,959 5 73 Articles of Iron and Steel $63,568,312 5 87 Vehicles Other than Railway $12,386,479 6 85 Electrical Machinery; Equipment and Parts $63,081,310 6 39 Plastics and Articles $11,704,855 7 39 Plastics and Articles $39,914,931 7 29 Organic Chemicals $9,521,293 8 87 Vehicles Other than Railway $36,586,199 8 2 Meat and Edible Offal $7,875,930 9 63 Other Made up Textile Articles $30,235,324 9 28 Inorganic Chemicals $7,024,720 10 76 Aluminum and Articles $25,847,110 10 85 Electrical Machinery; Equipment and Parts $6,725,852 2010 Leading Imports to Colorado from Canada 2010 Rank Import 2010 Leading Exports from Colorado to Canada 2010 1 27 Mineral Fuels; Oils and Waxes $2,343,388,848 Rank British Colombia Export 2 84 Computer-Related Machinery and Parts $129,738,541 1 84 Computer-Related Machinery and Parts $37,849,575 3 1 Live Animals $109,247,800 2 2 Meat and Edible Offal $16,312,425 4 73 Articles of Iron and Steel $103,196,106 3 73 Articles of Iron and Steel $9,067,706 5 44 Wood and Articles $84,061,106 4 39 Plastics and Articles $7,524,122 6 98 Special Classification Provisions $68,375,211 5 85 Electrical Machinery; Equipment and Parts $7,319,124 7 39 Plastics and Articles $63,670,218 6 21 Miscellaneous Edible Preparations $6,789,272 8 36 Explosives $60,007,739 7 87 Vehicles Other than Railway $6,500,841 9 85 Electrical Machinery; Equipment and Parts $58,674,982 8 72 Iron and Steel $6,227,873 10 48 Paper and Paperboard $52,266,866 9 94 Furniture; Lamps and Prefabricated $3,869,941 Rank Import 10 90 Measuring and Testing Instruments $3,780,405 1 27 Mineral Fuels; Oils and Waxes $2,343,388,848 2 84 Computer-Related Machinery and Parts $129,738,541 2010 Leading Exports from Colorado to Canada 2010 3 1 Live Animals $109,247,800 Rank Saskatchewan Export 4 73 Articles of Iron and Steel $103,196,106 1 84 Computer-Related Machinery and Parts $37,849,575 5 44 Wood and Articles $84,061,106 2 2 Meat and Edible Offal $16,312,425 6 98 Special Classification Provisions $68,375,211 3 73 Articles of Iron and Steel $9,067,706 7 39 Plastics and Articles $63,670,218 4 39 Plastics and Articles $7,524,122 8 36 Explosives $60,007,739 5 85 Electrical Machinery; Equipment and Parts $7,319,124 9 85 Electrical Machinery; Equipment and Parts $58,674,982 6 21 Miscellaneous Edible Preparations $6,789,272 10 48 Paper and Paperboard $52,266,866 7 87 Vehicles Other than Railway $6,500,841 8 72 Iron and Steel $6,227,873 9 94 Furniture; Lamps and Prefabricated $3,869,941 10 90 Measuring and Testing Instruments $3,780,405