SlideShare a Scribd company logo
1 of 9
Download to read offline
Oklahoma Trading Relationships -- 2004 - 2010                                                                                                                                                     Mexico
                                                                                                                                                                                                         Domestic
                                                                                                                                                                                                          Canada


                                                                                                                                                                 2009-2010 2009-2010        2004-2010 2004-2010
                                                                 2004          2005          2006          2007          2008           2009           2010      Difference % Change        Difference % Change
Mexico
Truck            Exports                                  $236,570,946 $316,232,785 $400,227,496 $331,674,933 $276,258,074       $435,295,883   $333,888,283 -$101,407,600      -23.3%    $97,317,337    41.1%
                 Imports                                  $322,224,222 $398,421,285 $427,476,698 $377,579,436 $470,512,336       $533,742,565   $626,924,202 $93,181,637         17.5%   $304,699,980    94.6%
                 Total Truck Trade with Mexico            $558,795,168 $714,654,070 $827,704,194 $709,254,369 $746,770,410       $969,038,448   $960,812,485   -$8,225,963       -0.8%   $402,017,317    71.9%
                                                                                                                                                                              #DIV/0!
Rail             Exports                                   $78,868,454 $63,156,699 $65,187,184 $90,195,153         $70,981,147    $60,713,013    $56,920,209    -$3,792,804      -6.2%    -$21,948,245   -27.8%
                 Imports                                  $135,330,771 $93,662,207 $55,256,762 $10,726,919         $19,954,604     $6,576,874     $7,526,911      $950,037       14.4%   -$127,803,860   -94.4%
                 Total Rail Trade with Mexico             $214,199,225 $156,818,906 $120,443,946 $100,922,072      $90,935,751    $67,289,887    $64,447,120    -$2,842,767      -4.2%   -$149,752,105   -69.9%
                                                                                                                                                                              #DIV/0!
TOTAL            Exports                                  $315,439,400 $379,389,484 $465,414,680 $421,870,086 $347,239,221  $496,008,896    $390,808,492 -$105,200,404          -21.2%    $75,369,092    23.9%
                 Imports                                  $457,554,993 $492,083,492 $482,733,460 $388,306,355 $490,466,940  $540,319,439   $634,451,113 $94,131,674              17.4%   $176,896,120    38.7%
                 Total Trade with Mexico                  $772,994,393 $871,472,976 $948,148,140 $810,176,441 $837,706,161 $1,036,328,335 $1,025,259,605 -$11,068,730            -1.1%   $252,265,212    32.6%


Laredo, TX

Truck            Exports                               $116,807,936 $186,032,946 $208,293,553 $175,034,694 $205,086,567          $200,406,211   $189,717,203   -$10,689,008     -5.3% $72,909,267        62.4%
                           % of Total Exports to Mexico       49.4%       58.8%        52.0%        52.8%        74.2%                 46.0%          56.8%                     10.8%                     7.4%
                 Imports                               $205,554,528 $216,040,042 $256,871,264 $211,985,615 $305,186,359          $365,916,767   $381,499,706   $15,582,939       4.3% $175,945,178       85.6%
                          % of Total Imports to Mexico        63.8%       54.2%        60.1%        56.1%        64.9%                 68.6%          60.9%                     -7.7%                    -2.9%
                 Total Truck Trade Thru Laredo         $322,362,464 $402,072,988 $465,164,817 $387,020,309 $510,272,926          $566,322,978   $571,216,909    $4,893,931       0.9% $248,854,445       77.2%
                            % Total Trade with Mexico        57.7%        56.3%        56.2%        54.6%        68.3%                 58.4%          59.5%                      1.0%                     1.8%

Rail             Exports                                   $54,342,202   $32,398,047   $14,902,186   $19,381,292   $33,012,139    $17,529,695    $26,498,686    $8,968,991       51.2%    -$27,843,516   -51.2%
                           % of Total Exports to Mexico          68.9%        51.3%         22.9%         21.5%         46.5%          28.9%          46.6%                      17.7%                   -22.3%
                 Imports                                   $31,237,815    $6,252,218    $6,227,638   $10,567,293   $17,863,063     $6,514,272     $4,101,872    -$2,412,400     -37.0%    -$27,135,943   -86.9%
                          % of Total Imports to Mexico           23.1%         6.7%         11.3%         98.5%         89.5%          99.0%          54.5%                     -44.6%                    31.4%
                 Total Rail Trade Thru Laredo              $85,580,017   $38,650,265   $21,129,824   $29,948,585   $50,875,202    $24,043,967    $30,600,558    $6,556,591       27.3%    -$54,979,459   -64.2%
                             % Total Trade with Mexico          40.0%         24.6%         17.5%         29.7%         55.9%          35.7%          47.5%                      11.7%                     7.5%

TOTAL
                 Exports                               $171,150,138 $218,430,993 $223,195,739 $194,415,986 $238,098,706          $217,935,906   $216,215,889    -$1,720,017     -0.8% $45,065,751        26.3%
                           % of Total Exports to Mexico       54.3%       57.6%        48.0%        46.1%        68.6%                 43.9%          55.3%                     11.4%                     1.1%
                 Imports                               $236,792,343 $222,292,260 $263,098,902 $222,552,908 $323,049,422          $372,431,039   $385,601,578   $13,170,539       3.5% $148,809,235       62.8%
                          % of Total Imports to Mexico        51.8%       45.2%        54.5%        57.3%        65.9%                 68.9%          60.8%                     -8.2%                     9.0%
                 Total Trade Thru Laredo               $407,942,481 $440,723,253 $486,294,641 $416,968,894 $561,148,128          $590,366,945   $601,817,467   $11,450,522       1.9% $193,874,986       47.5%
                            % Total Trade with Mexico        52.8%        50.6%        51.3%        51.5%        67.0%                 57.0%          58.7%                      1.7%                     5.9%
Oklahoma Trading Relationships -- 2004 - 2010                                                                                                                                                   Mexico
                                                                                                                                                                                                      Domestic
                                                                                                                                                                                                       Canada


                                                                                                                                                              2009-2010 2009-2010       2004-2010 2004-2010
                                                                2004          2005          2006          2007          2008          2009           2010     Difference % Change       Difference % Change

Eagle Pass, TX


Truck            Exports                                  $27,122,866   $41,232,461   $34,388,591   $29,785,964   $23,328,222    $9,859,859    $11,993,678    $2,133,819     21.6%    -$15,129,188    -55.8%
                           % of Total Exports to Mexico         11.5%        13.0%          8.6%          9.0%          8.4%          2.3%           3.6%                     1.3%                     -7.9%
                 Imports                                  $15,801,834   $29,208,916   $31,764,574   $21,462,362   $30,377,147   $44,016,986    $88,730,792   $44,713,806    101.6%    $72,928,958     461.5%
                          % of Total Imports to Mexico           4.9%         7.3%          7.4%          5.7%          6.5%          8.2%          14.2%                     5.9%                      9.2%
                 Total Truck Trade Thru Eagle Pass        $42,924,700   $70,441,377   $66,153,165   $51,248,326   $53,705,369   $53,876,845   $100,724,470   $46,847,625     87.0%    $57,799,770     134.7%
                            % Total Trade with Mexico            7.7%         9.9%          8.0%          7.2%          7.2%          5.6%          10.5%                     4.9%                      2.8%

Rail             Exports                                   $5,702,089    $8,192,111    $5,602,025   $13,833,422   $14,307,939   $25,364,842    $18,953,963   -$6,410,879     -25.3%   $13,251,874     232.4%
                           % of Total Exports to Mexico          7.2%        13.0%          8.6%         15.3%         20.2%         41.8%          33.3%                     -8.5%                    26.1%
                 Imports                                      $58,587     $118,523     $5,672,305            $0    $1,547,397            $0     $3,422,466    $3,422,466   #DIV/0!     $3,363,879    5741.7%
                          % of Total Imports to Mexico           0.0%         0.1%         10.3%          0.0%          7.8%          0.0%          45.5%                     45.5%                    45.5%
                 Total Rail Trade Thru Eagle Pass          $5,760,676    $8,310,634   $11,274,330   $13,833,422   $15,855,336   $25,364,842    $22,376,429   -$2,988,413     -11.8%   $16,615,753     288.4%
                             % Total Trade with Mexico          2.7%          5.3%          9.4%         13.7%         17.4%         37.7%          34.7%                     -3.0%                    32.0%

TOTAL
                 Exports                                  $32,824,955   $49,424,572   $39,990,616   $43,619,386   $37,636,161   $35,224,701    $30,947,641   -$4,277,060    -12.1%     -$1,877,314     -5.7%
                           % of Total Exports to Mexico         10.4%        13.0%          8.6%         10.3%         10.8%          7.1%           7.9%                     0.8%                     -2.5%
                 Imports                                  $15,860,421   $29,327,439   $37,436,879   $21,462,362   $31,924,544   $44,016,986    $92,153,258   $48,136,272    109.4%    $76,292,837     481.0%
                          % of Total Imports to Mexico           3.5%         6.0%          7.8%          5.5%          6.5%          8.1%          14.5%                     6.4%                     11.1%
                 Total Trade Thru Eagle Pass              $48,685,376   $78,752,011   $77,427,495   $65,081,748   $69,560,705   $79,241,687   $123,100,899   $43,859,212     55.3%    $74,415,523     152.8%
                            % Total Trade with Mexico            6.3%         9.0%          8.2%          8.0%          8.3%          7.6%          12.0%                     4.4%                      5.7%

Del Rio, TX

Truck            Exports                                    $459,849      $191,147      $307,027       $47,635      $515,036      $117,351       $139,870       $22,519       19.2%     -$319,979      -69.6%
                           % of Total Exports to Mexico         0.2%         0.1%          0.1%          0.0%          0.2%          0.0%           0.0%                       0.0%                     -0.2%
                 Imports                                     $93,608      $154,324      $205,454       $11,796            $0       $10,000             $0       -$10,000    -100.0%      -$93,608     -100.0%
                          % of Total Imports to Mexico          0.0%         0.0%          0.0%          0.0%          0.0%          0.0%           0.0%                       0.0%                      0.0%
                 Total Truck Trade Thru Del Rio             $553,457      $345,471      $512,481       $59,431      $515,036      $127,351       $139,870       $12,519        9.8%     -$413,587      -74.7%
                            % Total Trade with Mexico          0.1%          0.0%          0.1%          0.0%          0.1%          0.0%           0.0%                       0.0%                     -0.1%

Rail             Exports                                           $0            $0                                                                                  $0    #DIV/0!             $0    #DIV/0!
                           % of Total Exports to Mexico         0.0%          0.0%                   #DIV/0!       #DIV/0!      #DIV/0!        #DIV/0!                     #DIV/0!                   #DIV/0!
                 Imports                                          $0             $0                                                                                  $0    #DIV/0!             $0    #DIV/0!
                          % of Total Imports to Mexico          0.0%          0.0%                   #DIV/0!       #DIV/0!      #DIV/0!        #DIV/0!                     #DIV/0!                   #DIV/0!
                 Total Rail Trade Thru Del Rio                    $0             $0                                                                                  $0    #DIV/0!             $0    #DIV/0!
                             % Total Trade with Mexico          0.0%          0.0%                        0.0%          0.0%          0.0%           0.0%                      0.0%                      0.0%

TOTAL
                 Exports                                    $459,849      $191,147      $307,027       $47,635      $515,036      $117,351       $139,870       $22,519       19.2%     -$319,979      -69.6%
                           % of Total Exports to Mexico         0.1%         0.1%          0.1%          0.0%          0.1%          0.0%           0.0%                       0.0%                     -0.1%
                 Imports                                     $93,608      $154,324      $205,454       $11,796            $0       $10,000             $0       -$10,000    -100.0%      -$93,608     -100.0%
                          % of Total Imports to Mexico          0.0%         0.0%          0.0%          0.0%          0.0%          0.0%           0.0%                       0.0%                      0.0%
                 Total Trade Thru Del Rio                   $553,457      $345,471      $512,481       $59,431      $515,036      $127,351       $139,870       $12,519        9.8%     -$413,587      -74.7%
                            % Total Trade with Mexico          0.1%          0.0%          0.1%          0.0%          0.1%          0.0%           0.0%                       0.0%                     -0.1%
Oklahoma Trading Relationships -- 2004 - 2010                                                                                                                                                Mexico
                                                                                                                                                                                                   Domestic
                                                                                                                                                                                                    Canada


                                                                                                                                                              2009-2010 2009-2010     2004-2010 2004-2010
                                                               2004          2005          2006          2007          2008           2009           2010     Difference % Change     Difference % Change
GPITC

Truck           Exports                               $144,390,651 $227,456,554 $242,989,171 $204,868,293 $228,929,825         $210,383,421   $201,850,751   -$8,532,670   -4.1% $57,460,100        39.8%
                          % of Total Exports to Mexico       61.0%       71.9%        60.7%        61.8%        82.9%                48.3%          60.5%                  12.1%                    -0.6%
                Imports                               $221,449,970 $245,403,282 $288,841,292 $233,459,773 $335,563,506         $409,943,753   $470,230,498   $60,286,745   14.7% $248,780,528      112.3%
                         % of Total Imports to Mexico        68.7%       61.6%        67.6%        61.8%        71.3%                76.8%          75.0%                  -1.8%                     6.3%
                Total Truck Trade Thru GPITC          $365,840,621 $472,859,836 $531,830,463 $438,328,066 $564,493,331         $620,327,174   $672,081,249   $51,754,075    8.3% $306,240,628       83.7%
                           % Total Trade with Mexico        65.5%        66.2%        64.3%        61.8%        75.6%                64.0%          69.9%                   5.9%                     4.5%

Rail            Exports                                  $60,044,291   $40,590,158   $20,504,211   $33,214,714   $47,320,078    $42,894,537    $45,452,649    $2,558,112    6.0%    -$14,591,642   -24.3%
                          % of Total Exports to Mexico         76.1%        64.3%         31.5%         36.8%         66.7%          70.7%          79.9%                   9.2%                     3.7%
                Imports                                  $31,296,402    $6,370,741   $11,899,943   $10,567,293   $19,410,460     $6,514,272     $7,524,338    $1,010,066   15.5%    -$23,772,064   -76.0%
                         % of Total Imports to Mexico          23.1%         6.8%         21.5%         98.5%         97.3%          99.0%         100.0%                   0.9%                    76.8%
                Total Rail Trade Thru GPITC              $91,340,693   $46,960,899   $32,404,154   $43,782,007   $66,730,538    $49,408,809    $52,976,987    $3,568,178    7.2%    -$38,363,706   -42.0%
                            % Total Trade with Mexico         42.6%         29.9%         26.9%         43.4%         73.4%          73.4%          82.2%                   8.8%                    39.6%

TOTAL
                Exports                               $204,434,942 $268,046,712 $263,493,382 $238,083,007 $276,249,903         $253,277,958   $247,303,400   -$5,974,558   -2.4% $42,868,458       21.0%
                          % of Total Exports to Mexico       64.8%       70.7%        56.6%        56.4%        79.6%                51.1%          63.3%                  12.2%                   -1.5%
                Imports                               $252,746,372 $251,774,023 $300,741,235 $244,027,066 $354,973,966         $416,458,025   $477,754,836   $61,296,811   14.7% $225,008,464      89.0%
                         % of Total Imports to Mexico        55.2%       51.2%        62.3%        62.8%        72.4%                77.1%          75.3%                  -1.8%                   20.1%
                Total Trade Thru GPITC                $457,181,314 $519,820,735 $564,234,617 $482,110,073 $631,223,869         $669,735,983   $725,058,236   $55,322,253    8.3% $267,876,922      58.6%
                           % Total Trade with Mexico        59.1%        59.6%        59.5%        59.5%        75.4%                64.6%          70.7%                   6.1%                   11.6%
Oklahoma Trading Relationships -- 2004 - 2010                                                                                                                 Mexico
                                                                                                                                                               Domestic
                                                                                                                                                                Canada


2010         Leading Exports from Oklahoma to Mexico (Surface          2010    2010         Leading Exports from Oklahoma to Mexico (Surface           2010
             Transportation)                                                                Transportation)
Rank                                                                  Export    Rank        Coahuila                                                  Export
1       84   Computer-Related Machinery and Parts                $88,607,696   1        2   Meat and Edible Offal                                $27,856,202
2       2    Meat and Edible Offal                               $56,460,263   2       84   Computer-Related Machinery and Parts                  $1,270,217
3       23   Food Residues and Waste                             $37,067,950   3       34   Soap and Organic Surface-Active Agents                  $371,123
4       87   Vehicles Other than Railway                         $36,584,184   4       39   Plastics and Articles                                   $353,263
5       85   Electrical Machinery; Equipment and Parts           $23,051,024   5       25   Salt; Sulfur; Plaster and Cement                        $345,785
6       38   Miscellaneous Chemical Products                     $18,843,333   6       68   Stone; Plaster; Cement and Asbestos                     $291,394
7       90   Measuring and Testing Instruments                   $16,865,616   7       72   Iron and Steel                                          $232,844
8       39   Plastics and Articles                               $13,693,873   8       27   Mineral Fuels; Oils and Waxes                           $191,968
9       73   Articles of Iron and Steel                          $13,319,059   9       73   Articles of Iron and Steel                              $180,262
10      70   Glass                                               $10,943,488   10      85   Electrical Machinery; Equipment and Parts               $149,935

 2010        Leading Imports to Oklahoma from Mexico (Surface           2010    2010        Leading Exports from Oklahoma from Mexico (Surface          2010
Rank                                                                  Import    Rank        Nuevo Leon                                                Export
1       85   Electrical Machinery; Equipment and Parts          $194,253,634   1       85   Electrical Machinery; Equipment and Parts            $10,778,375
2       87   Vehicles Other than Railway                        $168,699,377   2       70   Glass                                                $10,306,691
3       90   Measuring and Testing Instruments                   $86,018,125   3       84   Computer-Related Machinery and Parts                  $9,016,847
4       84   Computer-Related Machinery and Parts                $50,530,163   4       74   Copper and Articles                                   $6,647,324
5       73   Articles of Iron and Steel                          $36,299,031   5       27   Mineral Fuels; Oils and Waxes                         $3,962,425
6       62   Not Knitted or Crocheted Apparel                    $15,559,059   6       73   Articles of Iron and Steel                            $2,819,262
7       39   Plastics and Articles                               $14,655,448   7       39   Plastics and Articles                                 $2,465,039
8       72   Iron and Steel                                      $11,561,354   8       87   Vehicles Other than Railway                           $2,104,306
9       98   Special Classification Provisions                   $10,083,625   9        2   Meat and Edible Offal                                 $1,971,323
10      48   Paper and Paperboard                                 $8,287,850   10      12   Oil Seeds and Oleaginous Fruits                       $1,869,550

                                                                                2010        Leading Exports from Oklahoma from Mexico (Surface         2010
                                                                               Rank         Tamaulipas                                                Export
                                                                               1       84   Computer-Related Machinery and Parts                  $5,151,043
                                                                               2       85   Electrical Machinery; Equipment and Parts             $1,053,123
                                                                               3       34   Soap and Organic Surface-Active Agents                  $603,629
                                                                               4       72   Iron and Steel                                          $452,418
                                                                               5       87   Vehicles Other than Railway                            $437,277
                                                                               6        1   Live Animals                                           $387,025
                                                                               7       39   Plastics and Articles                                  $292,684
                                                                               8       27   Mineral Fuels; Oils and Waxes                           $271,003
                                                                               9       32   Tanning or Dyeing Extracts                             $195,196
                                                                               10      38   Miscellaneous Chemical Products                         $185,217
Oklahoma Trading Relationships -- 2004 - 2010                                                                                                            Mexico
                                                                                                                                                              Domestic
                                                                                                                                                               Canada


                                                                              Rail Truck        Domestic --                     Rail Change Truck Change
        2002                       Domestic -- 2007                        Change Change                2015                     2002-2015      2002-2015
Exports         Rail Truck         Exports             Rail Truck                            Exports         Rail    Truck
Colorado          0    675   7%    Colorado             73    881     5%     0%       31%    Colorado             76     974 5%  #DIV/0!              44%
Montana           0    270   3%    Montana                    513     2% #DIV/0!      90%    Montana               6     192 1%  #DIV/0!             -29%
Nebraska         49    181   2%    Nebraska            294    433     3%   500%      139%    Nebraska           269      549 4%        449%         203%
New Mexico        0    313   3%    New Mexico                 484     2% #DIV/0!      55%    New Mexico           60     548 3%  #DIV/0!              75%
North Dakota     24     91   1%    North Dakota               184     1%  -100%      102%    North Dakota          0      90 0%        -98%            -1%
Oklahoma                           Oklahoma                                                  Oklahoma
South Dakota      0      26 0%     South Dakota                86   0% #DIV/0!  231%         South Dakota         12     104 0%  #DIV/0!            299%
Texas           489   7,137 82%    Texas                   17,461 84%   -100%   145%         Texas            1,034 18,505 84%         111%         159%
Wyoming          16       0 0%     Wyoming                    473   2%  -100% #DIV/0!        Wyoming            178      619 3%       1013%    #DIV/0!
Total ($m)      578   8,693        Total ($m)          367 20,515 100%   -37%   136%         Total ($m)       1,636 21,581 100%        183%         148%
                      9,271                                20,882               125%                                  23,217                        150%

Imports         Rail Truck         Imports             Rail Truck                            Imports        Rail     Truck
Colorado          0    240   2%    Colorado              0    420     3%   #DIV/0!     75%   Colorado          64       416     3%   #DIV/0!           73%
Montana          15      4   0%    Montana                            0%    -100%    -100%   Montana           32        10     0%       115%         142%
Nebraska          0    464   4%    Nebraska                    417    3%   #DIV/0!    -10%   Nebraska         140       451     3%   #DIV/0!           -3%
New Mexico        0     15   0%    New Mexico            7      65    0%   #DIV/0!    333%   New Mexico          8       95     1%   #DIV/0!          534%
North Dakota      0     59   1%    North Dakota                       0%   #DIV/0!   -100%   North Dakota        4       74     0%   #DIV/0!           26%
Oklahoma                           Oklahoma                                                  Oklahoma                            0
South Dakota      0     55 1%      South Dakota                 128 1% #DIV/0!  133%         South Dakota       2       142     1%   #DIV/0!          158%
Texas           290 9,209 90%      Texas                     14,12292%  -100%    53%         Texas            416    16,688    91%         43%          81%
Wyoming         148      0 1%      Wyoming             261          2%    76% #DIV/0!        Wyoming          240        44     2%         62%   #DIV/0!
Total ($m)      453 10,046         Total ($m)          268 15,152 100%   -41%    51%         Total ($m)       905    17,920   100%       100%           78%
                    10,499                                 15,420                47%                                 18,824                             79%

TOTALS          Rail Truck         TOTALS              Rail Truck                            TOTALS         Rail     Truck
Colorado          0    915   5%    Colorado             73 1,301      4% #DIV/0!      42%    Colorado         140     1,390     4%   #DIV/0!           52%
Montana          15    274   1%    Montana               0    513     1%  -100%       87%    Montana           38       202     1%       155%         -26%
Nebraska         49    645   4%    Nebraska            294    850     3%   500%       32%    Nebraska         409     1,000     3%       735%          55%
New Mexico        0    328   2%    New Mexico            7    549     2% #DIV/0!      67%    New Mexico        68       643     2%   #DIV/0!           96%
North Dakota     24    150   1%    North Dakota          0    184     1%  -100%       23%    North Dakota        4      165     0%        -83%         10%
Oklahoma                           Oklahoma                                                  Oklahoma                            0
South Dakota       0     81 0%     South Dakota          0    214   1% #DIV/0!  164%         South Dakota      14       246     1%   #DIV/0!          203%
Texas            779 16,346 87%    Texas                 0 31,583 87%   -100%    93%         Texas          1,450    35,193    87%         86%        115%
Wyoming          164      0 1%     Wyoming             261    473   2%    59% #DIV/0!        Wyoming          418       663     3%       155%    #DIV/0!
Total ($m)     1,031 18,739        Total ($m)          635 35,667 100%   -38%    90%         Total ($m)     2,540    39,501   100%   #DIV/0!          111%
                     19,770                                36,302                84%                                 42,041                           113%
Oklahoma Trading Relationships -- 2004 - 2010                                                                                                                                                 Mexico
                                                                                                                                                                                                     Domestic
                                                                                                                                                                                                      Canada


                                                                                                                                                                           2009-2010 2009-2010       2004-2010 2004-2010
                                                                       2004            2005           2006           2007           2008           2009           2010     Difference % Change       Difference % Change
Canada
Truck              Exports                                   $897,832,410.00 $1,205,945,658 $1,421,518,002 $1,300,960,636 $1,449,512,286 $1,160,092,869 $1,572,852,931 $412,760,062        35.6%   $675,020,521     75.2%
                   Imports                                   $733,180,354.00   $781,187,475   $853,086,590   $843,419,652   $980,341,366   $680,921,040   $714,523,411 $33,602,371          4.9%   -$18,656,943     -2.5%
                   Total Truck Trade with Canada            $1,631,012,764.00 $1,987,133,133 $2,274,604,592 $2,144,380,288 $2,429,853,652 $1,841,013,909 $2,287,376,342 $446,362,433       24.2%   $656,363,578     40.2%
                                                                                                                                                                                        #DIV/0!
Rail               Exports                                   $176,562,662.00   $286,195,385    $150,653,803    $81,641,142   $110,008,733    $75,769,940    $87,608,347 $11,838,407        15.6%   -$88,954,315     -50.4%
                   Imports                                   $264,650,856.00   $645,932,049    $376,460,879   $251,067,859   $295,299,620   $168,914,816   $258,331,246 $89,416,430        52.9%    -$6,319,610      -2.4%
                   Total Rail Trade with Canada              $441,213,518.00   $932,127,434    $527,114,682   $332,709,001   $405,308,353   $244,684,756   $345,939,593 $101,254,837       41.4%   -$95,273,925     -21.6%
                                                                                                                                                                                        #DIV/0!
TOTAL              Exports                                  $1,074,395,072.00 $1,492,141,043 $1,572,171,805 $1,382,601,778 $1,559,521,019 $1,235,862,809 $1,660,461,278 $424,598,469       34.4%   $586,066,206     54.5%
                   Imports                                   $997,831,210.00 $1,427,119,524 $1,229,547,469 $1,094,487,511 $1,275,640,986   $849,835,856    $972,854,657 $123,018,801       14.5%   -$24,976,553     -2.5%
                   Total Trade with Canada                  $2,072,226,282.00 $2,919,260,567 $2,801,719,274 $2,477,089,289 $2,835,162,005 $2,085,698,665 $2,633,315,935 $547,617,270       26.3%   $561,089,653     27.1%


Raymond, MT

Truck              Exports                                          $71,674         $79,225      $1,543,246       $930,429     $1,623,588     $1,850,765    $15,287,650   $13,436,885    726.0%     $15,215,976   21229.4%
                             % of Total Exports to Canada              0.0%            0.0%           0.1%           0.1%           0.1%           0.2%           1.0%                     0.8%                       1.0%
                   Imports                                         $709,775        $552,926       $175,251      $1,584,247       $416,183       $246,412     $4,680,523    $4,434,111   1799.5%      $3,970,748     559.4%
                             % of Total Imports to Canada              0.1%            0.1%           0.0%           0.2%           0.0%           0.0%           0.7%                     0.6%                       0.6%
                   Total Truck Trade Thru Raymond                   $781,449       $632,151      $1,718,497     $2,514,676     $2,039,771     $2,097,177    $19,968,173   $17,870,996    852.1%     $19,186,724    2455.3%
                                % Total Trade with Canada              0.0%            0.0%           0.1%           0.1%           0.1%           0.1%           0.9%                     0.8%                       0.8%

Rail               Exports                                               $0               $0                                                                                      $0    #DIV/0!             $0    #DIV/0!
                             % of Total Exports to Canada              0.0%            0.0%           0.0%           0.0%           0.0%           0.0%           0.0%                      0.0%                      0.0%
                   Imports                                               $0              $0                                                                                       $0    #DIV/0!             $0    #DIV/0!
                             % of Total Imports to Canada              0.0%            0.0%           0.0%           0.0%           0.0%           0.0%           0.0%                      0.0%                      0.0%
                   Total Truck Trade Thru Raymond                         $0              $0                            $0             $0             $0             $0           $0    #DIV/0!             $0    #DIV/0!
                                % Total Trade with Canada              0.0%            0.0%           0.0%           0.0%           0.0%           0.0%           0.0%                      0.0%                      0.0%

TOTAL
                   Exports                                           $71,674        $79,225      $1,543,246       $930,429     $1,623,588     $1,850,765    $15,287,650   $13,436,885    726.0%     $15,215,976   21229.4%
                             % of Total Exports to Canada               0.0%           0.0%            0.1%          0.1%           0.1%           0.1%           0.9%                     0.8%                       0.9%
                   Imports                                          $709,775       $552,926       $175,251      $1,584,247      $416,183       $246,412      $4,680,523    $4,434,111   1799.5%      $3,970,748     559.4%
                             % of Total Imports to Canada               0.1%           0.0%           0.0%           0.1%           0.0%           0.0%           0.5%                     0.5%                       0.4%
                   Total Trade Thru Raymond                         $781,449       $632,151      $1,718,497     $2,514,676     $2,039,771     $2,097,177    $19,968,173   $17,870,996    852.1%     $19,186,724    2455.3%
                                % Total Trade with Canada               0.0%           0.0%            0.1%          0.1%           0.1%           0.1%            0.8%                    0.7%                       0.7%
Oklahoma Trading Relationships -- 2004 - 2010                                                                                                                                          Mexico
                                                                                                                                                                                             Domestic
                                                                                                                                                                                              Canada


                                                                                                                                                                       2009-2010 2009-2010    2004-2010 2004-2010
                                                                    2004           2005           2006           2007           2008           2009           2010     Difference % Change    Difference % Change

Sweet Grass, MT


Truck             Exports                                   $233,546,574    $350,672,951   $433,603,461   $304,070,201   $373,200,765   $237,283,910   $360,064,256 $122,780,346     51.7% $126,517,682    54.2%
                            % of Total Exports to Canada            26.0%          29.1%          30.5%          23.4%         25.7%          20.5%          22.9%                    2.4%                 -3.1%
                  Imports                                     $73,164,225   $118,681,783   $158,681,183   $186,222,515   $228,772,939   $109,149,429   $133,333,395 $24,183,966      22.2% $60,169,170     82.2%
                            % of Total Exports to Canada            10.0%          15.2%          18.6%          22.1%          23.3%          16.0%          18.7%                   2.6%                  8.7%
                  Total Truck Trade Thru Sweet Grass           306710799    $469,354,734   $592,284,644   $490,292,716   $601,973,704   $346,433,339   $493,397,651 $146,964,312     42.4% $186,686,852    60.9%
                               % Total Trade with Canada            18.8%          23.6%          26.0%          22.9%         24.8%          18.8%           21.6%                   2.8%                  2.8%

Rail              Exports                                    $1,697,666       $2,420,158    $13,537,642     $7,901,656    $19,487,718     $3,092,198     $4,403,609    $1,311,411    42.4%    $2,705,943   159.4%
                            % of Total Exports to Canada            1.0%            0.8%           9.0%           9.7%         17.7%           4.1%           5.0%                    0.9%                   4.1%
                  Imports                                    $10,013,234     $15,226,946    $20,684,475    $32,818,594    $46,791,742    $11,907,943    $24,202,498   $12,294,555   103.2%   $14,189,264   141.7%
                             % of Total Exports to Canada           3.8%            2.4%           5.5%          13.1%         15.8%           7.0%           9.4%                    2.3%                   5.6%
                  Total Rail Trade Thru Sweet Grass          $11,710,900     $17,647,104    $34,222,117    $40,720,250    $66,279,460    $15,000,141    $28,606,107   $13,605,966    90.7%   $16,895,207   144.3%
                               % Total Trade with Canada            2.7%            1.9%           6.5%          12.2%         16.4%           6.1%            8.3%                   2.1%                   5.6%

TOTAL
                  Exports                                   $235,244,240    $353,093,109   $447,141,103   $311,971,857   $392,688,483   $240,376,108   $364,467,865 $124,091,757     51.6% $129,223,625    54.9%
                            % of Total Exports to Canada           21.9%           23.7%          28.4%          22.6%          25.2%          19.5%          21.9%                   2.5%                  0.1%
                  Imports                                    $83,177,459    $133,908,729   $179,365,658   $219,041,109   $275,564,681   $121,057,372   $157,535,893 $36,478,521      30.1% $74,358,434     89.4%
                            % of Total Imports to Canada            8.3%            9.4%          14.6%          20.0%         21.6%           14.2%          16.2%                   1.9%                  7.9%
                  Total Trade Thru Sweet Grass              $318,421,699    $487,001,838   $626,506,761   $531,012,966   $668,253,164   $361,433,480   $522,003,758 $160,570,278     44.4% $203,582,059    63.9%
                               % Total Trade with Canada           15.4%           16.7%          22.4%          21.4%         23.6%          17.3%           19.8%                   2.5%                  4.5%

Portal, ND

Truck             Exports                                    $61,712,804    $120,688,417   $153,643,699   $130,265,014   $176,868,686   $121,815,103   $196,178,597   $74,363,494    61.0% $134,465,793    217.9%
                            % of Total Exports to Canada            6.9%           10.0%          10.8%          10.0%         12.2%           10.5%          12.5%                   2.0%                   5.6%
                  Imports                                    $21,238,017     $20,205,458    $30,587,116    $34,939,031    $35,511,135    $26,902,480    $43,951,411   $17,048,931    63.4% $22,713,394     106.9%
                            % of Total Imports to Canada            2.9%            2.6%           3.6%           4.1%          3.6%            4.0%           6.2%                   2.2%                   3.3%
                  Total Truck Trade Thru Portal              $82,950,821    $140,893,875   $184,230,815   $165,204,045   $212,379,821   $148,717,583   $240,130,008   $91,412,425    61.5% $157,179,187    189.5%
                               % Total Trade with Canada            5.1%            7.1%           8.1%           7.7%          8.7%            8.1%          10.5%                   2.4%                   5.4%

Rail              Exports                                     $3,933,566     $12,778,589    $13,326,530     $7,924,672    $36,174,371    $15,260,903    $31,222,231   $17,895,701   104.6% $27,288,665     693.7%
                            % of Total Exports to Canada            2.2%            4.5%           8.8%           9.7%         32.9%           20.1%          35.6%                  15.5%                  33.4%
                  Imports                                    $15,070,036     $33,408,555    $41,351,266    $47,070,699    $48,365,649    $48,117,553    $94,083,875   $52,732,609    95.5% $79,013,839     524.3%
                             % of Total Imports to Canada           5.7%            5.2%          11.0%          18.7%         16.4%          28.5%          36.4%                    7.9%                  30.7%
                  Total Rail Trade Thru Portal               $19,003,602     $46,187,144    $54,677,796    $54,995,371    $84,540,020    $63,378,456   $125,306,106   $70,628,310    97.7% $106,302,504    559.4%
                               % Total Trade with Canada            4.3%            5.0%          10.4%          16.5%         20.9%          25.9%           36.2%                  10.3%                  31.9%

TOTAL
                  Exports                                    $65,646,370    $133,467,006   $153,643,699   $130,265,014   $176,868,686   $121,815,103   $196,178,597 $74,363,494      61.0% $161,754,458    198.8%
                            % of Total Exports to Canada            6.1%            8.9%           9.8%           9.4%         11.3%            9.9%          11.8%                   2.0%                   5.7%
                  Imports                                    $36,308,053     $53,614,013    $71,938,382    $82,009,730    $83,876,784    $75,020,033   $138,035,286 $63,015,253      84.0% $101,727,233    280.2%
                            % of Total Imports to Canada            3.6%            3.8%           7.2%           7.5%          6.6%            8.8%         14.2%                    5.4%                  10.5%
                  Total Trade Thru Portal                   $101,954,423    $187,081,019   $225,582,081   $212,274,744   $260,745,470   $196,835,136   $334,213,883 $137,378,747     69.8% $263,481,691    227.8%
                               % Total Trade with Canada            4.9%            6.4%           8.1%           8.6%          9.2%           9.4%           12.7%                   3.3%                   7.8%
Oklahoma Trading Relationships -- 2004 - 2010                                                                                                                                           Mexico
                                                                                                                                                                                              Domestic
                                                                                                                                                                                               Canada


                                                                                                                                                                      2009-2010 2009-2010     2004-2010 2004-2010
                                                                   2004           2005           2006           2007           2008           2009           2010     Difference % Change     Difference % Change
Wild Horse
                                                                      0
Truck             Exports                                            $0              $0             $0             $0             $0             $0             $0           $0    #DIV/0!           $0    #DIV/0!
                            % of Total Exports to Canada           0.0%           0.0%           0.0%           0.0%          0.0%            0.0%           0.0%                      0.0%                    0.0%
                  Imports                                       $13,930             $0              $0       $36,325         $7,000         $7,670              $0       -$7,670    -100.0%     -$13,930    -100.0%
                            % of Total Imports to Canada           0.0%           0.0%           0.0%          0.0%           0.0%            0.0%           0.0%                      0.0%                    0.0%
                  Total Truck Trade Thru GPITC                  $13,930              $0             $0       $36,325         $7,000         $7,670              $0       -$7,670    -100.0%     -$13,930    -100.0%
                               % Total Trade with Canada           0.0%           0.0%           0.0%           0.0%           0.0%          0.0%            0.0%                      0.0%                    0.0%

Rail              Exports                                            $0              $0             $0             $0             $0             $0             $0           $0    #DIV/0!           $0    #DIV/0!
                            % of Total Exports to Canada           0.0%           0.0%           0.0%           0.0%           0.0%           0.0%           0.0%                      0.0%                    0.0%
                  Imports                                            $0             $0              $0             $0             $0             $0             $0           $0    #DIV/0!           $0    #DIV/0!
                             % of Total Imports to Canada          0.0%           0.0%           0.0%           0.0%           0.0%           0.0%           0.0%                      0.0%                    0.0%
                  Total Rail Trade Thru GPITC                         $0             $0             $0             $0             $0             $0             $0           $0    #DIV/0!           $0    #DIV/0!
                               % Total Trade with Canada           0.0%           0.0%           0.0%           0.0%           0.0%           0.0%           0.0%                      0.0%                    0.0%

TOTAL
                  Exports                                            $0              $0             $0             $0             $0             $0             $0           $0    #DIV/0!           $0    #DIV/0!
                            % of Total Exports to Canada           0.0%           0.0%           0.0%           0.0%          0.0%            0.0%           0.0%                      0.0%                    0.0%
                  Imports                                       $13,930             $0              $0       $36,325         $7,000         $7,670              $0       -$7,670    -100.0%     -$13,930    -100.0%
                            % of Total Imports to Canada           0.0%           0.0%           0.0%          0.0%           0.0%            0.0%           0.0%                      0.0%                    0.0%
                  Total Trade Thru GPITC                        $13,930              $0             $0       $36,325         $7,000         $7,670              $0       -$7,670    -100.0%     -$13,930    -100.0%
                               % Total Trade with Canada           0.0%           0.0%           0.0%           0.0%           0.0%          0.0%            0.0%                      0.0%                    0.0%

GPITC
                                                            #DIV/0!
Truck             Exports                                   $295,331,052   $471,440,593   $588,790,406   $435,265,644   $551,693,039   $360,949,778   $571,530,503 $210,580,725      58.3% $276,199,451      93.5%
                            % of Total Exports to Canada           32.9%          39.1%          41.4%          33.5%          38.1%          31.1%          36.3%                    5.2%                    3.4%
                  Imports                                    $94,487,846   $138,966,466   $190,811,545   $222,128,300   $265,914,662   $137,910,344   $192,572,456 $54,662,112       39.6% $98,084,610      103.8%
                            % of Total Imports to Canada           12.9%          17.8%          22.4%         26.3%          27.1%           20.3%         27.0%                     6.7%                   14.1%
                  Total Truck Trade Thru GPITC              $389,818,898   $610,407,059   $779,601,951   $657,393,944   $817,607,701   $498,860,122   $764,102,959 $265,242,837      53.2% $374,284,061      96.0%
                               % Total Trade with Canada           23.9%          30.7%          34.3%          30.7%         33.6%          27.1%           33.4%                    6.3%                    9.5%

Rail              Exports                                     $5,631,232    $15,198,747    $26,864,172    $15,826,328    $55,662,089    $18,353,101    $35,625,840   $17,272,739     94.1% $29,994,608      532.6%
                            % of Total Exports to Canada            0.6%           1.3%           1.9%           1.2%          3.8%            1.6%           2.3%                    0.7%                    1.6%
                  Imports                                    $25,083,270    $48,635,501    $62,035,741    $79,889,293    $95,157,391    $60,025,496   $118,286,373   $58,260,877     97.1% $93,203,103      371.6%
                             % of Total Imports to Canada           3.4%           6.2%           7.3%           9.5%          9.7%            8.8%         16.6%                     7.7%                   13.1%
                  Total Rail Trade Thru GPITC                $30,714,502    $63,834,248    $88,899,913    $95,715,621   $150,819,480    $78,378,597   $153,912,213   $75,533,616     96.4% $123,197,711     401.1%
                               % Total Trade with Canada            1.9%           3.2%           3.9%           4.5%          6.2%           4.3%            6.7%                    2.5%                    4.8%

TOTAL
                  Exports                                   $300,962,284   $486,639,340   $615,654,578   $451,091,972   $607,355,128   $379,302,879   $607,156,343 $227,853,464      60.1% $306,194,059     101.7%
                            % of Total Exports to Canada           28.0%          32.6%         39.2%          32.6%     0.389449787         30.7%          36.6%                     5.9%                    8.6%
                  Imports                                   $119,571,116   $187,601,967   $252,847,286   $302,017,593   $361,072,053   $197,935,840   $310,858,829 $112,922,989      57.1% $191,287,713     160.0%
                            % of Total Imports to Canada           12.0%         13.1%          20.6%          27.6%     0.283051467         23.3%          32.0%                     8.7%                   20.0%
                  Total Trade Thru GPITC                    $420,533,400   $674,241,307   $868,501,864   $753,109,565   $968,427,181   $577,238,719   $918,015,172 $340,776,453      59.0% $497,481,772     118.3%
                               % Total Trade with Canada           20.3%          23.1%          31.0%          30.4%     0.34157737         27.7%           34.9%                    7.2%                   14.6%
Oklahoma Trading Relationships -- 2004 - 2010                                                                                                              Mexico
                                                                                                                                                            Domestic
                                                                                                                                                             Canada


2010         Leading Exports from Oklahoma to Canada (Surface          2010    2010        Leading Exports from Oklahoma to Canada (Surface         2010
             Transportation)                                                               Transportation)
Rank                                                                  Export   Rank        Alberta                                                Export
1       84   Computer-Related Machinery and Parts               $493,462,513      1   84   Computer-Related Machinery and Parts             $196,677,438
2       27   Mineral Fuels; Oils and Waxes                      $236,666,575      2   73   Articles of Iron and Steel                        $48,254,332
3       40   Rubber and Articles                                $192,929,008      3   82   Tools of Base Metal                               $35,877,311
4       73   Articles of Iron and Steel                         $189,658,903      4   85   Electrical Machinery; Equipment and Parts         $33,672,394
5       85   Electrical Machinery; Equipment and Parts          $134,268,799      5   87   Vehicles Other than Railway                       $20,809,166
6       87   Vehicles Other than Railway                        $124,399,763      6   90   Measuring and Testing Instruments                 $13,612,207
7       39   Plastics and Articles                               $82,053,333      7   39   Plastics and Articles                              $6,682,627
8       82   Tools of Base Metal                                 $43,814,782      8   38   Miscellaneous Chemical Products                    $5,543,263
9       16   Preparations of Fish and Meat                       $35,518,672      9   16   Preparations of Fish and Meat                      $5,411,439
10      88   Aircraft; Spacecraft and Parts                      $34,620,197     10   40   Rubber and Articles                                $4,733,237

 2010        Leading Imports to Oklahoma from Canada (Surface          2010    2010        Leading Exports from Oklahoma to Canada (Surface          2010
Rank                                                                  Export   Rank        British Colombia                                        Export
1       27   Mineral Fuels; Oils and Waxes                      $461,070,539      1   84   Computer-Related Machinery and Parts               $18,973,357
2       84   Computer-Related Machinery and Parts               $305,062,801      2   73   Articles of Iron and Steel                         $13,304,994
3       39   Plastics and Articles                               $96,604,706      3   87   Vehicles Other than Railway                         $5,369,960
4       73   Articles of Iron and Steel                          $80,896,123      4   35   Albuminoidal Substances; Glues and Enzymes          $2,909,549
5       98   Special Classification Provisions                   $77,907,931      5   85   Electrical Machinery; Equipment and Parts           $2,196,212
6       47   Pulp of Wood and Paperboard                         $55,987,889      6   18   Cocoa and Cocoa Preparations                        $1,860,676
7       85   Electrical Machinery; Equipment and Parts           $49,863,566      7   39   Plastics and Articles                               $1,852,515
8       48   Paper and Paperboard                                $37,385,169      8   90   Measuring and Testing Instruments                   $1,578,047
9       2    Meat and Edible Offal                               $29,382,462      9   82   Tools of Base Metal                                 $1,440,304
10      90   Measuring and Testing Instruments                   $28,576,506     10   16   Preparations of Fish and Meat                         $960,585

                                                                               2010        Leading Exports from Oklahoma to Canada (Surface          2010
                                                                               Rank        Saskatchewan                                            Export
                                                                                  1   84   Computer-Related Machinery and Parts               $94,052,110
                                                                                  2   27   Mineral Fuels; Oils and Waxes                      $53,987,367
                                                                                  3   73   Articles of Iron and Steel                         $43,696,547
                                                                                  4   87   Vehicles Other than Railway                        $17,146,264
                                                                                  5   85   Electrical Machinery; Equipment and Parts           $4,938,418
                                                                                  6   39   Plastics and Articles                               $3,180,389
                                                                                  7   38   Miscellaneous Chemical Products                     $3,124,209
                                                                                  8   90   Measuring and Testing Instruments                   $1,824,973
                                                                                  9   40   Rubber and Articles                                 $1,556,639
                                                                                 10   16   Preparations of Fish and Meat                         $620,084

More Related Content

What's hot

Texas Trade through Ports-to-Plains Region – 2004-2010
Texas Trade through Ports-to-Plains Region – 2004-2010Texas Trade through Ports-to-Plains Region – 2004-2010
Texas Trade through Ports-to-Plains Region – 2004-2010Ports-To-Plains Blog
 
Nebraska Trade Relationships 2004 – 2011
Nebraska Trade Relationships 2004 – 2011Nebraska Trade Relationships 2004 – 2011
Nebraska Trade Relationships 2004 – 2011Ports-To-Plains Blog
 
Ports-to-Plains Alliance Trade Summary 2004-2011
Ports-to-Plains Alliance Trade Summary 2004-2011Ports-to-Plains Alliance Trade Summary 2004-2011
Ports-to-Plains Alliance Trade Summary 2004-2011Ports-To-Plains Blog
 
Montana Trading Relationship 2004-2011
Montana Trading Relationship 2004-2011Montana Trading Relationship 2004-2011
Montana Trading Relationship 2004-2011Ports-To-Plains Blog
 
North Dakota Trade Relationships 2004-2011
North Dakota Trade Relationships 2004-2011North Dakota Trade Relationships 2004-2011
North Dakota Trade Relationships 2004-2011Ports-To-Plains Blog
 
South Dakota Trade Relationships 2004-2011
South Dakota Trade Relationships 2004-2011South Dakota Trade Relationships 2004-2011
South Dakota Trade Relationships 2004-2011Ports-To-Plains Blog
 
Colorado Trade Relationships 2004-2011
Colorado Trade Relationships 2004-2011Colorado Trade Relationships 2004-2011
Colorado Trade Relationships 2004-2011Ports-To-Plains Blog
 
Texas Trade Relationships 2004 - 2011
Texas Trade Relationships 2004 - 2011Texas Trade Relationships 2004 - 2011
Texas Trade Relationships 2004 - 2011Ports-To-Plains Blog
 
Oklahoma Trade Relationships 2004-2011
Oklahoma Trade Relationships 2004-2011Oklahoma Trade Relationships 2004-2011
Oklahoma Trade Relationships 2004-2011Ports-To-Plains Blog
 
Dodo pizza monthly update - january 2019
Dodo pizza   monthly update - january 2019Dodo pizza   monthly update - january 2019
Dodo pizza monthly update - january 2019Kirill Vyrypaev
 
Q2 2017 CONDO MARKET REPORT
Q2 2017 CONDO MARKET REPORTQ2 2017 CONDO MARKET REPORT
Q2 2017 CONDO MARKET REPORTMichelle Makos
 
Slide presentation 2 q10
Slide presentation 2 q10Slide presentation 2 q10
Slide presentation 2 q10Cia Hering RI
 
Venture Capital Exits Q3 06
  	Venture Capital Exits Q3 06    	Venture Capital Exits Q3 06
Venture Capital Exits Q3 06 mensa25
 
Market Watch June 2013
Market Watch June 2013Market Watch June 2013
Market Watch June 2013Chaba Tamasi
 
September 2020 - Market Report - Toronto & GTA Housing Sales
September 2020 - Market Report - Toronto & GTA Housing SalesSeptember 2020 - Market Report - Toronto & GTA Housing Sales
September 2020 - Market Report - Toronto & GTA Housing SalesMichelle Makos
 
August 2021 market watch
August 2021 market watchAugust 2021 market watch
August 2021 market watchMichelle Makos
 
Exit Poll Release – Q4 ‘06
  	Exit Poll Release – Q4 ‘06    	Exit Poll Release – Q4 ‘06
Exit Poll Release – Q4 ‘06 mensa25
 
Market Watch TORONTO 2015 OCTOBER
Market Watch TORONTO 2015 OCTOBERMarket Watch TORONTO 2015 OCTOBER
Market Watch TORONTO 2015 OCTOBERChaba Tamasi
 

What's hot (20)

Texas Trade through Ports-to-Plains Region – 2004-2010
Texas Trade through Ports-to-Plains Region – 2004-2010Texas Trade through Ports-to-Plains Region – 2004-2010
Texas Trade through Ports-to-Plains Region – 2004-2010
 
Nebraska Trade Relationships 2004 – 2011
Nebraska Trade Relationships 2004 – 2011Nebraska Trade Relationships 2004 – 2011
Nebraska Trade Relationships 2004 – 2011
 
Ports-to-Plains Alliance Trade Summary 2004-2011
Ports-to-Plains Alliance Trade Summary 2004-2011Ports-to-Plains Alliance Trade Summary 2004-2011
Ports-to-Plains Alliance Trade Summary 2004-2011
 
Montana Trading Relationship 2004-2011
Montana Trading Relationship 2004-2011Montana Trading Relationship 2004-2011
Montana Trading Relationship 2004-2011
 
North Dakota Trade Relationships 2004-2011
North Dakota Trade Relationships 2004-2011North Dakota Trade Relationships 2004-2011
North Dakota Trade Relationships 2004-2011
 
South Dakota Trade Relationships 2004-2011
South Dakota Trade Relationships 2004-2011South Dakota Trade Relationships 2004-2011
South Dakota Trade Relationships 2004-2011
 
Colorado Trade Relationships 2004-2011
Colorado Trade Relationships 2004-2011Colorado Trade Relationships 2004-2011
Colorado Trade Relationships 2004-2011
 
Texas Trade Relationships 2004 - 2011
Texas Trade Relationships 2004 - 2011Texas Trade Relationships 2004 - 2011
Texas Trade Relationships 2004 - 2011
 
Oklahoma Trade Relationships 2004-2011
Oklahoma Trade Relationships 2004-2011Oklahoma Trade Relationships 2004-2011
Oklahoma Trade Relationships 2004-2011
 
Dodo pizza monthly update - january 2019
Dodo pizza   monthly update - january 2019Dodo pizza   monthly update - january 2019
Dodo pizza monthly update - january 2019
 
Q2 2017 CONDO MARKET REPORT
Q2 2017 CONDO MARKET REPORTQ2 2017 CONDO MARKET REPORT
Q2 2017 CONDO MARKET REPORT
 
Slide presentation 2 q10
Slide presentation 2 q10Slide presentation 2 q10
Slide presentation 2 q10
 
Venture Capital Exits Q3 06
  	Venture Capital Exits Q3 06    	Venture Capital Exits Q3 06
Venture Capital Exits Q3 06
 
Market Watch June 2013
Market Watch June 2013Market Watch June 2013
Market Watch June 2013
 
September 2020 - Market Report - Toronto & GTA Housing Sales
September 2020 - Market Report - Toronto & GTA Housing SalesSeptember 2020 - Market Report - Toronto & GTA Housing Sales
September 2020 - Market Report - Toronto & GTA Housing Sales
 
Apimec 2 q06 results
Apimec   2 q06 resultsApimec   2 q06 results
Apimec 2 q06 results
 
IT Industry Statistics 2007 Final Report
IT Industry Statistics 2007 Final ReportIT Industry Statistics 2007 Final Report
IT Industry Statistics 2007 Final Report
 
August 2021 market watch
August 2021 market watchAugust 2021 market watch
August 2021 market watch
 
Exit Poll Release – Q4 ‘06
  	Exit Poll Release – Q4 ‘06    	Exit Poll Release – Q4 ‘06
Exit Poll Release – Q4 ‘06
 
Market Watch TORONTO 2015 OCTOBER
Market Watch TORONTO 2015 OCTOBERMarket Watch TORONTO 2015 OCTOBER
Market Watch TORONTO 2015 OCTOBER
 

Viewers also liked

Howdy Partner!: Heartland Expressway Association
Howdy Partner!: Heartland Expressway AssociationHowdy Partner!: Heartland Expressway Association
Howdy Partner!: Heartland Expressway AssociationPorts-To-Plains Blog
 
Reach for the Sky!: Funding Opportunities – Programs, grants, innovative fund...
Reach for the Sky!: Funding Opportunities – Programs, grants, innovative fund...Reach for the Sky!: Funding Opportunities – Programs, grants, innovative fund...
Reach for the Sky!: Funding Opportunities – Programs, grants, innovative fund...Ports-To-Plains Blog
 
Rural Heartland of America – Equity Evaluation
Rural Heartland of America – Equity EvaluationRural Heartland of America – Equity Evaluation
Rural Heartland of America – Equity EvaluationPorts-To-Plains Blog
 
Howdy Partners!: Eastern Alberta Corridor
Howdy Partners!: Eastern Alberta CorridorHowdy Partners!: Eastern Alberta Corridor
Howdy Partners!: Eastern Alberta CorridorPorts-To-Plains Blog
 
Proyecto Curricular de centro en Secundaria
Proyecto Curricular de centro  en SecundariaProyecto Curricular de centro  en Secundaria
Proyecto Curricular de centro en SecundariaAna Basterra
 
Productora The Seven[1][2] Final
Productora The Seven[1][2] FinalProductora The Seven[1][2] Final
Productora The Seven[1][2] FinalnikoL
 
Marketing pessoal na internet andreza mendes
Marketing pessoal na internet   andreza mendesMarketing pessoal na internet   andreza mendes
Marketing pessoal na internet andreza mendesAndreza Mendes
 
Dau al set
Dau al setDau al set
Dau al setguacho22
 
衛星芸術Pbl 2011 10_18
衛星芸術Pbl 2011 10_18衛星芸術Pbl 2011 10_18
衛星芸術Pbl 2011 10_18Koichiro Mori
 
Grupo jane
Grupo janeGrupo jane
Grupo janeIFES
 
愛媛県松山市におけるIt勉強会事情
愛媛県松山市におけるIt勉強会事情愛媛県松山市におけるIt勉強会事情
愛媛県松山市におけるIt勉強会事情ramu sara
 

Viewers also liked (20)

Howdy Partner!: Heartland Expressway Association
Howdy Partner!: Heartland Expressway AssociationHowdy Partner!: Heartland Expressway Association
Howdy Partner!: Heartland Expressway Association
 
Reach for the Sky!: Funding Opportunities – Programs, grants, innovative fund...
Reach for the Sky!: Funding Opportunities – Programs, grants, innovative fund...Reach for the Sky!: Funding Opportunities – Programs, grants, innovative fund...
Reach for the Sky!: Funding Opportunities – Programs, grants, innovative fund...
 
Keynote Presentation
Keynote PresentationKeynote Presentation
Keynote Presentation
 
Rural Heartland of America – Equity Evaluation
Rural Heartland of America – Equity EvaluationRural Heartland of America – Equity Evaluation
Rural Heartland of America – Equity Evaluation
 
Howdy Partners!: Eastern Alberta Corridor
Howdy Partners!: Eastern Alberta CorridorHowdy Partners!: Eastern Alberta Corridor
Howdy Partners!: Eastern Alberta Corridor
 
Proyecto Curricular de centro en Secundaria
Proyecto Curricular de centro  en SecundariaProyecto Curricular de centro  en Secundaria
Proyecto Curricular de centro en Secundaria
 
Śniadanie Daje Moc
Śniadanie Daje MocŚniadanie Daje Moc
Śniadanie Daje Moc
 
Entregabilidade e Emails
Entregabilidade e EmailsEntregabilidade e Emails
Entregabilidade e Emails
 
Productora The Seven[1][2] Final
Productora The Seven[1][2] FinalProductora The Seven[1][2] Final
Productora The Seven[1][2] Final
 
INEC | junho 2012
INEC | junho 2012INEC | junho 2012
INEC | junho 2012
 
Apresentação Sondagem Investimentos na Indústria 2011
Apresentação Sondagem Investimentos na Indústria 2011Apresentação Sondagem Investimentos na Indústria 2011
Apresentação Sondagem Investimentos na Indústria 2011
 
Informe Conjuntural | Abril a junho 2012
Informe Conjuntural | Abril a junho 2012Informe Conjuntural | Abril a junho 2012
Informe Conjuntural | Abril a junho 2012
 
Regulamento - Prêmio CNI de Jornalismo 2013
Regulamento - Prêmio CNI de Jornalismo 2013Regulamento - Prêmio CNI de Jornalismo 2013
Regulamento - Prêmio CNI de Jornalismo 2013
 
Marketing pessoal na internet andreza mendes
Marketing pessoal na internet   andreza mendesMarketing pessoal na internet   andreza mendes
Marketing pessoal na internet andreza mendes
 
CNI IBOPE Especial | Julho 2013
CNI IBOPE Especial | Julho 2013CNI IBOPE Especial | Julho 2013
CNI IBOPE Especial | Julho 2013
 
Dau al set
Dau al setDau al set
Dau al set
 
衛星芸術Pbl 2011 10_18
衛星芸術Pbl 2011 10_18衛星芸術Pbl 2011 10_18
衛星芸術Pbl 2011 10_18
 
Workshop Infra-estrutura - 2006
Workshop Infra-estrutura - 2006Workshop Infra-estrutura - 2006
Workshop Infra-estrutura - 2006
 
Grupo jane
Grupo janeGrupo jane
Grupo jane
 
愛媛県松山市におけるIt勉強会事情
愛媛県松山市におけるIt勉強会事情愛媛県松山市におけるIt勉強会事情
愛媛県松山市におけるIt勉強会事情
 

Similar to Oklahoma Trade through Ports-to-Plains Region – 2004-2010

Naa Annual Newspaper Ad Expenditures 09
Naa Annual Newspaper Ad Expenditures 09Naa Annual Newspaper Ad Expenditures 09
Naa Annual Newspaper Ad Expenditures 09Juan Varela
 
Caída Publicidad EEUU 2009
Caída Publicidad EEUU 2009Caída Publicidad EEUU 2009
Caída Publicidad EEUU 2009Juan Varela
 
The 99% Tax Plan Taxation Schedules
The 99% Tax Plan Taxation SchedulesThe 99% Tax Plan Taxation Schedules
The 99% Tax Plan Taxation Schedulesdarrick72
 
Grendene - 15th Annual Latin America Conference - Citigroup
Grendene - 15th Annual Latin America Conference - CitigroupGrendene - 15th Annual Latin America Conference - Citigroup
Grendene - 15th Annual Latin America Conference - CitigroupGrendene
 
Market Watch - September 2019
Market Watch - September 2019Market Watch - September 2019
Market Watch - September 2019Michelle Makos
 
July 2021 - Market Report
July 2021 - Market Report July 2021 - Market Report
July 2021 - Market Report Michelle Makos
 
2008 Annual Newspaper Ad Expenditures
2008 Annual Newspaper Ad Expenditures2008 Annual Newspaper Ad Expenditures
2008 Annual Newspaper Ad ExpendituresJuan Varela
 
Cushman & Wakefield's Canadian Office Statistical Summary Q4 2018
Cushman & Wakefield's Canadian Office Statistical Summary Q4 2018Cushman & Wakefield's Canadian Office Statistical Summary Q4 2018
Cushman & Wakefield's Canadian Office Statistical Summary Q4 2018Guy Masse
 
Market watch jul 2019 frank yu oakville
Market watch jul 2019 frank yu oakvilleMarket watch jul 2019 frank yu oakville
Market watch jul 2019 frank yu oakvilleFrank Yu
 
Market watch jul 2019 frank yu oakville
Market watch jul 2019 frank yu oakvilleMarket watch jul 2019 frank yu oakville
Market watch jul 2019 frank yu oakvilleFrank Yu
 
TORONTO REAL ESTATE BOARD'S -- MARKET WATCH - JULY 2019
TORONTO REAL ESTATE BOARD'S -- MARKET WATCH - JULY 2019TORONTO REAL ESTATE BOARD'S -- MARKET WATCH - JULY 2019
TORONTO REAL ESTATE BOARD'S -- MARKET WATCH - JULY 2019Shawn Venasse
 
Slide presentation 1 q10
Slide presentation 1 q10Slide presentation 1 q10
Slide presentation 1 q10Cia Hering RI
 
Swifton CFOs LLC - Boston BizSpark presentation - Financial Projections for I...
Swifton CFOs LLC - Boston BizSpark presentation - Financial Projections for I...Swifton CFOs LLC - Boston BizSpark presentation - Financial Projections for I...
Swifton CFOs LLC - Boston BizSpark presentation - Financial Projections for I...David Fogel
 

Similar to Oklahoma Trade through Ports-to-Plains Region – 2004-2010 (19)

Naa Annual Newspaper Ad Expenditures 09
Naa Annual Newspaper Ad Expenditures 09Naa Annual Newspaper Ad Expenditures 09
Naa Annual Newspaper Ad Expenditures 09
 
Caída Publicidad EEUU 2009
Caída Publicidad EEUU 2009Caída Publicidad EEUU 2009
Caída Publicidad EEUU 2009
 
Apimec 2 q05 results
Apimec   2 q05 resultsApimec   2 q05 results
Apimec 2 q05 results
 
The 99% Tax Plan Taxation Schedules
The 99% Tax Plan Taxation SchedulesThe 99% Tax Plan Taxation Schedules
The 99% Tax Plan Taxation Schedules
 
Grendene - 15th Annual Latin America Conference - Citigroup
Grendene - 15th Annual Latin America Conference - CitigroupGrendene - 15th Annual Latin America Conference - Citigroup
Grendene - 15th Annual Latin America Conference - Citigroup
 
Market Watch - September 2019
Market Watch - September 2019Market Watch - September 2019
Market Watch - September 2019
 
July 2021 - Market Report
July 2021 - Market Report July 2021 - Market Report
July 2021 - Market Report
 
Investors' Meeting - 1Q09 Results
Investors' Meeting - 1Q09 ResultsInvestors' Meeting - 1Q09 Results
Investors' Meeting - 1Q09 Results
 
Ohl Apr Eng
Ohl Apr EngOhl Apr Eng
Ohl Apr Eng
 
2008 Annual Newspaper Ad Expenditures
2008 Annual Newspaper Ad Expenditures2008 Annual Newspaper Ad Expenditures
2008 Annual Newspaper Ad Expenditures
 
Cushman & Wakefield's Canadian Office Statistical Summary Q4 2018
Cushman & Wakefield's Canadian Office Statistical Summary Q4 2018Cushman & Wakefield's Canadian Office Statistical Summary Q4 2018
Cushman & Wakefield's Canadian Office Statistical Summary Q4 2018
 
Market watch jul 2019 frank yu oakville
Market watch jul 2019 frank yu oakvilleMarket watch jul 2019 frank yu oakville
Market watch jul 2019 frank yu oakville
 
Market watch jul 2019 frank yu oakville
Market watch jul 2019 frank yu oakvilleMarket watch jul 2019 frank yu oakville
Market watch jul 2019 frank yu oakville
 
TORONTO REAL ESTATE BOARD'S -- MARKET WATCH - JULY 2019
TORONTO REAL ESTATE BOARD'S -- MARKET WATCH - JULY 2019TORONTO REAL ESTATE BOARD'S -- MARKET WATCH - JULY 2019
TORONTO REAL ESTATE BOARD'S -- MARKET WATCH - JULY 2019
 
1 q10
1 q101 q10
1 q10
 
Slide presentation 1 q10
Slide presentation 1 q10Slide presentation 1 q10
Slide presentation 1 q10
 
Houston Market Report February 2010
Houston Market Report February 2010Houston Market Report February 2010
Houston Market Report February 2010
 
Apimec – 3 q07 results
Apimec – 3 q07 resultsApimec – 3 q07 results
Apimec – 3 q07 results
 
Swifton CFOs LLC - Boston BizSpark presentation - Financial Projections for I...
Swifton CFOs LLC - Boston BizSpark presentation - Financial Projections for I...Swifton CFOs LLC - Boston BizSpark presentation - Financial Projections for I...
Swifton CFOs LLC - Boston BizSpark presentation - Financial Projections for I...
 

More from Ports-To-Plains Blog

2013 Ports-to-Plains Alliance Energy Conference Handouts
2013 Ports-to-Plains Alliance Energy Conference Handouts2013 Ports-to-Plains Alliance Energy Conference Handouts
2013 Ports-to-Plains Alliance Energy Conference HandoutsPorts-To-Plains Blog
 
Energy Development Impact on Transportation Infrastructure
Energy Development Impact on Transportation InfrastructureEnergy Development Impact on Transportation Infrastructure
Energy Development Impact on Transportation InfrastructurePorts-To-Plains Blog
 
Wind Energy's Future and the Impact on U.S. Manufacturing
Wind Energy's Future and the Impact on U.S. ManufacturingWind Energy's Future and the Impact on U.S. Manufacturing
Wind Energy's Future and the Impact on U.S. ManufacturingPorts-To-Plains Blog
 
Compressed Air Wind Energy Storage
Compressed Air Wind Energy StorageCompressed Air Wind Energy Storage
Compressed Air Wind Energy StoragePorts-To-Plains Blog
 
Fuels Policy, Ethanol and RFS Reform Political and Policy Implications on Gas...
Fuels Policy, Ethanol and RFS Reform Political and Policy Implications on Gas...Fuels Policy, Ethanol and RFS Reform Political and Policy Implications on Gas...
Fuels Policy, Ethanol and RFS Reform Political and Policy Implications on Gas...Ports-To-Plains Blog
 
Ports-to-Plains Letter Submitted to Department of State
Ports-to-Plains Letter Submitted to Department of StatePorts-to-Plains Letter Submitted to Department of State
Ports-to-Plains Letter Submitted to Department of StatePorts-To-Plains Blog
 
News Release Keystone XL Supporting SEIS Finding 041813
News Release Keystone XL Supporting SEIS Finding 041813News Release Keystone XL Supporting SEIS Finding 041813
News Release Keystone XL Supporting SEIS Finding 041813Ports-To-Plains Blog
 
Ports-to-Plains: The Importance of a Statewide Transportation to Colorado's E...
Ports-to-Plains: The Importance of a Statewide Transportation to Colorado's E...Ports-to-Plains: The Importance of a Statewide Transportation to Colorado's E...
Ports-to-Plains: The Importance of a Statewide Transportation to Colorado's E...Ports-To-Plains Blog
 
2013 Energy Conference Save the Date
2013 Energy Conference Save the Date2013 Energy Conference Save the Date
2013 Energy Conference Save the DatePorts-To-Plains Blog
 
February 2013 Update from the Ports-to-Plains Alliance
February 2013 Update from the Ports-to-Plains AllianceFebruary 2013 Update from the Ports-to-Plains Alliance
February 2013 Update from the Ports-to-Plains AlliancePorts-To-Plains Blog
 
Draft Supplemental EIS for the Keystone XL Project
Draft Supplemental EIS for the Keystone XL ProjectDraft Supplemental EIS for the Keystone XL Project
Draft Supplemental EIS for the Keystone XL ProjectPorts-To-Plains Blog
 
PTP supports Heineman Keystone XL Pipeline Decision
PTP supports Heineman Keystone XL Pipeline DecisionPTP supports Heineman Keystone XL Pipeline Decision
PTP supports Heineman Keystone XL Pipeline DecisionPorts-To-Plains Blog
 
News Release PTP Keystone XL Nebraska
News Release PTP Keystone XL NebraskaNews Release PTP Keystone XL Nebraska
News Release PTP Keystone XL NebraskaPorts-To-Plains Blog
 
Ports-to-Plains Alliance Webinar 113012
Ports-to-Plains Alliance Webinar 113012Ports-to-Plains Alliance Webinar 113012
Ports-to-Plains Alliance Webinar 113012Ports-To-Plains Blog
 
Comments on Interim Guidance on State Freight Plans and State Advisory Commit...
Comments on Interim Guidance on State Freight Plans and State Advisory Commit...Comments on Interim Guidance on State Freight Plans and State Advisory Commit...
Comments on Interim Guidance on State Freight Plans and State Advisory Commit...Ports-To-Plains Blog
 
Interim Guidance on State Freight Plans and State Freight Advisory Committees
Interim Guidance on State Freight Plans and State Freight Advisory CommitteesInterim Guidance on State Freight Plans and State Freight Advisory Committees
Interim Guidance on State Freight Plans and State Freight Advisory CommitteesPorts-To-Plains Blog
 
Ports-to-Plains Alliance Northern Working Group Strategic Plan October 2012
Ports-to-Plains Alliance Northern Working Group Strategic Plan October 2012Ports-to-Plains Alliance Northern Working Group Strategic Plan October 2012
Ports-to-Plains Alliance Northern Working Group Strategic Plan October 2012Ports-To-Plains Blog
 

More from Ports-To-Plains Blog (20)

Canada and U.S. Trade Overview
Canada and U.S. Trade Overview Canada and U.S. Trade Overview
Canada and U.S. Trade Overview
 
2013 Ports-to-Plains Alliance Energy Conference Handouts
2013 Ports-to-Plains Alliance Energy Conference Handouts2013 Ports-to-Plains Alliance Energy Conference Handouts
2013 Ports-to-Plains Alliance Energy Conference Handouts
 
Energy Development Impact on Transportation Infrastructure
Energy Development Impact on Transportation InfrastructureEnergy Development Impact on Transportation Infrastructure
Energy Development Impact on Transportation Infrastructure
 
Wind Energy's Future and the Impact on U.S. Manufacturing
Wind Energy's Future and the Impact on U.S. ManufacturingWind Energy's Future and the Impact on U.S. Manufacturing
Wind Energy's Future and the Impact on U.S. Manufacturing
 
Compressed Air Wind Energy Storage
Compressed Air Wind Energy StorageCompressed Air Wind Energy Storage
Compressed Air Wind Energy Storage
 
Fuels Policy, Ethanol and RFS Reform Political and Policy Implications on Gas...
Fuels Policy, Ethanol and RFS Reform Political and Policy Implications on Gas...Fuels Policy, Ethanol and RFS Reform Political and Policy Implications on Gas...
Fuels Policy, Ethanol and RFS Reform Political and Policy Implications on Gas...
 
Ports-to-Plains Letter Submitted to Department of State
Ports-to-Plains Letter Submitted to Department of StatePorts-to-Plains Letter Submitted to Department of State
Ports-to-Plains Letter Submitted to Department of State
 
News Release Keystone XL Supporting SEIS Finding 041813
News Release Keystone XL Supporting SEIS Finding 041813News Release Keystone XL Supporting SEIS Finding 041813
News Release Keystone XL Supporting SEIS Finding 041813
 
Ports-to-Plains: The Importance of a Statewide Transportation to Colorado's E...
Ports-to-Plains: The Importance of a Statewide Transportation to Colorado's E...Ports-to-Plains: The Importance of a Statewide Transportation to Colorado's E...
Ports-to-Plains: The Importance of a Statewide Transportation to Colorado's E...
 
2013 Energy Conference Save the Date
2013 Energy Conference Save the Date2013 Energy Conference Save the Date
2013 Energy Conference Save the Date
 
February 2013 Update from the Ports-to-Plains Alliance
February 2013 Update from the Ports-to-Plains AllianceFebruary 2013 Update from the Ports-to-Plains Alliance
February 2013 Update from the Ports-to-Plains Alliance
 
Draft Supplemental EIS for the Keystone XL Project
Draft Supplemental EIS for the Keystone XL ProjectDraft Supplemental EIS for the Keystone XL Project
Draft Supplemental EIS for the Keystone XL Project
 
PTP supports Heineman Keystone XL Pipeline Decision
PTP supports Heineman Keystone XL Pipeline DecisionPTP supports Heineman Keystone XL Pipeline Decision
PTP supports Heineman Keystone XL Pipeline Decision
 
Keystone XL Letter Dec 2012 NEDEQ
Keystone XL Letter Dec 2012 NEDEQKeystone XL Letter Dec 2012 NEDEQ
Keystone XL Letter Dec 2012 NEDEQ
 
News Release PTP Keystone XL Nebraska
News Release PTP Keystone XL NebraskaNews Release PTP Keystone XL Nebraska
News Release PTP Keystone XL Nebraska
 
Ports-to-Plains Alliance Webinar 113012
Ports-to-Plains Alliance Webinar 113012Ports-to-Plains Alliance Webinar 113012
Ports-to-Plains Alliance Webinar 113012
 
Comments on Interim Guidance on State Freight Plans and State Advisory Commit...
Comments on Interim Guidance on State Freight Plans and State Advisory Commit...Comments on Interim Guidance on State Freight Plans and State Advisory Commit...
Comments on Interim Guidance on State Freight Plans and State Advisory Commit...
 
Interim Guidance on State Freight Plans and State Freight Advisory Committees
Interim Guidance on State Freight Plans and State Freight Advisory CommitteesInterim Guidance on State Freight Plans and State Freight Advisory Committees
Interim Guidance on State Freight Plans and State Freight Advisory Committees
 
Ports-to-Plains Alliance Northern Working Group Strategic Plan October 2012
Ports-to-Plains Alliance Northern Working Group Strategic Plan October 2012Ports-to-Plains Alliance Northern Working Group Strategic Plan October 2012
Ports-to-Plains Alliance Northern Working Group Strategic Plan October 2012
 
Return to Rural
Return to RuralReturn to Rural
Return to Rural
 

Oklahoma Trade through Ports-to-Plains Region – 2004-2010

  • 1. Oklahoma Trading Relationships -- 2004 - 2010 Mexico Domestic Canada 2009-2010 2009-2010 2004-2010 2004-2010 2004 2005 2006 2007 2008 2009 2010 Difference % Change Difference % Change Mexico Truck Exports $236,570,946 $316,232,785 $400,227,496 $331,674,933 $276,258,074 $435,295,883 $333,888,283 -$101,407,600 -23.3% $97,317,337 41.1% Imports $322,224,222 $398,421,285 $427,476,698 $377,579,436 $470,512,336 $533,742,565 $626,924,202 $93,181,637 17.5% $304,699,980 94.6% Total Truck Trade with Mexico $558,795,168 $714,654,070 $827,704,194 $709,254,369 $746,770,410 $969,038,448 $960,812,485 -$8,225,963 -0.8% $402,017,317 71.9% #DIV/0! Rail Exports $78,868,454 $63,156,699 $65,187,184 $90,195,153 $70,981,147 $60,713,013 $56,920,209 -$3,792,804 -6.2% -$21,948,245 -27.8% Imports $135,330,771 $93,662,207 $55,256,762 $10,726,919 $19,954,604 $6,576,874 $7,526,911 $950,037 14.4% -$127,803,860 -94.4% Total Rail Trade with Mexico $214,199,225 $156,818,906 $120,443,946 $100,922,072 $90,935,751 $67,289,887 $64,447,120 -$2,842,767 -4.2% -$149,752,105 -69.9% #DIV/0! TOTAL Exports $315,439,400 $379,389,484 $465,414,680 $421,870,086 $347,239,221 $496,008,896 $390,808,492 -$105,200,404 -21.2% $75,369,092 23.9% Imports $457,554,993 $492,083,492 $482,733,460 $388,306,355 $490,466,940 $540,319,439 $634,451,113 $94,131,674 17.4% $176,896,120 38.7% Total Trade with Mexico $772,994,393 $871,472,976 $948,148,140 $810,176,441 $837,706,161 $1,036,328,335 $1,025,259,605 -$11,068,730 -1.1% $252,265,212 32.6% Laredo, TX Truck Exports $116,807,936 $186,032,946 $208,293,553 $175,034,694 $205,086,567 $200,406,211 $189,717,203 -$10,689,008 -5.3% $72,909,267 62.4% % of Total Exports to Mexico 49.4% 58.8% 52.0% 52.8% 74.2% 46.0% 56.8% 10.8% 7.4% Imports $205,554,528 $216,040,042 $256,871,264 $211,985,615 $305,186,359 $365,916,767 $381,499,706 $15,582,939 4.3% $175,945,178 85.6% % of Total Imports to Mexico 63.8% 54.2% 60.1% 56.1% 64.9% 68.6% 60.9% -7.7% -2.9% Total Truck Trade Thru Laredo $322,362,464 $402,072,988 $465,164,817 $387,020,309 $510,272,926 $566,322,978 $571,216,909 $4,893,931 0.9% $248,854,445 77.2% % Total Trade with Mexico 57.7% 56.3% 56.2% 54.6% 68.3% 58.4% 59.5% 1.0% 1.8% Rail Exports $54,342,202 $32,398,047 $14,902,186 $19,381,292 $33,012,139 $17,529,695 $26,498,686 $8,968,991 51.2% -$27,843,516 -51.2% % of Total Exports to Mexico 68.9% 51.3% 22.9% 21.5% 46.5% 28.9% 46.6% 17.7% -22.3% Imports $31,237,815 $6,252,218 $6,227,638 $10,567,293 $17,863,063 $6,514,272 $4,101,872 -$2,412,400 -37.0% -$27,135,943 -86.9% % of Total Imports to Mexico 23.1% 6.7% 11.3% 98.5% 89.5% 99.0% 54.5% -44.6% 31.4% Total Rail Trade Thru Laredo $85,580,017 $38,650,265 $21,129,824 $29,948,585 $50,875,202 $24,043,967 $30,600,558 $6,556,591 27.3% -$54,979,459 -64.2% % Total Trade with Mexico 40.0% 24.6% 17.5% 29.7% 55.9% 35.7% 47.5% 11.7% 7.5% TOTAL Exports $171,150,138 $218,430,993 $223,195,739 $194,415,986 $238,098,706 $217,935,906 $216,215,889 -$1,720,017 -0.8% $45,065,751 26.3% % of Total Exports to Mexico 54.3% 57.6% 48.0% 46.1% 68.6% 43.9% 55.3% 11.4% 1.1% Imports $236,792,343 $222,292,260 $263,098,902 $222,552,908 $323,049,422 $372,431,039 $385,601,578 $13,170,539 3.5% $148,809,235 62.8% % of Total Imports to Mexico 51.8% 45.2% 54.5% 57.3% 65.9% 68.9% 60.8% -8.2% 9.0% Total Trade Thru Laredo $407,942,481 $440,723,253 $486,294,641 $416,968,894 $561,148,128 $590,366,945 $601,817,467 $11,450,522 1.9% $193,874,986 47.5% % Total Trade with Mexico 52.8% 50.6% 51.3% 51.5% 67.0% 57.0% 58.7% 1.7% 5.9%
  • 2. Oklahoma Trading Relationships -- 2004 - 2010 Mexico Domestic Canada 2009-2010 2009-2010 2004-2010 2004-2010 2004 2005 2006 2007 2008 2009 2010 Difference % Change Difference % Change Eagle Pass, TX Truck Exports $27,122,866 $41,232,461 $34,388,591 $29,785,964 $23,328,222 $9,859,859 $11,993,678 $2,133,819 21.6% -$15,129,188 -55.8% % of Total Exports to Mexico 11.5% 13.0% 8.6% 9.0% 8.4% 2.3% 3.6% 1.3% -7.9% Imports $15,801,834 $29,208,916 $31,764,574 $21,462,362 $30,377,147 $44,016,986 $88,730,792 $44,713,806 101.6% $72,928,958 461.5% % of Total Imports to Mexico 4.9% 7.3% 7.4% 5.7% 6.5% 8.2% 14.2% 5.9% 9.2% Total Truck Trade Thru Eagle Pass $42,924,700 $70,441,377 $66,153,165 $51,248,326 $53,705,369 $53,876,845 $100,724,470 $46,847,625 87.0% $57,799,770 134.7% % Total Trade with Mexico 7.7% 9.9% 8.0% 7.2% 7.2% 5.6% 10.5% 4.9% 2.8% Rail Exports $5,702,089 $8,192,111 $5,602,025 $13,833,422 $14,307,939 $25,364,842 $18,953,963 -$6,410,879 -25.3% $13,251,874 232.4% % of Total Exports to Mexico 7.2% 13.0% 8.6% 15.3% 20.2% 41.8% 33.3% -8.5% 26.1% Imports $58,587 $118,523 $5,672,305 $0 $1,547,397 $0 $3,422,466 $3,422,466 #DIV/0! $3,363,879 5741.7% % of Total Imports to Mexico 0.0% 0.1% 10.3% 0.0% 7.8% 0.0% 45.5% 45.5% 45.5% Total Rail Trade Thru Eagle Pass $5,760,676 $8,310,634 $11,274,330 $13,833,422 $15,855,336 $25,364,842 $22,376,429 -$2,988,413 -11.8% $16,615,753 288.4% % Total Trade with Mexico 2.7% 5.3% 9.4% 13.7% 17.4% 37.7% 34.7% -3.0% 32.0% TOTAL Exports $32,824,955 $49,424,572 $39,990,616 $43,619,386 $37,636,161 $35,224,701 $30,947,641 -$4,277,060 -12.1% -$1,877,314 -5.7% % of Total Exports to Mexico 10.4% 13.0% 8.6% 10.3% 10.8% 7.1% 7.9% 0.8% -2.5% Imports $15,860,421 $29,327,439 $37,436,879 $21,462,362 $31,924,544 $44,016,986 $92,153,258 $48,136,272 109.4% $76,292,837 481.0% % of Total Imports to Mexico 3.5% 6.0% 7.8% 5.5% 6.5% 8.1% 14.5% 6.4% 11.1% Total Trade Thru Eagle Pass $48,685,376 $78,752,011 $77,427,495 $65,081,748 $69,560,705 $79,241,687 $123,100,899 $43,859,212 55.3% $74,415,523 152.8% % Total Trade with Mexico 6.3% 9.0% 8.2% 8.0% 8.3% 7.6% 12.0% 4.4% 5.7% Del Rio, TX Truck Exports $459,849 $191,147 $307,027 $47,635 $515,036 $117,351 $139,870 $22,519 19.2% -$319,979 -69.6% % of Total Exports to Mexico 0.2% 0.1% 0.1% 0.0% 0.2% 0.0% 0.0% 0.0% -0.2% Imports $93,608 $154,324 $205,454 $11,796 $0 $10,000 $0 -$10,000 -100.0% -$93,608 -100.0% % of Total Imports to Mexico 0.0% 0.0% 0.0% 0.0% 0.0% 0.0% 0.0% 0.0% 0.0% Total Truck Trade Thru Del Rio $553,457 $345,471 $512,481 $59,431 $515,036 $127,351 $139,870 $12,519 9.8% -$413,587 -74.7% % Total Trade with Mexico 0.1% 0.0% 0.1% 0.0% 0.1% 0.0% 0.0% 0.0% -0.1% Rail Exports $0 $0 $0 #DIV/0! $0 #DIV/0! % of Total Exports to Mexico 0.0% 0.0% #DIV/0! #DIV/0! #DIV/0! #DIV/0! #DIV/0! #DIV/0! Imports $0 $0 $0 #DIV/0! $0 #DIV/0! % of Total Imports to Mexico 0.0% 0.0% #DIV/0! #DIV/0! #DIV/0! #DIV/0! #DIV/0! #DIV/0! Total Rail Trade Thru Del Rio $0 $0 $0 #DIV/0! $0 #DIV/0! % Total Trade with Mexico 0.0% 0.0% 0.0% 0.0% 0.0% 0.0% 0.0% 0.0% TOTAL Exports $459,849 $191,147 $307,027 $47,635 $515,036 $117,351 $139,870 $22,519 19.2% -$319,979 -69.6% % of Total Exports to Mexico 0.1% 0.1% 0.1% 0.0% 0.1% 0.0% 0.0% 0.0% -0.1% Imports $93,608 $154,324 $205,454 $11,796 $0 $10,000 $0 -$10,000 -100.0% -$93,608 -100.0% % of Total Imports to Mexico 0.0% 0.0% 0.0% 0.0% 0.0% 0.0% 0.0% 0.0% 0.0% Total Trade Thru Del Rio $553,457 $345,471 $512,481 $59,431 $515,036 $127,351 $139,870 $12,519 9.8% -$413,587 -74.7% % Total Trade with Mexico 0.1% 0.0% 0.1% 0.0% 0.1% 0.0% 0.0% 0.0% -0.1%
  • 3. Oklahoma Trading Relationships -- 2004 - 2010 Mexico Domestic Canada 2009-2010 2009-2010 2004-2010 2004-2010 2004 2005 2006 2007 2008 2009 2010 Difference % Change Difference % Change GPITC Truck Exports $144,390,651 $227,456,554 $242,989,171 $204,868,293 $228,929,825 $210,383,421 $201,850,751 -$8,532,670 -4.1% $57,460,100 39.8% % of Total Exports to Mexico 61.0% 71.9% 60.7% 61.8% 82.9% 48.3% 60.5% 12.1% -0.6% Imports $221,449,970 $245,403,282 $288,841,292 $233,459,773 $335,563,506 $409,943,753 $470,230,498 $60,286,745 14.7% $248,780,528 112.3% % of Total Imports to Mexico 68.7% 61.6% 67.6% 61.8% 71.3% 76.8% 75.0% -1.8% 6.3% Total Truck Trade Thru GPITC $365,840,621 $472,859,836 $531,830,463 $438,328,066 $564,493,331 $620,327,174 $672,081,249 $51,754,075 8.3% $306,240,628 83.7% % Total Trade with Mexico 65.5% 66.2% 64.3% 61.8% 75.6% 64.0% 69.9% 5.9% 4.5% Rail Exports $60,044,291 $40,590,158 $20,504,211 $33,214,714 $47,320,078 $42,894,537 $45,452,649 $2,558,112 6.0% -$14,591,642 -24.3% % of Total Exports to Mexico 76.1% 64.3% 31.5% 36.8% 66.7% 70.7% 79.9% 9.2% 3.7% Imports $31,296,402 $6,370,741 $11,899,943 $10,567,293 $19,410,460 $6,514,272 $7,524,338 $1,010,066 15.5% -$23,772,064 -76.0% % of Total Imports to Mexico 23.1% 6.8% 21.5% 98.5% 97.3% 99.0% 100.0% 0.9% 76.8% Total Rail Trade Thru GPITC $91,340,693 $46,960,899 $32,404,154 $43,782,007 $66,730,538 $49,408,809 $52,976,987 $3,568,178 7.2% -$38,363,706 -42.0% % Total Trade with Mexico 42.6% 29.9% 26.9% 43.4% 73.4% 73.4% 82.2% 8.8% 39.6% TOTAL Exports $204,434,942 $268,046,712 $263,493,382 $238,083,007 $276,249,903 $253,277,958 $247,303,400 -$5,974,558 -2.4% $42,868,458 21.0% % of Total Exports to Mexico 64.8% 70.7% 56.6% 56.4% 79.6% 51.1% 63.3% 12.2% -1.5% Imports $252,746,372 $251,774,023 $300,741,235 $244,027,066 $354,973,966 $416,458,025 $477,754,836 $61,296,811 14.7% $225,008,464 89.0% % of Total Imports to Mexico 55.2% 51.2% 62.3% 62.8% 72.4% 77.1% 75.3% -1.8% 20.1% Total Trade Thru GPITC $457,181,314 $519,820,735 $564,234,617 $482,110,073 $631,223,869 $669,735,983 $725,058,236 $55,322,253 8.3% $267,876,922 58.6% % Total Trade with Mexico 59.1% 59.6% 59.5% 59.5% 75.4% 64.6% 70.7% 6.1% 11.6%
  • 4. Oklahoma Trading Relationships -- 2004 - 2010 Mexico Domestic Canada 2010 Leading Exports from Oklahoma to Mexico (Surface 2010 2010 Leading Exports from Oklahoma to Mexico (Surface 2010 Transportation) Transportation) Rank Export Rank Coahuila Export 1 84 Computer-Related Machinery and Parts $88,607,696 1 2 Meat and Edible Offal $27,856,202 2 2 Meat and Edible Offal $56,460,263 2 84 Computer-Related Machinery and Parts $1,270,217 3 23 Food Residues and Waste $37,067,950 3 34 Soap and Organic Surface-Active Agents $371,123 4 87 Vehicles Other than Railway $36,584,184 4 39 Plastics and Articles $353,263 5 85 Electrical Machinery; Equipment and Parts $23,051,024 5 25 Salt; Sulfur; Plaster and Cement $345,785 6 38 Miscellaneous Chemical Products $18,843,333 6 68 Stone; Plaster; Cement and Asbestos $291,394 7 90 Measuring and Testing Instruments $16,865,616 7 72 Iron and Steel $232,844 8 39 Plastics and Articles $13,693,873 8 27 Mineral Fuels; Oils and Waxes $191,968 9 73 Articles of Iron and Steel $13,319,059 9 73 Articles of Iron and Steel $180,262 10 70 Glass $10,943,488 10 85 Electrical Machinery; Equipment and Parts $149,935 2010 Leading Imports to Oklahoma from Mexico (Surface 2010 2010 Leading Exports from Oklahoma from Mexico (Surface 2010 Rank Import Rank Nuevo Leon Export 1 85 Electrical Machinery; Equipment and Parts $194,253,634 1 85 Electrical Machinery; Equipment and Parts $10,778,375 2 87 Vehicles Other than Railway $168,699,377 2 70 Glass $10,306,691 3 90 Measuring and Testing Instruments $86,018,125 3 84 Computer-Related Machinery and Parts $9,016,847 4 84 Computer-Related Machinery and Parts $50,530,163 4 74 Copper and Articles $6,647,324 5 73 Articles of Iron and Steel $36,299,031 5 27 Mineral Fuels; Oils and Waxes $3,962,425 6 62 Not Knitted or Crocheted Apparel $15,559,059 6 73 Articles of Iron and Steel $2,819,262 7 39 Plastics and Articles $14,655,448 7 39 Plastics and Articles $2,465,039 8 72 Iron and Steel $11,561,354 8 87 Vehicles Other than Railway $2,104,306 9 98 Special Classification Provisions $10,083,625 9 2 Meat and Edible Offal $1,971,323 10 48 Paper and Paperboard $8,287,850 10 12 Oil Seeds and Oleaginous Fruits $1,869,550 2010 Leading Exports from Oklahoma from Mexico (Surface 2010 Rank Tamaulipas Export 1 84 Computer-Related Machinery and Parts $5,151,043 2 85 Electrical Machinery; Equipment and Parts $1,053,123 3 34 Soap and Organic Surface-Active Agents $603,629 4 72 Iron and Steel $452,418 5 87 Vehicles Other than Railway $437,277 6 1 Live Animals $387,025 7 39 Plastics and Articles $292,684 8 27 Mineral Fuels; Oils and Waxes $271,003 9 32 Tanning or Dyeing Extracts $195,196 10 38 Miscellaneous Chemical Products $185,217
  • 5. Oklahoma Trading Relationships -- 2004 - 2010 Mexico Domestic Canada Rail Truck Domestic -- Rail Change Truck Change 2002 Domestic -- 2007 Change Change 2015 2002-2015 2002-2015 Exports Rail Truck Exports Rail Truck Exports Rail Truck Colorado 0 675 7% Colorado 73 881 5% 0% 31% Colorado 76 974 5% #DIV/0! 44% Montana 0 270 3% Montana 513 2% #DIV/0! 90% Montana 6 192 1% #DIV/0! -29% Nebraska 49 181 2% Nebraska 294 433 3% 500% 139% Nebraska 269 549 4% 449% 203% New Mexico 0 313 3% New Mexico 484 2% #DIV/0! 55% New Mexico 60 548 3% #DIV/0! 75% North Dakota 24 91 1% North Dakota 184 1% -100% 102% North Dakota 0 90 0% -98% -1% Oklahoma Oklahoma Oklahoma South Dakota 0 26 0% South Dakota 86 0% #DIV/0! 231% South Dakota 12 104 0% #DIV/0! 299% Texas 489 7,137 82% Texas 17,461 84% -100% 145% Texas 1,034 18,505 84% 111% 159% Wyoming 16 0 0% Wyoming 473 2% -100% #DIV/0! Wyoming 178 619 3% 1013% #DIV/0! Total ($m) 578 8,693 Total ($m) 367 20,515 100% -37% 136% Total ($m) 1,636 21,581 100% 183% 148% 9,271 20,882 125% 23,217 150% Imports Rail Truck Imports Rail Truck Imports Rail Truck Colorado 0 240 2% Colorado 0 420 3% #DIV/0! 75% Colorado 64 416 3% #DIV/0! 73% Montana 15 4 0% Montana 0% -100% -100% Montana 32 10 0% 115% 142% Nebraska 0 464 4% Nebraska 417 3% #DIV/0! -10% Nebraska 140 451 3% #DIV/0! -3% New Mexico 0 15 0% New Mexico 7 65 0% #DIV/0! 333% New Mexico 8 95 1% #DIV/0! 534% North Dakota 0 59 1% North Dakota 0% #DIV/0! -100% North Dakota 4 74 0% #DIV/0! 26% Oklahoma Oklahoma Oklahoma 0 South Dakota 0 55 1% South Dakota 128 1% #DIV/0! 133% South Dakota 2 142 1% #DIV/0! 158% Texas 290 9,209 90% Texas 14,12292% -100% 53% Texas 416 16,688 91% 43% 81% Wyoming 148 0 1% Wyoming 261 2% 76% #DIV/0! Wyoming 240 44 2% 62% #DIV/0! Total ($m) 453 10,046 Total ($m) 268 15,152 100% -41% 51% Total ($m) 905 17,920 100% 100% 78% 10,499 15,420 47% 18,824 79% TOTALS Rail Truck TOTALS Rail Truck TOTALS Rail Truck Colorado 0 915 5% Colorado 73 1,301 4% #DIV/0! 42% Colorado 140 1,390 4% #DIV/0! 52% Montana 15 274 1% Montana 0 513 1% -100% 87% Montana 38 202 1% 155% -26% Nebraska 49 645 4% Nebraska 294 850 3% 500% 32% Nebraska 409 1,000 3% 735% 55% New Mexico 0 328 2% New Mexico 7 549 2% #DIV/0! 67% New Mexico 68 643 2% #DIV/0! 96% North Dakota 24 150 1% North Dakota 0 184 1% -100% 23% North Dakota 4 165 0% -83% 10% Oklahoma Oklahoma Oklahoma 0 South Dakota 0 81 0% South Dakota 0 214 1% #DIV/0! 164% South Dakota 14 246 1% #DIV/0! 203% Texas 779 16,346 87% Texas 0 31,583 87% -100% 93% Texas 1,450 35,193 87% 86% 115% Wyoming 164 0 1% Wyoming 261 473 2% 59% #DIV/0! Wyoming 418 663 3% 155% #DIV/0! Total ($m) 1,031 18,739 Total ($m) 635 35,667 100% -38% 90% Total ($m) 2,540 39,501 100% #DIV/0! 111% 19,770 36,302 84% 42,041 113%
  • 6. Oklahoma Trading Relationships -- 2004 - 2010 Mexico Domestic Canada 2009-2010 2009-2010 2004-2010 2004-2010 2004 2005 2006 2007 2008 2009 2010 Difference % Change Difference % Change Canada Truck Exports $897,832,410.00 $1,205,945,658 $1,421,518,002 $1,300,960,636 $1,449,512,286 $1,160,092,869 $1,572,852,931 $412,760,062 35.6% $675,020,521 75.2% Imports $733,180,354.00 $781,187,475 $853,086,590 $843,419,652 $980,341,366 $680,921,040 $714,523,411 $33,602,371 4.9% -$18,656,943 -2.5% Total Truck Trade with Canada $1,631,012,764.00 $1,987,133,133 $2,274,604,592 $2,144,380,288 $2,429,853,652 $1,841,013,909 $2,287,376,342 $446,362,433 24.2% $656,363,578 40.2% #DIV/0! Rail Exports $176,562,662.00 $286,195,385 $150,653,803 $81,641,142 $110,008,733 $75,769,940 $87,608,347 $11,838,407 15.6% -$88,954,315 -50.4% Imports $264,650,856.00 $645,932,049 $376,460,879 $251,067,859 $295,299,620 $168,914,816 $258,331,246 $89,416,430 52.9% -$6,319,610 -2.4% Total Rail Trade with Canada $441,213,518.00 $932,127,434 $527,114,682 $332,709,001 $405,308,353 $244,684,756 $345,939,593 $101,254,837 41.4% -$95,273,925 -21.6% #DIV/0! TOTAL Exports $1,074,395,072.00 $1,492,141,043 $1,572,171,805 $1,382,601,778 $1,559,521,019 $1,235,862,809 $1,660,461,278 $424,598,469 34.4% $586,066,206 54.5% Imports $997,831,210.00 $1,427,119,524 $1,229,547,469 $1,094,487,511 $1,275,640,986 $849,835,856 $972,854,657 $123,018,801 14.5% -$24,976,553 -2.5% Total Trade with Canada $2,072,226,282.00 $2,919,260,567 $2,801,719,274 $2,477,089,289 $2,835,162,005 $2,085,698,665 $2,633,315,935 $547,617,270 26.3% $561,089,653 27.1% Raymond, MT Truck Exports $71,674 $79,225 $1,543,246 $930,429 $1,623,588 $1,850,765 $15,287,650 $13,436,885 726.0% $15,215,976 21229.4% % of Total Exports to Canada 0.0% 0.0% 0.1% 0.1% 0.1% 0.2% 1.0% 0.8% 1.0% Imports $709,775 $552,926 $175,251 $1,584,247 $416,183 $246,412 $4,680,523 $4,434,111 1799.5% $3,970,748 559.4% % of Total Imports to Canada 0.1% 0.1% 0.0% 0.2% 0.0% 0.0% 0.7% 0.6% 0.6% Total Truck Trade Thru Raymond $781,449 $632,151 $1,718,497 $2,514,676 $2,039,771 $2,097,177 $19,968,173 $17,870,996 852.1% $19,186,724 2455.3% % Total Trade with Canada 0.0% 0.0% 0.1% 0.1% 0.1% 0.1% 0.9% 0.8% 0.8% Rail Exports $0 $0 $0 #DIV/0! $0 #DIV/0! % of Total Exports to Canada 0.0% 0.0% 0.0% 0.0% 0.0% 0.0% 0.0% 0.0% 0.0% Imports $0 $0 $0 #DIV/0! $0 #DIV/0! % of Total Imports to Canada 0.0% 0.0% 0.0% 0.0% 0.0% 0.0% 0.0% 0.0% 0.0% Total Truck Trade Thru Raymond $0 $0 $0 $0 $0 $0 $0 #DIV/0! $0 #DIV/0! % Total Trade with Canada 0.0% 0.0% 0.0% 0.0% 0.0% 0.0% 0.0% 0.0% 0.0% TOTAL Exports $71,674 $79,225 $1,543,246 $930,429 $1,623,588 $1,850,765 $15,287,650 $13,436,885 726.0% $15,215,976 21229.4% % of Total Exports to Canada 0.0% 0.0% 0.1% 0.1% 0.1% 0.1% 0.9% 0.8% 0.9% Imports $709,775 $552,926 $175,251 $1,584,247 $416,183 $246,412 $4,680,523 $4,434,111 1799.5% $3,970,748 559.4% % of Total Imports to Canada 0.1% 0.0% 0.0% 0.1% 0.0% 0.0% 0.5% 0.5% 0.4% Total Trade Thru Raymond $781,449 $632,151 $1,718,497 $2,514,676 $2,039,771 $2,097,177 $19,968,173 $17,870,996 852.1% $19,186,724 2455.3% % Total Trade with Canada 0.0% 0.0% 0.1% 0.1% 0.1% 0.1% 0.8% 0.7% 0.7%
  • 7. Oklahoma Trading Relationships -- 2004 - 2010 Mexico Domestic Canada 2009-2010 2009-2010 2004-2010 2004-2010 2004 2005 2006 2007 2008 2009 2010 Difference % Change Difference % Change Sweet Grass, MT Truck Exports $233,546,574 $350,672,951 $433,603,461 $304,070,201 $373,200,765 $237,283,910 $360,064,256 $122,780,346 51.7% $126,517,682 54.2% % of Total Exports to Canada 26.0% 29.1% 30.5% 23.4% 25.7% 20.5% 22.9% 2.4% -3.1% Imports $73,164,225 $118,681,783 $158,681,183 $186,222,515 $228,772,939 $109,149,429 $133,333,395 $24,183,966 22.2% $60,169,170 82.2% % of Total Exports to Canada 10.0% 15.2% 18.6% 22.1% 23.3% 16.0% 18.7% 2.6% 8.7% Total Truck Trade Thru Sweet Grass 306710799 $469,354,734 $592,284,644 $490,292,716 $601,973,704 $346,433,339 $493,397,651 $146,964,312 42.4% $186,686,852 60.9% % Total Trade with Canada 18.8% 23.6% 26.0% 22.9% 24.8% 18.8% 21.6% 2.8% 2.8% Rail Exports $1,697,666 $2,420,158 $13,537,642 $7,901,656 $19,487,718 $3,092,198 $4,403,609 $1,311,411 42.4% $2,705,943 159.4% % of Total Exports to Canada 1.0% 0.8% 9.0% 9.7% 17.7% 4.1% 5.0% 0.9% 4.1% Imports $10,013,234 $15,226,946 $20,684,475 $32,818,594 $46,791,742 $11,907,943 $24,202,498 $12,294,555 103.2% $14,189,264 141.7% % of Total Exports to Canada 3.8% 2.4% 5.5% 13.1% 15.8% 7.0% 9.4% 2.3% 5.6% Total Rail Trade Thru Sweet Grass $11,710,900 $17,647,104 $34,222,117 $40,720,250 $66,279,460 $15,000,141 $28,606,107 $13,605,966 90.7% $16,895,207 144.3% % Total Trade with Canada 2.7% 1.9% 6.5% 12.2% 16.4% 6.1% 8.3% 2.1% 5.6% TOTAL Exports $235,244,240 $353,093,109 $447,141,103 $311,971,857 $392,688,483 $240,376,108 $364,467,865 $124,091,757 51.6% $129,223,625 54.9% % of Total Exports to Canada 21.9% 23.7% 28.4% 22.6% 25.2% 19.5% 21.9% 2.5% 0.1% Imports $83,177,459 $133,908,729 $179,365,658 $219,041,109 $275,564,681 $121,057,372 $157,535,893 $36,478,521 30.1% $74,358,434 89.4% % of Total Imports to Canada 8.3% 9.4% 14.6% 20.0% 21.6% 14.2% 16.2% 1.9% 7.9% Total Trade Thru Sweet Grass $318,421,699 $487,001,838 $626,506,761 $531,012,966 $668,253,164 $361,433,480 $522,003,758 $160,570,278 44.4% $203,582,059 63.9% % Total Trade with Canada 15.4% 16.7% 22.4% 21.4% 23.6% 17.3% 19.8% 2.5% 4.5% Portal, ND Truck Exports $61,712,804 $120,688,417 $153,643,699 $130,265,014 $176,868,686 $121,815,103 $196,178,597 $74,363,494 61.0% $134,465,793 217.9% % of Total Exports to Canada 6.9% 10.0% 10.8% 10.0% 12.2% 10.5% 12.5% 2.0% 5.6% Imports $21,238,017 $20,205,458 $30,587,116 $34,939,031 $35,511,135 $26,902,480 $43,951,411 $17,048,931 63.4% $22,713,394 106.9% % of Total Imports to Canada 2.9% 2.6% 3.6% 4.1% 3.6% 4.0% 6.2% 2.2% 3.3% Total Truck Trade Thru Portal $82,950,821 $140,893,875 $184,230,815 $165,204,045 $212,379,821 $148,717,583 $240,130,008 $91,412,425 61.5% $157,179,187 189.5% % Total Trade with Canada 5.1% 7.1% 8.1% 7.7% 8.7% 8.1% 10.5% 2.4% 5.4% Rail Exports $3,933,566 $12,778,589 $13,326,530 $7,924,672 $36,174,371 $15,260,903 $31,222,231 $17,895,701 104.6% $27,288,665 693.7% % of Total Exports to Canada 2.2% 4.5% 8.8% 9.7% 32.9% 20.1% 35.6% 15.5% 33.4% Imports $15,070,036 $33,408,555 $41,351,266 $47,070,699 $48,365,649 $48,117,553 $94,083,875 $52,732,609 95.5% $79,013,839 524.3% % of Total Imports to Canada 5.7% 5.2% 11.0% 18.7% 16.4% 28.5% 36.4% 7.9% 30.7% Total Rail Trade Thru Portal $19,003,602 $46,187,144 $54,677,796 $54,995,371 $84,540,020 $63,378,456 $125,306,106 $70,628,310 97.7% $106,302,504 559.4% % Total Trade with Canada 4.3% 5.0% 10.4% 16.5% 20.9% 25.9% 36.2% 10.3% 31.9% TOTAL Exports $65,646,370 $133,467,006 $153,643,699 $130,265,014 $176,868,686 $121,815,103 $196,178,597 $74,363,494 61.0% $161,754,458 198.8% % of Total Exports to Canada 6.1% 8.9% 9.8% 9.4% 11.3% 9.9% 11.8% 2.0% 5.7% Imports $36,308,053 $53,614,013 $71,938,382 $82,009,730 $83,876,784 $75,020,033 $138,035,286 $63,015,253 84.0% $101,727,233 280.2% % of Total Imports to Canada 3.6% 3.8% 7.2% 7.5% 6.6% 8.8% 14.2% 5.4% 10.5% Total Trade Thru Portal $101,954,423 $187,081,019 $225,582,081 $212,274,744 $260,745,470 $196,835,136 $334,213,883 $137,378,747 69.8% $263,481,691 227.8% % Total Trade with Canada 4.9% 6.4% 8.1% 8.6% 9.2% 9.4% 12.7% 3.3% 7.8%
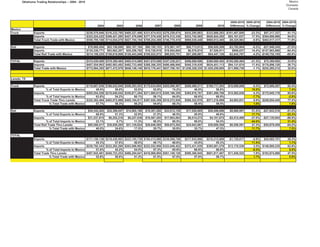
  • 8. Oklahoma Trading Relationships -- 2004 - 2010 Mexico Domestic Canada 2009-2010 2009-2010 2004-2010 2004-2010 2004 2005 2006 2007 2008 2009 2010 Difference % Change Difference % Change Wild Horse 0 Truck Exports $0 $0 $0 $0 $0 $0 $0 $0 #DIV/0! $0 #DIV/0! % of Total Exports to Canada 0.0% 0.0% 0.0% 0.0% 0.0% 0.0% 0.0% 0.0% 0.0% Imports $13,930 $0 $0 $36,325 $7,000 $7,670 $0 -$7,670 -100.0% -$13,930 -100.0% % of Total Imports to Canada 0.0% 0.0% 0.0% 0.0% 0.0% 0.0% 0.0% 0.0% 0.0% Total Truck Trade Thru GPITC $13,930 $0 $0 $36,325 $7,000 $7,670 $0 -$7,670 -100.0% -$13,930 -100.0% % Total Trade with Canada 0.0% 0.0% 0.0% 0.0% 0.0% 0.0% 0.0% 0.0% 0.0% Rail Exports $0 $0 $0 $0 $0 $0 $0 $0 #DIV/0! $0 #DIV/0! % of Total Exports to Canada 0.0% 0.0% 0.0% 0.0% 0.0% 0.0% 0.0% 0.0% 0.0% Imports $0 $0 $0 $0 $0 $0 $0 $0 #DIV/0! $0 #DIV/0! % of Total Imports to Canada 0.0% 0.0% 0.0% 0.0% 0.0% 0.0% 0.0% 0.0% 0.0% Total Rail Trade Thru GPITC $0 $0 $0 $0 $0 $0 $0 $0 #DIV/0! $0 #DIV/0! % Total Trade with Canada 0.0% 0.0% 0.0% 0.0% 0.0% 0.0% 0.0% 0.0% 0.0% TOTAL Exports $0 $0 $0 $0 $0 $0 $0 $0 #DIV/0! $0 #DIV/0! % of Total Exports to Canada 0.0% 0.0% 0.0% 0.0% 0.0% 0.0% 0.0% 0.0% 0.0% Imports $13,930 $0 $0 $36,325 $7,000 $7,670 $0 -$7,670 -100.0% -$13,930 -100.0% % of Total Imports to Canada 0.0% 0.0% 0.0% 0.0% 0.0% 0.0% 0.0% 0.0% 0.0% Total Trade Thru GPITC $13,930 $0 $0 $36,325 $7,000 $7,670 $0 -$7,670 -100.0% -$13,930 -100.0% % Total Trade with Canada 0.0% 0.0% 0.0% 0.0% 0.0% 0.0% 0.0% 0.0% 0.0% GPITC #DIV/0! Truck Exports $295,331,052 $471,440,593 $588,790,406 $435,265,644 $551,693,039 $360,949,778 $571,530,503 $210,580,725 58.3% $276,199,451 93.5% % of Total Exports to Canada 32.9% 39.1% 41.4% 33.5% 38.1% 31.1% 36.3% 5.2% 3.4% Imports $94,487,846 $138,966,466 $190,811,545 $222,128,300 $265,914,662 $137,910,344 $192,572,456 $54,662,112 39.6% $98,084,610 103.8% % of Total Imports to Canada 12.9% 17.8% 22.4% 26.3% 27.1% 20.3% 27.0% 6.7% 14.1% Total Truck Trade Thru GPITC $389,818,898 $610,407,059 $779,601,951 $657,393,944 $817,607,701 $498,860,122 $764,102,959 $265,242,837 53.2% $374,284,061 96.0% % Total Trade with Canada 23.9% 30.7% 34.3% 30.7% 33.6% 27.1% 33.4% 6.3% 9.5% Rail Exports $5,631,232 $15,198,747 $26,864,172 $15,826,328 $55,662,089 $18,353,101 $35,625,840 $17,272,739 94.1% $29,994,608 532.6% % of Total Exports to Canada 0.6% 1.3% 1.9% 1.2% 3.8% 1.6% 2.3% 0.7% 1.6% Imports $25,083,270 $48,635,501 $62,035,741 $79,889,293 $95,157,391 $60,025,496 $118,286,373 $58,260,877 97.1% $93,203,103 371.6% % of Total Imports to Canada 3.4% 6.2% 7.3% 9.5% 9.7% 8.8% 16.6% 7.7% 13.1% Total Rail Trade Thru GPITC $30,714,502 $63,834,248 $88,899,913 $95,715,621 $150,819,480 $78,378,597 $153,912,213 $75,533,616 96.4% $123,197,711 401.1% % Total Trade with Canada 1.9% 3.2% 3.9% 4.5% 6.2% 4.3% 6.7% 2.5% 4.8% TOTAL Exports $300,962,284 $486,639,340 $615,654,578 $451,091,972 $607,355,128 $379,302,879 $607,156,343 $227,853,464 60.1% $306,194,059 101.7% % of Total Exports to Canada 28.0% 32.6% 39.2% 32.6% 0.389449787 30.7% 36.6% 5.9% 8.6% Imports $119,571,116 $187,601,967 $252,847,286 $302,017,593 $361,072,053 $197,935,840 $310,858,829 $112,922,989 57.1% $191,287,713 160.0% % of Total Imports to Canada 12.0% 13.1% 20.6% 27.6% 0.283051467 23.3% 32.0% 8.7% 20.0% Total Trade Thru GPITC $420,533,400 $674,241,307 $868,501,864 $753,109,565 $968,427,181 $577,238,719 $918,015,172 $340,776,453 59.0% $497,481,772 118.3% % Total Trade with Canada 20.3% 23.1% 31.0% 30.4% 0.34157737 27.7% 34.9% 7.2% 14.6%
  • 9. Oklahoma Trading Relationships -- 2004 - 2010 Mexico Domestic Canada 2010 Leading Exports from Oklahoma to Canada (Surface 2010 2010 Leading Exports from Oklahoma to Canada (Surface 2010 Transportation) Transportation) Rank Export Rank Alberta Export 1 84 Computer-Related Machinery and Parts $493,462,513 1 84 Computer-Related Machinery and Parts $196,677,438 2 27 Mineral Fuels; Oils and Waxes $236,666,575 2 73 Articles of Iron and Steel $48,254,332 3 40 Rubber and Articles $192,929,008 3 82 Tools of Base Metal $35,877,311 4 73 Articles of Iron and Steel $189,658,903 4 85 Electrical Machinery; Equipment and Parts $33,672,394 5 85 Electrical Machinery; Equipment and Parts $134,268,799 5 87 Vehicles Other than Railway $20,809,166 6 87 Vehicles Other than Railway $124,399,763 6 90 Measuring and Testing Instruments $13,612,207 7 39 Plastics and Articles $82,053,333 7 39 Plastics and Articles $6,682,627 8 82 Tools of Base Metal $43,814,782 8 38 Miscellaneous Chemical Products $5,543,263 9 16 Preparations of Fish and Meat $35,518,672 9 16 Preparations of Fish and Meat $5,411,439 10 88 Aircraft; Spacecraft and Parts $34,620,197 10 40 Rubber and Articles $4,733,237 2010 Leading Imports to Oklahoma from Canada (Surface 2010 2010 Leading Exports from Oklahoma to Canada (Surface 2010 Rank Export Rank British Colombia Export 1 27 Mineral Fuels; Oils and Waxes $461,070,539 1 84 Computer-Related Machinery and Parts $18,973,357 2 84 Computer-Related Machinery and Parts $305,062,801 2 73 Articles of Iron and Steel $13,304,994 3 39 Plastics and Articles $96,604,706 3 87 Vehicles Other than Railway $5,369,960 4 73 Articles of Iron and Steel $80,896,123 4 35 Albuminoidal Substances; Glues and Enzymes $2,909,549 5 98 Special Classification Provisions $77,907,931 5 85 Electrical Machinery; Equipment and Parts $2,196,212 6 47 Pulp of Wood and Paperboard $55,987,889 6 18 Cocoa and Cocoa Preparations $1,860,676 7 85 Electrical Machinery; Equipment and Parts $49,863,566 7 39 Plastics and Articles $1,852,515 8 48 Paper and Paperboard $37,385,169 8 90 Measuring and Testing Instruments $1,578,047 9 2 Meat and Edible Offal $29,382,462 9 82 Tools of Base Metal $1,440,304 10 90 Measuring and Testing Instruments $28,576,506 10 16 Preparations of Fish and Meat $960,585 2010 Leading Exports from Oklahoma to Canada (Surface 2010 Rank Saskatchewan Export 1 84 Computer-Related Machinery and Parts $94,052,110 2 27 Mineral Fuels; Oils and Waxes $53,987,367 3 73 Articles of Iron and Steel $43,696,547 4 87 Vehicles Other than Railway $17,146,264 5 85 Electrical Machinery; Equipment and Parts $4,938,418 6 39 Plastics and Articles $3,180,389 7 38 Miscellaneous Chemical Products $3,124,209 8 90 Measuring and Testing Instruments $1,824,973 9 40 Rubber and Articles $1,556,639 10 16 Preparations of Fish and Meat $620,084