SlideShare a Scribd company logo
1 of 2
Download to read offline
Market Share Totals                                                                             Prudential Fox & Roach


MLS: TReND        Date: 10/01/2008 - 09/30/2009    Type: Broker          Status: Sold            Price: All                             Construction Type: All             Bedrooms: All      Bathrooms: All
Property Types:   Residential: (Single Family, Twin/Semi-Detached, Unit/Flat, Row/Townhouse/Cluster, Mobile, Other)
Counties:         Montgomery


BrokerMetrics®                                                                                          1 of 2                                                                                         10/01/09
                                            Information not guaranteed. © 2009-2010 Terradatum and its suppliers and licensors (http://www.terradatum.com/metrics/licensors).
Market Share Totals                                                                           Prudential Fox & Roach
                                                                                        Total $ Volume

                                                                                                                                                                                 Prod       Prod
                                                                                                                                             Market              Avg           Agents     Agents
    #                Name                List #             List $        Sell #             Sell $       Total #             Total $       Share %             Price    DOM   (Total)   (Search)      Ofcs
    1 Prudential Fox & Roach             1,169       510,988,840          1,159       483,590,168          2,328        994,579,008             23.65        427,225      89    1,643        744         34
    2 Long And Foster                      331       119,087,163            359       114,456,290            690        233,543,453              5.55        338,469      86      612        316         18
    3 Keller Williams Real Estate          320        99,770,993            345       107,070,376            665        206,841,369              4.92        311,040      73      141        102          2
    4 Weichert Realtors                    315        94,426,905            391       110,860,065            706        205,286,970              4.88        290,775      82      470        258         19
    5 Century 21 Alliance                  322        84,920,490            337        87,046,281            659        171,966,771              4.09        260,951      81      499        194         16
    6 Coldwell Banker Preferred            293        93,609,950            243        78,259,256            536        171,869,206              4.09        320,652      86      300        137          7
    7 RE/MAX Action Realty                 284        83,058,525            247        72,914,312            531        155,972,837              3.71        293,734      71      108        110          2
    8 RE/MAX Services                      172        47,799,950            145        39,307,063            317         87,107,013              2.07        274,786      78       60         53          1
    9 RE/MAX 440                           150        35,101,777            149        34,909,594            299         70,011,371              1.66        234,152      94       99         82          7
   10 Keller Williams Realty Group         204        41,553,503            125        25,085,859            329         66,639,362              1.58        202,551      85       95         64          2


Subtotals/Averages                       3,560     1,210,318,096          3,500     1,153,499,264          7,060      2,363,817,360             56.20        334,818      84    4,027      2,060        108

MLS Totals/Averages                      7,005     2,102,842,372          7,005     2,102,842,372         14,010      4,205,684,744            100.00        300,192      83    9,641      4,356        678


BrokerMetrics®                                                                                   2 of 2                                                                                             10/01/09
                                     Information not guaranteed. © 2009-2010 Terradatum and its suppliers and licensors (http://www.terradatum.com/metrics/licensors).

More Related Content

What's hot

What's hot (15)

2010 February Chester County Market Share
2010 February Chester County Market Share2010 February Chester County Market Share
2010 February Chester County Market Share
 
Bucks County Market Share
Bucks County Market ShareBucks County Market Share
Bucks County Market Share
 
May 2010 Montgomery County Market Share
May 2010 Montgomery County Market ShareMay 2010 Montgomery County Market Share
May 2010 Montgomery County Market Share
 
2010 February Delaware County Market Share
2010 February Delaware County Market Share2010 February Delaware County Market Share
2010 February Delaware County Market Share
 
Chester County Market Share
Chester County Market ShareChester County Market Share
Chester County Market Share
 
December 2009 Montgomery County Market Share
December 2009 Montgomery County Market ShareDecember 2009 Montgomery County Market Share
December 2009 Montgomery County Market Share
 
July 2009 Chester County Market Share
July 2009 Chester County Market ShareJuly 2009 Chester County Market Share
July 2009 Chester County Market Share
 
July 2009 Bucks County Market Share
July 2009 Bucks County Market ShareJuly 2009 Bucks County Market Share
July 2009 Bucks County Market Share
 
2010 Delaware County Market Share
2010 Delaware County Market Share2010 Delaware County Market Share
2010 Delaware County Market Share
 
June 2010 Chester County Market Share
June 2010 Chester County Market ShareJune 2010 Chester County Market Share
June 2010 Chester County Market Share
 
December 2009 Chester County Market Share
December 2009 Chester County Market ShareDecember 2009 Chester County Market Share
December 2009 Chester County Market Share
 
2010 March Montgomery County Market Share Analysis
2010 March Montgomery County Market Share Analysis2010 March Montgomery County Market Share Analysis
2010 March Montgomery County Market Share Analysis
 
January 2010 Montgomery County Market Share
January 2010 Montgomery County Market ShareJanuary 2010 Montgomery County Market Share
January 2010 Montgomery County Market Share
 
January 2010 Chester County Market Share
January 2010 Chester County Market ShareJanuary 2010 Chester County Market Share
January 2010 Chester County Market Share
 
July 2009 Delaware County Market Share
July 2009 Delaware County Market ShareJuly 2009 Delaware County Market Share
July 2009 Delaware County Market Share
 

Similar to Montgomery County Market Share

Similar to Montgomery County Market Share (19)

September 2010 Montgomery county Market Share
September 2010 Montgomery county Market ShareSeptember 2010 Montgomery county Market Share
September 2010 Montgomery county Market Share
 
July 2010 Montgomery County Market Share
July 2010 Montgomery County Market ShareJuly 2010 Montgomery County Market Share
July 2010 Montgomery County Market Share
 
2010 February Montgomery County Market Share
2010 February Montgomery County Market Share2010 February Montgomery County Market Share
2010 February Montgomery County Market Share
 
Montgomery county market share
Montgomery county market shareMontgomery county market share
Montgomery county market share
 
Montgomery county market share
Montgomery county market shareMontgomery county market share
Montgomery county market share
 
January 2010 Chester County M A R K E T S H A R E
January 2010 Chester  County  M A R K E T  S H A R EJanuary 2010 Chester  County  M A R K E T  S H A R E
January 2010 Chester County M A R K E T S H A R E
 
June 2010 Bucks County Market Share
June 2010 Bucks County Market ShareJune 2010 Bucks County Market Share
June 2010 Bucks County Market Share
 
April Chester County Market Share
April Chester County Market ShareApril Chester County Market Share
April Chester County Market Share
 
January Bucks County Market Share
January Bucks County Market ShareJanuary Bucks County Market Share
January Bucks County Market Share
 
Bucks County Market Share
Bucks County Market ShareBucks County Market Share
Bucks County Market Share
 
2010 March Chester County Market Share Analysis
2010 March Chester County Market Share Analysis2010 March Chester County Market Share Analysis
2010 March Chester County Market Share Analysis
 
June 2010 Chester County Market Share Analysis
June 2010 Chester County Market Share AnalysisJune 2010 Chester County Market Share Analysis
June 2010 Chester County Market Share Analysis
 
2010 Chester County Market Share Analysis
2010 Chester County Market Share Analysis2010 Chester County Market Share Analysis
2010 Chester County Market Share Analysis
 
July 2010 Chester County Market Share
July 2010 Chester County Market ShareJuly 2010 Chester County Market Share
July 2010 Chester County Market Share
 
April Bucks County Market Share
April Bucks County Market ShareApril Bucks County Market Share
April Bucks County Market Share
 
2010 March Chester County Market Share Analysis
2010 March Chester County Market Share Analysis2010 March Chester County Market Share Analysis
2010 March Chester County Market Share Analysis
 
June 2010 Delaware County Market Share Analysis
June 2010 Delaware County Market Share AnalysisJune 2010 Delaware County Market Share Analysis
June 2010 Delaware County Market Share Analysis
 
2010 March Bucks County Market Share Analysis
2010 March Bucks County Market Share Analysis2010 March Bucks County Market Share Analysis
2010 March Bucks County Market Share Analysis
 
Bucks county market share
Bucks county market shareBucks county market share
Bucks county market share
 

More from Prudential Fox & Roach, Realtors

September 2010 Montgomery County Month Supply of Inventory and Average Days o...
September 2010 Montgomery County Month Supply of Inventory and Average Days o...September 2010 Montgomery County Month Supply of Inventory and Average Days o...
September 2010 Montgomery County Month Supply of Inventory and Average Days o...
Prudential Fox & Roach, Realtors
 
July 2010 Montgomery County Month Supply of Inventory and Average Days on Market
July 2010 Montgomery County Month Supply of Inventory and Average Days on MarketJuly 2010 Montgomery County Month Supply of Inventory and Average Days on Market
July 2010 Montgomery County Month Supply of Inventory and Average Days on Market
Prudential Fox & Roach, Realtors
 

More from Prudential Fox & Roach, Realtors (20)

Bucks county market share
Bucks county market shareBucks county market share
Bucks county market share
 
Bucks county market share
Bucks county market shareBucks county market share
Bucks county market share
 
Bucks county market share
Bucks county market shareBucks county market share
Bucks county market share
 
September 2010 Bucks County Market Share
September 2010 Bucks County Market ShareSeptember 2010 Bucks County Market Share
September 2010 Bucks County Market Share
 
Bucks County Basic Supply and Demand
Bucks County Basic Supply and DemandBucks County Basic Supply and Demand
Bucks County Basic Supply and Demand
 
Montgomery county sold median price
Montgomery county sold median priceMontgomery county sold median price
Montgomery county sold median price
 
September 2010 Montgomery County Month Supply of Inventory and Average Days o...
September 2010 Montgomery County Month Supply of Inventory and Average Days o...September 2010 Montgomery County Month Supply of Inventory and Average Days o...
September 2010 Montgomery County Month Supply of Inventory and Average Days o...
 
September 2010 Montgomery County Sold Median Price
September 2010 Montgomery County Sold Median PriceSeptember 2010 Montgomery County Sold Median Price
September 2010 Montgomery County Sold Median Price
 
September 2010 Montgomery County Basic Supply And Demand
September 2010 Montgomery County Basic Supply And DemandSeptember 2010 Montgomery County Basic Supply And Demand
September 2010 Montgomery County Basic Supply And Demand
 
July 2010 Philadelphia County Market Share
July 2010 Philadelphia County Market ShareJuly 2010 Philadelphia County Market Share
July 2010 Philadelphia County Market Share
 
July 2010 Montgomery County Month Supply of Inventory and Average Days on Market
July 2010 Montgomery County Month Supply of Inventory and Average Days on MarketJuly 2010 Montgomery County Month Supply of Inventory and Average Days on Market
July 2010 Montgomery County Month Supply of Inventory and Average Days on Market
 
July 2010 Montgomery County Sold Median Price
July 2010 Montgomery County Sold Median PriceJuly 2010 Montgomery County Sold Median Price
July 2010 Montgomery County Sold Median Price
 
July 2010 Montgomery County Basic Supply and Demand
July 2010 Montgomery County Basic Supply and DemandJuly 2010 Montgomery County Basic Supply and Demand
July 2010 Montgomery County Basic Supply and Demand
 
July 2010 Philadelphia County Basic Supply and Demand
July 2010 Philadelphia County Basic Supply and DemandJuly 2010 Philadelphia County Basic Supply and Demand
July 2010 Philadelphia County Basic Supply and Demand
 
Philadelphia county sold median price
Philadelphia county sold median pricePhiladelphia county sold median price
Philadelphia county sold median price
 
Montgomery county msi and avg dom
Montgomery county msi and avg domMontgomery county msi and avg dom
Montgomery county msi and avg dom
 
Montgomery county basic supply and demand
Montgomery county basic supply and demandMontgomery county basic supply and demand
Montgomery county basic supply and demand
 
Montgomery county sold median price
Montgomery county sold median priceMontgomery county sold median price
Montgomery county sold median price
 
Delaware county msi and avg dom
Delaware county msi and avg domDelaware county msi and avg dom
Delaware county msi and avg dom
 
Delaware county market share
Delaware county market shareDelaware county market share
Delaware county market share
 

Recently uploaded

Land as a Resource for urban finanace- 24-1-23.ppt
Land as a Resource  for urban finanace- 24-1-23.pptLand as a Resource  for urban finanace- 24-1-23.ppt
Land as a Resource for urban finanace- 24-1-23.ppt
JIT KUMAR GUPTA
 
Listing Turkey - 2024 - May Featured Portfolio
Listing Turkey - 2024 - May Featured PortfolioListing Turkey - 2024 - May Featured Portfolio
Listing Turkey - 2024 - May Featured Portfolio
Listing Turkey
 
Acibadem Konaklari Uskudar - Listin Turkey
Acibadem Konaklari Uskudar - Listin TurkeyAcibadem Konaklari Uskudar - Listin Turkey
Acibadem Konaklari Uskudar - Listin Turkey
Listing Turkey
 
The Superior Living Batisehir - Listing Turkey
The Superior Living Batisehir - Listing TurkeyThe Superior Living Batisehir - Listing Turkey
The Superior Living Batisehir - Listing Turkey
Listing Turkey
 

Recently uploaded (20)

Dynamic Grandeur Undri Pune | A Space For You To Find Your Space
Dynamic Grandeur Undri Pune | A Space For You To Find Your SpaceDynamic Grandeur Undri Pune | A Space For You To Find Your Space
Dynamic Grandeur Undri Pune | A Space For You To Find Your Space
 
Housing Price Regulation Thesis Defense by Slidesgo.pptx
Housing Price Regulation Thesis Defense by Slidesgo.pptxHousing Price Regulation Thesis Defense by Slidesgo.pptx
Housing Price Regulation Thesis Defense by Slidesgo.pptx
 
Are You Thinking About Buying a Home | KM Realty Group LLC
Are You Thinking About Buying a Home | KM Realty Group LLCAre You Thinking About Buying a Home | KM Realty Group LLC
Are You Thinking About Buying a Home | KM Realty Group LLC
 
The Wall Street Journal Weekend_Febrero 2024
The Wall Street Journal Weekend_Febrero 2024The Wall Street Journal Weekend_Febrero 2024
The Wall Street Journal Weekend_Febrero 2024
 
Kohinoor Viva Pixel Dhanori Pune Brochure.pdf
Kohinoor Viva Pixel Dhanori Pune Brochure.pdfKohinoor Viva Pixel Dhanori Pune Brochure.pdf
Kohinoor Viva Pixel Dhanori Pune Brochure.pdf
 
Land as a Resource for urban finanace- 24-1-23.ppt
Land as a Resource  for urban finanace- 24-1-23.pptLand as a Resource  for urban finanace- 24-1-23.ppt
Land as a Resource for urban finanace- 24-1-23.ppt
 
Unveiling the Veil: The Top Challenges with Estate Agents?
Unveiling the Veil: The Top Challenges with Estate Agents?Unveiling the Veil: The Top Challenges with Estate Agents?
Unveiling the Veil: The Top Challenges with Estate Agents?
 
Kohinoor Greentastic At Kharadi, Pune - PDF.pdf
Kohinoor Greentastic At Kharadi, Pune - PDF.pdfKohinoor Greentastic At Kharadi, Pune - PDF.pdf
Kohinoor Greentastic At Kharadi, Pune - PDF.pdf
 
Yashwin Enchante Uppar Kharadi Pune E-Brochue.pdf
Yashwin Enchante Uppar Kharadi Pune  E-Brochue.pdfYashwin Enchante Uppar Kharadi Pune  E-Brochue.pdf
Yashwin Enchante Uppar Kharadi Pune E-Brochue.pdf
 
Nyati Elite NIBM Road Pune E Brochure.pdf
Nyati Elite NIBM Road Pune E Brochure.pdfNyati Elite NIBM Road Pune E Brochure.pdf
Nyati Elite NIBM Road Pune E Brochure.pdf
 
Listing Turkey - 2024 - May Featured Portfolio
Listing Turkey - 2024 - May Featured PortfolioListing Turkey - 2024 - May Featured Portfolio
Listing Turkey - 2024 - May Featured Portfolio
 
Lodha Baner Flat In Pune E-Brochure.pdf
Lodha Baner Flat In Pune  E-Brochure.pdfLodha Baner Flat In Pune  E-Brochure.pdf
Lodha Baner Flat In Pune E-Brochure.pdf
 
San Francisco Market Update -February 2024
San Francisco Market Update -February 2024San Francisco Market Update -February 2024
San Francisco Market Update -February 2024
 
Kohinoor Courtyard One Wakad Pune | Elegant Living Spaces
Kohinoor Courtyard One Wakad Pune | Elegant Living SpacesKohinoor Courtyard One Wakad Pune | Elegant Living Spaces
Kohinoor Courtyard One Wakad Pune | Elegant Living Spaces
 
Ganga Platinum Kharadi Pune brochure.pdf
Ganga Platinum Kharadi Pune brochure.pdfGanga Platinum Kharadi Pune brochure.pdf
Ganga Platinum Kharadi Pune brochure.pdf
 
Acibadem Konaklari Uskudar - Listin Turkey
Acibadem Konaklari Uskudar - Listin TurkeyAcibadem Konaklari Uskudar - Listin Turkey
Acibadem Konaklari Uskudar - Listin Turkey
 
Unique NIBM Flat In Pune E-Brochure.pdf
Unique NIBM Flat In Pune  E-Brochure.pdfUnique NIBM Flat In Pune  E-Brochure.pdf
Unique NIBM Flat In Pune E-Brochure.pdf
 
The Superior Living Batisehir - Listing Turkey
The Superior Living Batisehir - Listing TurkeyThe Superior Living Batisehir - Listing Turkey
The Superior Living Batisehir - Listing Turkey
 
Improvise, Adapt, Overcome - Sales Meeting, May '24
Improvise, Adapt, Overcome - Sales Meeting, May '24Improvise, Adapt, Overcome - Sales Meeting, May '24
Improvise, Adapt, Overcome - Sales Meeting, May '24
 
Vanam At Purva Soukhyam Guduvanchery.pdf.pdf
Vanam At Purva Soukhyam Guduvanchery.pdf.pdfVanam At Purva Soukhyam Guduvanchery.pdf.pdf
Vanam At Purva Soukhyam Guduvanchery.pdf.pdf
 

Montgomery County Market Share

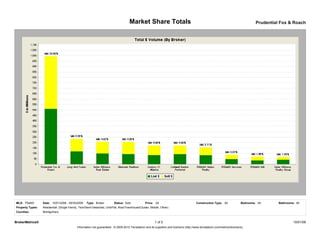
  • 1. Market Share Totals Prudential Fox & Roach MLS: TReND Date: 10/01/2008 - 09/30/2009 Type: Broker Status: Sold Price: All Construction Type: All Bedrooms: All Bathrooms: All Property Types: Residential: (Single Family, Twin/Semi-Detached, Unit/Flat, Row/Townhouse/Cluster, Mobile, Other) Counties: Montgomery BrokerMetrics® 1 of 2 10/01/09 Information not guaranteed. © 2009-2010 Terradatum and its suppliers and licensors (http://www.terradatum.com/metrics/licensors).
  • 2. Market Share Totals Prudential Fox & Roach Total $ Volume Prod Prod Market Avg Agents Agents # Name List # List $ Sell # Sell $ Total # Total $ Share % Price DOM (Total) (Search) Ofcs 1 Prudential Fox & Roach 1,169 510,988,840 1,159 483,590,168 2,328 994,579,008 23.65 427,225 89 1,643 744 34 2 Long And Foster 331 119,087,163 359 114,456,290 690 233,543,453 5.55 338,469 86 612 316 18 3 Keller Williams Real Estate 320 99,770,993 345 107,070,376 665 206,841,369 4.92 311,040 73 141 102 2 4 Weichert Realtors 315 94,426,905 391 110,860,065 706 205,286,970 4.88 290,775 82 470 258 19 5 Century 21 Alliance 322 84,920,490 337 87,046,281 659 171,966,771 4.09 260,951 81 499 194 16 6 Coldwell Banker Preferred 293 93,609,950 243 78,259,256 536 171,869,206 4.09 320,652 86 300 137 7 7 RE/MAX Action Realty 284 83,058,525 247 72,914,312 531 155,972,837 3.71 293,734 71 108 110 2 8 RE/MAX Services 172 47,799,950 145 39,307,063 317 87,107,013 2.07 274,786 78 60 53 1 9 RE/MAX 440 150 35,101,777 149 34,909,594 299 70,011,371 1.66 234,152 94 99 82 7 10 Keller Williams Realty Group 204 41,553,503 125 25,085,859 329 66,639,362 1.58 202,551 85 95 64 2 Subtotals/Averages 3,560 1,210,318,096 3,500 1,153,499,264 7,060 2,363,817,360 56.20 334,818 84 4,027 2,060 108 MLS Totals/Averages 7,005 2,102,842,372 7,005 2,102,842,372 14,010 4,205,684,744 100.00 300,192 83 9,641 4,356 678 BrokerMetrics® 2 of 2 10/01/09 Information not guaranteed. © 2009-2010 Terradatum and its suppliers and licensors (http://www.terradatum.com/metrics/licensors).