More Related Content
Similar to 2010 February Chester County Market Share
Similar to 2010 February Chester County Market Share (20)
More from Prudential Fox & Roach, Realtors
More from Prudential Fox & Roach, Realtors (20)
2010 February Chester County Market Share
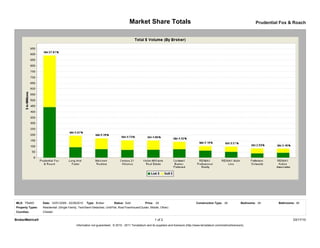
- 1. Market Share Totals Prudential Fox & Roach
MLS: TReND Date: 03/01/2009 - 02/28/2010 Type: Broker Status: Sold Price: All Construction Type: All Bedrooms: All Bathrooms: All
Property Types: Residential: (Single Family, Twin/Semi-Detached, Unit/Flat, Row/Townhouse/Cluster, Mobile, Other)
Counties: Chester
BrokerMetrics® 1 of 2 03/17/10
Information not guaranteed. © 2010 - 2011 Terradatum and its suppliers and licensors (http://www.terradatum.com/metrics/licensors).
- 2. Market Share Totals Prudential Fox & Roach
Total $ Volume
Prod Prod
Market Avg Agents Agents
# Name List # List $ Sell # Sell $ Total # Total $ Share % Price DOM (Total) (Search) Ofcs
1 Prudential Fox & Roach 1,052 440,577,142 1,113 448,566,285 2,165 889,143,427 27.81 410,690 91 1,680 652 32
2 Long And Foster 261 91,195,227 302 99,562,483 563 190,757,710 5.97 338,824 86 535 219 13
3 Weichert Realtors 209 75,002,482 286 93,140,049 495 168,142,531 5.26 339,682 95 422 193 13
4 Century 21 Alliance 235 68,390,211 281 82,702,695 516 151,092,906 4.73 292,816 84 433 168 14
5 Keller Williams Real Estate 236 69,206,255 289 80,327,045 525 149,533,300 4.68 284,825 80 256 88 4
6 Coldwell Banker Preferred 208 73,831,566 185 64,377,603 393 138,209,169 4.32 351,677 79 308 115 7
7 RE/MAX Professional Realty 188 61,567,667 125 39,375,700 313 100,943,367 3.16 322,503 77 43 49 1
8 RE/MAX Main Line 155 51,643,673 123 44,654,455 278 96,298,128 3.01 346,396 76 48 42 3
9 Patterson-Schwartz 82 37,900,948 92 42,947,493 174 80,848,441 2.53 464,646 90 257 65 4
10 RE/MAX Action Associates 169 43,472,349 123 34,984,702 292 78,457,051 2.45 268,689 74 32 30 1
Subtotals/Averages 2,795 1,012,787,520 2,919 1,030,638,510 5,714 2,043,426,030 63.92 357,617 86 4,014 1,621 92
MLS Totals/Averages 4,764 1,598,677,232 4,764 1,598,677,232 9,528 3,197,354,464 100.00 335,575 87 8,620 2,929 495
BrokerMetrics® 2 of 2 03/17/10
Information not guaranteed. © 2010 - 2011 Terradatum and its suppliers and licensors (http://www.terradatum.com/metrics/licensors).