Recruiting yield ratios
•Download as DOCX, PDF•
7 likes•12,052 views

Recruiting yield ratios are key performance indicators that measure the efficiency of a company's hiring process by calculating the percentage of candidates who progress from each stage to the next. They can reveal problems like biases that cause some groups to drop out at higher rates. Analyzing yield ratios over time based on factors like gender, source of hire, or position can provide insights into how to improve fairness and efficiency. While useful, yield ratios need to be considered alongside cost data and may not tell much about a process with small candidate numbers.

Recommended
Recommended
More Related Content
What's hot
What's hot (20)
Similar to Recruiting yield ratios
Similar to Recruiting yield ratios (20)
More from Preeti Bhaskar
More from Preeti Bhaskar (20)
Recently uploaded
Recently uploaded (20)
Recruiting yield ratios
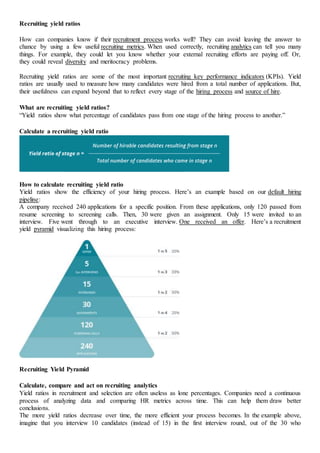
- 1. Recruiting yield ratios How can companies know if their recruitment process works well? They can avoid leaving the answer to chance by using a few useful recruiting metrics. When used correctly, recruiting analytics can tell you many things. For example, they could let you know whether your external recruiting efforts are paying off. Or, they could reveal diversity and meritocracy problems. Recruiting yield ratios are some of the most important recruiting key performance indicators (KPIs). Yield ratios are usually used to measure how many candidates were hired from a total number of applications. But, their usefulness can expand beyond that to reflect every stage of the hiring process and source of hire. What are recruiting yield ratios? “Yield ratios show what percentage of candidates pass from one stage of the hiring process to another.” Calculate a recruiting yield ratio How to calculate recruiting yield ratio Yield ratios show the efficiency of your hiring process. Here’s an example based on our default hiring pipeline: A company received 240 applications for a specific position. From these applications, only 120 passed from resume screening to screening calls. Then, 30 were given an assignment. Only 15 were invited to an interview. Five went through to an executive interview. One received an offer. Here’s a recruitment yield pyramid visualizing this hiring process: Recruiting Yield Pyramid Calculate, compare and act on recruiting analytics Yield ratios in recruitment and selection are often useless as lone percentages. Companies need a continuous process of analyzing data and comparing HR metrics across time. This can help them draw better conclusions. The more yield ratios decrease over time, the more efficient your process becomes. In the example above, imagine that you interview 10 candidates (instead of 15) in the first interview round, out of the 30 who
- 2. received an assignment. This signifies a decreased HR yield ratio – only one third (instead of half) of the 30 candidates passed through to an interview, saving your interviewing team a lot of time and effort. Note that decreasing the number of candidates who pass through each stage shouldn’t decrease quality of hire. It should just mean that you’re employing better screening techniques. Also, when you want to measure the quality of a particular source, e.g. an external recruiter, passing more candidates from the ‘application’ to the ‘screening call’ phase could be a good thing. It could mean that this particular recruiter brings in a lot of good candidates. The recruitment yield pyramid above could also represent expected ratios when hiring for a specific position. Looking at the pyramid, you can see that 240 applicants will probably result in one hire. This means that if you want to hire three new people, instead of one, for a role (e.g. if you’re expanding your customer support team), you’ll probably need three times as many candidates (720 applicants). Using this estimate, you’ll be able to guess that, if half of your average time-to-fill has passed and you’ve only received 500 applications, you’ll probably need to rethink your job advertisement or sourcing strategies. The same goes for each stage of the hiring pipeline; if you see that you’ve given an assignment to just 50 people, instead of 90, it might be a good idea to go back and re-evaluate some candidates to improve your time-to-hire. Yield metrics can also help you figure out whether your recruitment strategies and sources are effective. For example, you could assess an external agency’s services as a candidate source. Imagine you received 200 resumes from an agency and only 5% of them passed through your screening call phase. This low yield could signify a problem. You might need to communicate more clearly with your external agency about position requirements. Or, maybe, the agency’s audience just isn’t right for you. You could also compare recruitment ratios from different sources like recruitment agencies, employee referrals and job boards to see which source is most effective for you. For example: By exploring the meaning behind recruitment yield ratios, you can build a more efficient recruiting strategy. If for example, your yield ratio of qualified hires from pay-per-click job boards is consistently better than your yield ratio from recruiting agencies, that’s something to look into. Delving deeper into yield ratios Yield ratios can give you an in-depth picture of your hiring process when they’re analyzed according to certain criteria. For example, imagine that you calculate the gender ratio for new hires. You find that 20 percent of your total new hires are women. You could perform the same kind of calculation for minorities. For example, you could find that employees of a particular race only make up 1 percent of new hires. Why is that? Do your job ads discourage female applicants or minorities? Do you advertise in the wrong places? Or, are hiring biases undermining your interview process? Yield ratios can give an indication of the truth. Let’s break down the numbers. Imagine that out of 240 applicants, 110 are women and 130 are men. These numbers seem relatively balanced. You have an indication that your job ads are probably gender neutral. Then, you go to the next phase. You could calculate the yield ratio for people who passed through resume screening to the screening call phase. Imagine that, out of the 120 who made it to the screening call stage, 30 were women. The yield ratio would be 27.2% for women and 69.2% for men. One explanation could be
- 3. that women applicants were simply not as qualified for this position as men. Yet, research shows that women are less likely than men to apply to a position if they don’t meet all job requirements. This fact, along with your low yield ratio, could indicate that there might be a bias problem in your resume screening phase. Hiring teams can tackle these kinds of hiring biases by opting for anonymous interviewing platforms or using tools that conceal candidates’ photos and names when screening resumes. There are many ways to play around with metrics. Each ratio gives you a hint at something, whether good or bad. If you interpret ratios carefully, and act on solving problems, you’re more likely to make your process fair and efficient. Note that it’s best to calculate yield ratios per position, or seniority level. For example, in aggregate, you may have favorable minority yield ratios. But you might find minority candidates are well represented in low-level positions, while your executive team is all-white-male. How do I collect recruiting yield ratio data? Spreadsheets might be fun at first, when data is limited. But, if you want to monitor annual yield ratio trends in detail, you’ll need a more efficient approach. An Applicant Tracking System (ATS) could help you collect and store detailed data and reports. What Yield Ratio KPI Actually Shows to HR? Yield ratio in HR shows the percentage of candidates from the recruitment sources that were selected for the next stage of a hiring process. In simple words yield ratios show the efficiency of the certain recruitment method. Information about yield ratio allows HR and CEO to make informed decisions about the recruitment process. They will be able to focus recruitment strategy on reaching the right candidates at a lower cost How to calculate a Yield Ratio KPI Yield Ratio = (Number of leads from recruitment method / Number of candidates invited to interview) x 100%. It is not necessary measure the lead to interview conversion rate, you might also want to measure visitor to lead or lead to hire ratios. Example of using Yield Ration KPI in HR Company posted information about new positions opened in the job section of a professional community on LinkedIn. During 2 weeks 200 visitors followed the given link, 8 of them filled in a contact form and 2 were shortlisted for an interview.
- 4. Yield ratio: (2 / 8) x 100% = 25% Company used Google Adwords and posted advertisement. The average cost per click was $1.2 and a company has got 154 clicks, to total cost of the campaign was $200. 20% of visitors (30 candidates) filled in a contact form and sent their CVs. Among these CVs 12 persons were invited to an interview. Yield ratio: (12 / 30) x 100% = 40% Yield ratio and the cost As it was shown in an example, the yield ratio for the second case is higher, but we should take into account the cost. In the second case the cost of getting 12 candidates to interview was $200 +managerial efforts to add an advertisement to AdWords, while in the first case the direct cost was zero and the only investment was half an hour of the manager’s time to find an appropriate group and post information there. When comparing yield ratios, you should always compare the costs as well. Using yield ratio to scale the recruitment The goal behind calculating of the yield ratio is to find the source that gives the best candidates at the lowest cost. The next logical step is to invest more in this recruiting source. Unfortunately, this doesn’t always work. For example: A company has found out that the best yield ratio was among candidates that were refereed by employees of the company. There were no direct costs associated with this method. The company decided to expand this method or recruitment and suggested a referral program to its employees after the implementation of the new initiatives was done. It appeared that yield ratio for this source was much lower than before. Conclusions Conduct constant controls check of the yield ratio. The business system behind the recruitment source might have changed and the quality of candidates might have changed as well. When introducing initiatives that supposed to scale the usage of the specific recruitment source, do a yield ratio control check each time you double the scale. Yield Ratio Doesn’t Tell a Story in a Case of Small Numbers If you deal with small number of candidates then yield ratio doesn’t tell a story. Example: the first advertisement has seen 3 visitors and just 1 filled in the form, the yield ratio was 33%. Four visitors have seen the second advertisement and 2 of them filled in a form, the yield ratio was 50%. The error factor of yield ratio in this case is too high. As a result we cannot make any decision on which method is better. Possible solution: Do some long term research. Gather some data about using certain recruitment source for a long period of time. Building Yield Pyramid When you know the yield ratio on different levels you can build a yield pyramid. You plan to open 4 positions for software developers. You know that interview to hire ratio is 30%, so you need approximately 14 interviews. Candidate to the interview ratio is 20% for selected method, so you know that you need 70 leads from this source. You can use these numbers to qualify leads as we discussed regarding the “Time to fill” KPI and plan HR strategy accordingly. Limitations of the Yield Ratio KPI Calculating the yield ratio KPI shows how good the auditory of the certain recruitment source is at converting into interviews and candidates. Most likely if you will post a similar job the yield ratio will be similar as well. For a different type of the job you might need to find a better recruitment source. That’s why it is necessary to test the yield ratio continuously.